
Silver Price Forecast: XAG/USD consolidates near $39.00, bulls target multi-year high
- Silver consolidates near $39.00 after hitting a one-month high of $39.12 earlier in the session.
- The US Dollar remains under pressure despite upbeat GDP data, offering support to non-yielding assets such as Silver.
- XAG/USD confirms a bullish breakout, holding above key moving averages after a successful retest of the triangle pattern.
Silver (XAG/USD) is consolidating gains near one-month highs on Thursday, following a successful retest of former triangle resistance around $38.00. Wednesday’s rebound confirmed the breakout structure and helped reinforce bullish momentum, supported by a softer US Dollar (USD). With XAG/USD holding above key moving averages, the near-term technical outlook remains constructive for bulls.
At the time of writing, XAG/USD is trading near $38.90, having reached an intraday high of $39.12, its strongest since July 25. The metal continues to benefit from a softer Greenback, which remains under pressure as traders digest a fresh batch of US economic data, with market participants reassessing the Federal Reserve's (Fed) monetary policy path following a mix of solid growth and easing inflation signals.
Thursday’s macro data offered a mixed signal for policy expectations. The second estimate of US Q2 Gross Domestic Product (GDP) showed a slightly stronger 3.3% annualized expansion, up from 3.0% previously and marginally above the 3.1% consensus. Meanwhile, weekly Initial Jobless Claims ticked down to 229,000, suggesting continued labor market resilience. However, preliminary Q2 Core Personal Consumption Expenditure (PCE) came in at 2.5% QoQ, softer than the 2.6% forecast, while the GDP Price Index and headline PCE both eased to 2.0% from 2.1%.
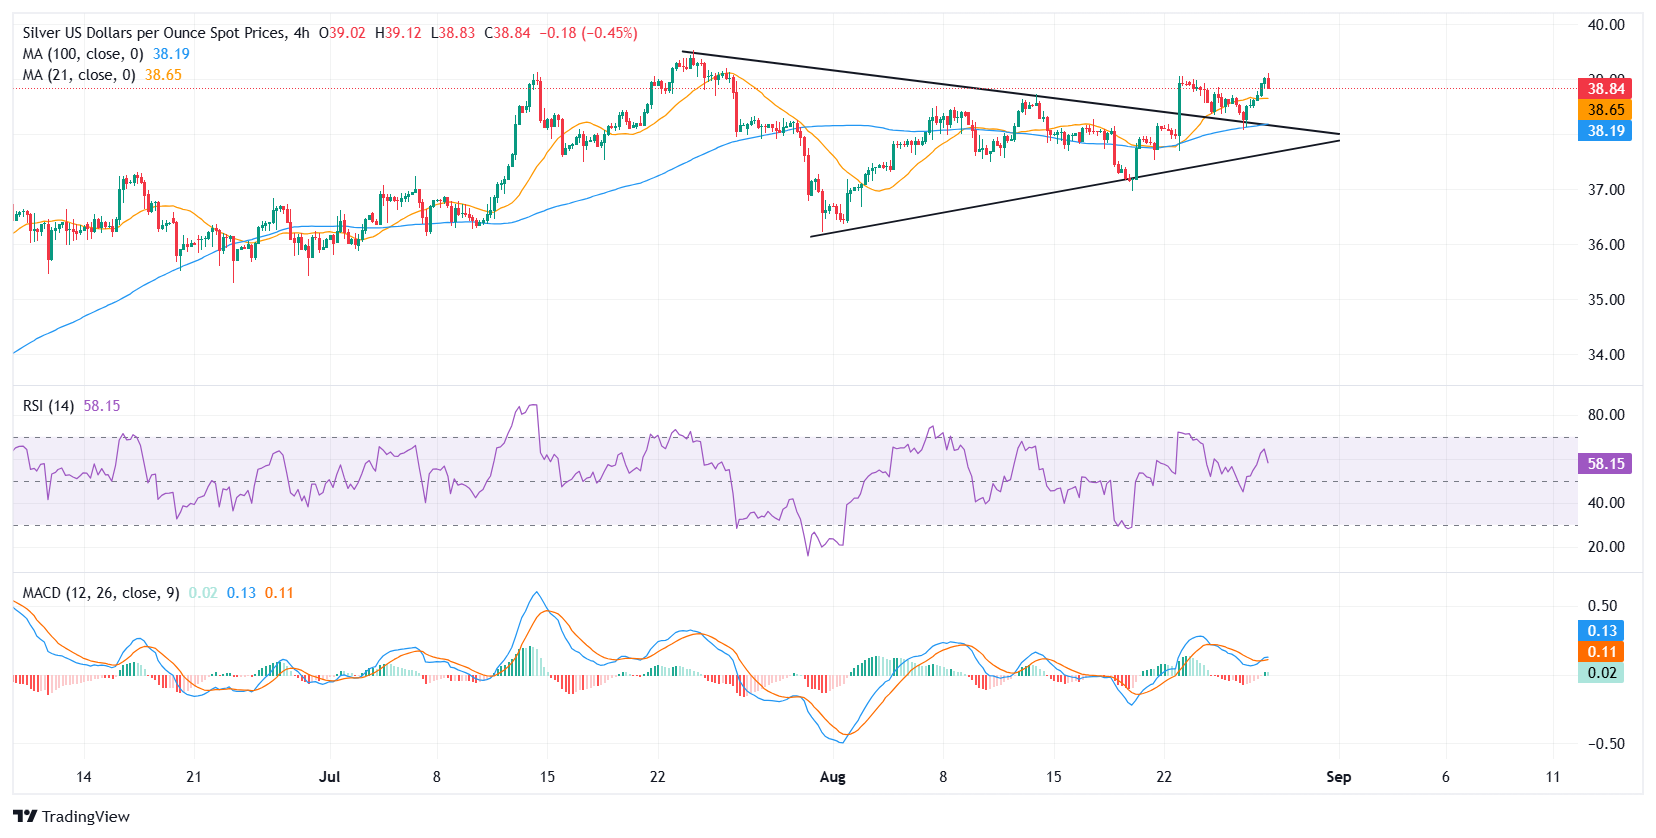
From a technical standpoint, Silver confirmed a bullish breakout above a symmetrical triangle on the 4-hour chart, as price surged past the triangle’s upper boundary and key moving averages. The move follows Wednesday’s successful retest of the breakout zone near $38.00, which held firm thanks to support from the 100-period Simple Moving Average (SMA) and a recovery in bullish momentum.
The breakout was reinforced by a close above the 21-period Simple Moving Average (SMA) at $38.65, while the 100-SMA near $38.19 continues to act as dynamic support. These levels now serve as the first defense zones should the market correct lower in the near term. On the upside, immediate resistance is seen at the intraday high of $39.12. A sustained break above this level would pave the way for a test of the multi-year peak near $39.53.
Momentum indicators support the bullish bias. The Relative Strength Index (RSI) has climbed to 59.99, suggesting growing upward momentum but still shy of overbought conditions. The Moving Average Convergence Divergence (MACD) indicates a clear bullish crossover, with the MACD line above the signal line and the histogram displaying green bars, underscoring that bullish momentum is gaining traction.
Silver FAQs
Silver is a precious metal highly traded among investors. It has been historically used as a store of value and a medium of exchange. Although less popular than Gold, traders may turn to Silver to diversify their investment portfolio, for its intrinsic value or as a potential hedge during high-inflation periods. Investors can buy physical Silver, in coins or in bars, or trade it through vehicles such as Exchange Traded Funds, which track its price on international markets.
Silver prices can move due to a wide range of factors. Geopolitical instability or fears of a deep recession can make Silver price escalate due to its safe-haven status, although to a lesser extent than Gold's. As a yieldless asset, Silver tends to rise with lower interest rates. Its moves also depend on how the US Dollar (USD) behaves as the asset is priced in dollars (XAG/USD). A strong Dollar tends to keep the price of Silver at bay, whereas a weaker Dollar is likely to propel prices up. Other factors such as investment demand, mining supply – Silver is much more abundant than Gold – and recycling rates can also affect prices.
Silver is widely used in industry, particularly in sectors such as electronics or solar energy, as it has one of the highest electric conductivity of all metals – more than Copper and Gold. A surge in demand can increase prices, while a decline tends to lower them. Dynamics in the US, Chinese and Indian economies can also contribute to price swings: for the US and particularly China, their big industrial sectors use Silver in various processes; in India, consumers’ demand for the precious metal for jewellery also plays a key role in setting prices.
Silver prices tend to follow Gold's moves. When Gold prices rise, Silver typically follows suit, as their status as safe-haven assets is similar. The Gold/Silver ratio, which shows the number of ounces of Silver needed to equal the value of one ounce of Gold, may help to determine the relative valuation between both metals. Some investors may consider a high ratio as an indicator that Silver is undervalued, or Gold is overvalued. On the contrary, a low ratio might suggest that Gold is undervalued relative to Silver.
추천 기사


