
GBP/USD holds near 1.3500 as ceasefire hopes offset Fed, UK CPI risks
- GBP/USD erases early losses as reports suggest potential Trump–Zelenskiy talks in Moscow, boosting hopes of war resolution.
- Fed’s Bowman maintains outlook for three rate cuts in 2025, emphasizing greater focus on employment amid cooling inflation.
- UK July CPI expected at 3.7%; sticky services inflation could pressure BoE to slow its easing cycle later this year.
GBP/USD holds firm at around 1.3500 on Tuesday amid reports of a possible end to the war between Ukraine and Russia. At the same time, traders await inflation data in the UK, the latest minutes of the Federal Reserve’s (Fed) July meeting, and the Fed Chair Jerome Powell's speech at Jackson Hole.
Sterling steadies with traders awaiting UK inflation data and Powell’s Jackson Hole speech
Geopolitical developments are being cheered by investors, with the Pound erasing some of its earlier losses. Last Friday’s Trump-Putin meeting laid the groundwork for Monday’s summit between Washington and European leaders, including Ukraine’s President Volodymyr Zelenskiy. Recently, Sky News Arabia reported that Putin proposed that Trump meet Zelenskiy in Moscow.
Recently, a Fed official crossed the newswires as traders brace for Powell’s speech at Jackson Hole. Governor Michelle Bowman said that her views had not changed, projecting three rate cuts in 2025, and emphasized that the Fed should be more focused on the employment mandate.
Data-wise, US Housing Starts in July expanded 5.2% up from 1.321 million to 1.428 million, exceeding estimates for a dip to 1.29 million. Contrarily, Building Permits for the same period contracted from 1.386 million to 1.354 million.
Across the pond, market participants are laser-focused on the release of inflation figures for July. The Consumer Price Index (CPI) is expected at 3.7%, while the services CPI is projected to rise by 4.8%. Although the inflation print could dent the Bank of England (BoE )'s chances to continue easing policy, the last Reuters poll hinted that economists project the Bank Rate to end 2025 at 3.75%, meaning that they’re pricing one more 25 basis points (bps) cut towards the end of the year.
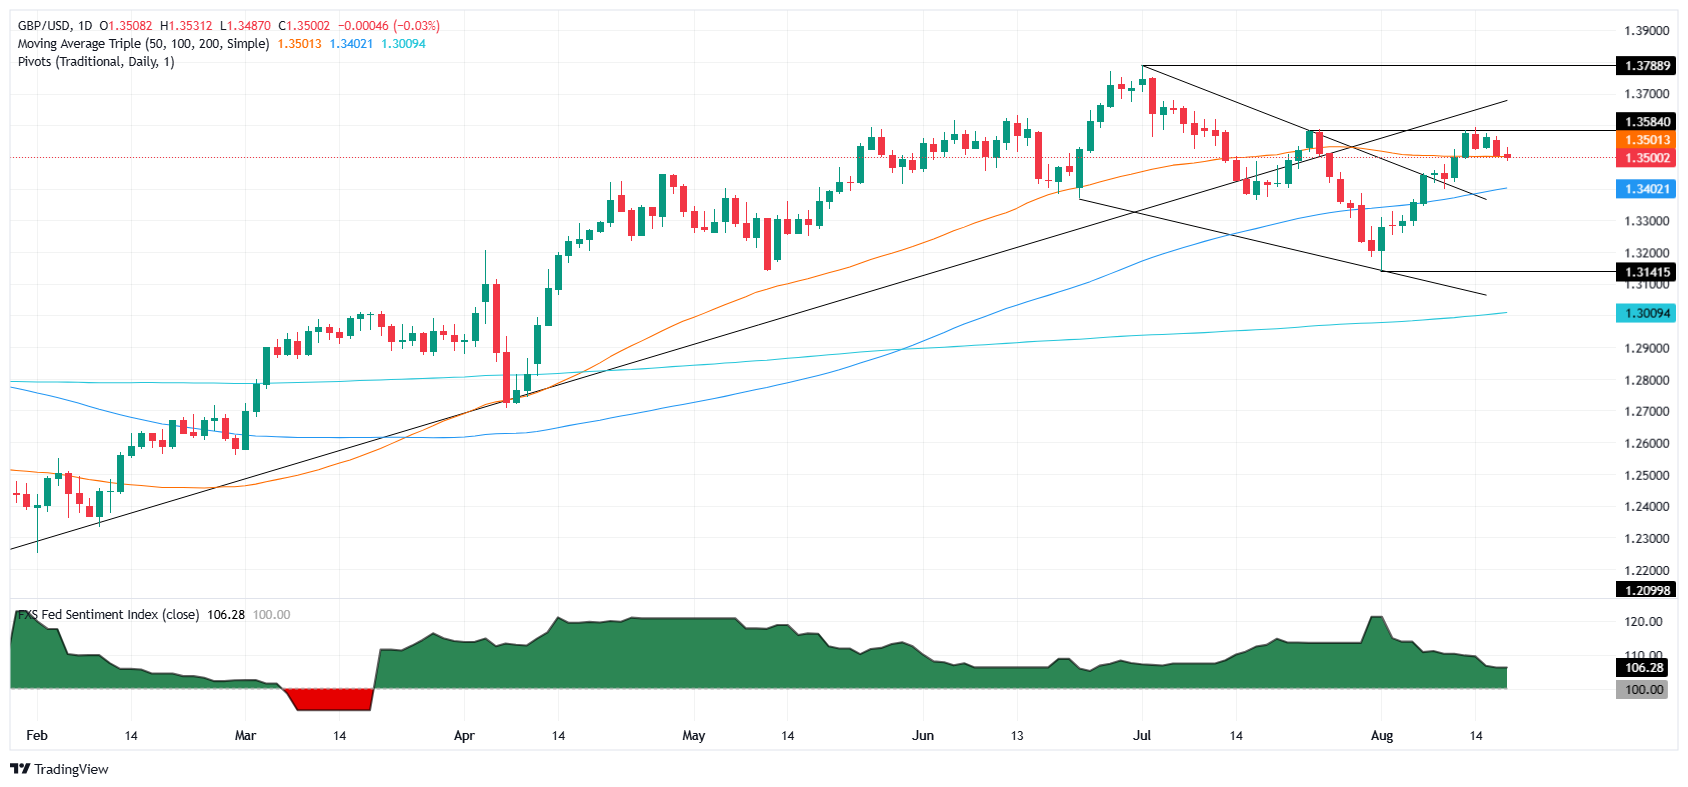
GBP/USD Price Forecast: Technical outlook
The GBP/USD uptrend has stalled, but it remains supported by the 50-day Simple Moving Average (SMA) at 1.3497. The Relative Strength Index (RSI) is bullish, but it remains flat. This indicates that the pair could trade sideways.
If the pair climbs above August’s 18 high of 1.3565, expect a test of 1.3600. Otherwise, if GBP/USD tumbles below 1.3500, the first support is the 50-day SMA, followed by the 20-day SMA at 1.3416, ahead of 1.3400.
British Pound PRICE This week
The table below shows the percentage change of British Pound (GBP) against listed major currencies this week. British Pound was the strongest against the Australian Dollar.
| USD | EUR | GBP | JPY | CAD | AUD | NZD | CHF | |
|---|---|---|---|---|---|---|---|---|
| USD | 0.41% | 0.40% | 0.40% | 0.29% | 0.75% | 0.36% | 0.13% | |
| EUR | -0.41% | -0.01% | -0.02% | -0.12% | 0.35% | -0.08% | -0.27% | |
| GBP | -0.40% | 0.01% | -0.10% | -0.11% | 0.36% | -0.07% | -0.30% | |
| JPY | -0.40% | 0.02% | 0.10% | -0.10% | 0.36% | -0.02% | -0.27% | |
| CAD | -0.29% | 0.12% | 0.11% | 0.10% | 0.44% | 0.07% | -0.20% | |
| AUD | -0.75% | -0.35% | -0.36% | -0.36% | -0.44% | -0.43% | -0.67% | |
| NZD | -0.36% | 0.08% | 0.07% | 0.02% | -0.07% | 0.43% | -0.26% | |
| CHF | -0.13% | 0.27% | 0.30% | 0.27% | 0.20% | 0.67% | 0.26% |
The heat map shows percentage changes of major currencies against each other. The base currency is picked from the left column, while the quote currency is picked from the top row. For example, if you pick the British Pound from the left column and move along the horizontal line to the US Dollar, the percentage change displayed in the box will represent GBP (base)/USD (quote).
추천 기사


