Cosmos Price Prediction: ATOM eyes 30% rally after successful breakout

Source Fxstreet
  • Cosmos price recorded a downtrend break, followed by a breakout and subsequent retest of the $11.22 key level.
  • ATOM could extend to the top of the range at $17.19 for a 30% swing trade.
  • A break and close below $10.00 psychological level would produce a lower low, invalidating the bullish thesis.  

Cosmos (ATOM), which set out to make blockchain technology less complex for developers with its modular framework that demystifies decentralized apps, could be the next token to rally as meme coins and g AI crypto coins surge.

Also Read: Cosmos price likely to bounce 10% as ATOM overcomes key resistance

Cosmos price confirms breakout

Cosmos (ATOM) price escaped the confines of a descending parallel channel on February 27, but the move proved premature on the three-day time frame. However, a subsequent move on March 1 materialized as the ATOM price managed to close above the channel.

With the March 4 retest on the 3-day chart below, Cosmos price could finally be ready for an extended move north, with the next possible stop being the top of the range at $17.19, levels last seen in September of 2022. Such a move would constitute a 30% climb above current levels.

The volume indicator shows large bars, suggesting a strengthening price trend. The northbound Relative Strength Index (RSI) also points to rising momentum, increasing the odds for further upside.

In a highly bullish case, Cosmos price could clear the $17.19 blockade, potentially extending to hit the $20.00 psychological level. This would denote a 50% climb above current levels.

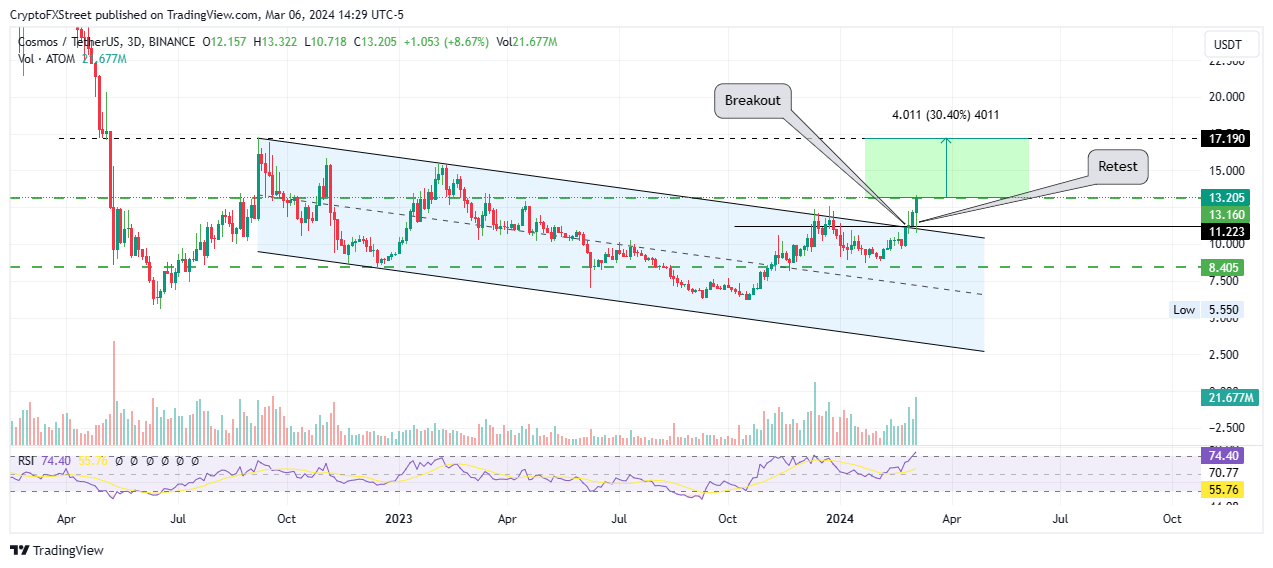
ATOM/USDT 3-day chart

On the flip side, a rejection from the $13.16 roadblock could see Cosmos price retract, potentially retesting the $11.22 support. An extended fall could see ATOM price slip below the $10.00 psychological level. A candlestick close below this level on the 3-day time frame would produce a lower low, potentially invalidating the bullish thesis. 

Disclaimer: For information purposes only. Past performance is not indicative of future results.
placeholder
ECB Policy Outlook for 2026: What It Could Mean for the Euro’s Next MoveWith the ECB likely holding rates steady at 2.15% and the Fed potentially extending cuts into 2026, EUR/USD may test 1.20 if Eurozone growth proves resilient, but weaker growth and an ECB pivot could pull the pair back toward 1.13 and potentially 1.10.
Author  Mitrade
Dec 26, 2025
With the ECB likely holding rates steady at 2.15% and the Fed potentially extending cuts into 2026, EUR/USD may test 1.20 if Eurozone growth proves resilient, but weaker growth and an ECB pivot could pull the pair back toward 1.13 and potentially 1.10.
placeholder
My Top 5 Stock Market Predictions for 2026Five 2026 market predictions written in a native, news-style voice: AI’s winners and losers, broader sector leadership, dividend demand, valuation cooling as the Shiller CAPE sits at 39 (Dec. 31, 2025), and quantum-computing bursts—while keeping all original facts and numbers unchanged.
Author  Mitrade
Jan 06, Tue
Five 2026 market predictions written in a native, news-style voice: AI’s winners and losers, broader sector leadership, dividend demand, valuation cooling as the Shiller CAPE sits at 39 (Dec. 31, 2025), and quantum-computing bursts—while keeping all original facts and numbers unchanged.
placeholder
Financial Markets 2026: Volatility Catalysts in Gold, Silver, Oil, and Blue-Chip Stocks—A CFD Trader's OutlookGet a comprehensive financial market 2026 outlook exploring key economic drivers, volatility catalysts in gold, oil and stocks, and what the evolving economic outlook means for cfd trading strategies and risk management on global markets.
Author  Rachel Weiss
Yesterday 11: 37
Get a comprehensive financial market 2026 outlook exploring key economic drivers, volatility catalysts in gold, oil and stocks, and what the evolving economic outlook means for cfd trading strategies and risk management on global markets.
placeholder
Bitcoin Weekly Forecast: Is the month-long rally over?Bitcoin (BTC) edges slightly lower so far this week, trading at $80,800 on Friday after being rejected around the key overhead supply zone. Institutional investors also show cautious signs, with BTC spot Exchange Traded Funds (ETFs) recording an outflow of over $709 million through Thursday.
Author  Bitcoinist
Yesterday 10: 46
Bitcoin (BTC) edges slightly lower so far this week, trading at $80,800 on Friday after being rejected around the key overhead supply zone. Institutional investors also show cautious signs, with BTC spot Exchange Traded Funds (ETFs) recording an outflow of over $709 million through Thursday.
placeholder
Financial Markets 2026: Volatility Catalysts in Gold, Silver, Oil, and Blue-Chip Stocks—A CFD Trader's OutlookGet a comprehensive financial market 2026 outlook exploring key economic drivers, volatility catalysts in gold, oil and stocks, and what the evolving economic outlook means for cfd trading strategies and risk management on global markets.
Author  Rachel Weiss
Yesterday 11: 37
Get a comprehensive financial market 2026 outlook exploring key economic drivers, volatility catalysts in gold, oil and stocks, and what the evolving economic outlook means for cfd trading strategies and risk management on global markets.
Related Instrument
goTop
quote