
Crypto Today: Bitcoin declines amid de-risking sentiment, Ethereum and XRP hold key support
- Bitcoin sweeps through liquidity around $115,000 level, amid profit-taking and risk-off sentiment.
- Ethereum rebounds from range low support above $3,500 amid steady ETF inflow.
- XRP upholds 100-period EMA support on the 4-hour chart, amid a persistent drop in Open Interest and funding rates.
The cryptocurrency market is striving for stability following a bearish wave during the Asian session on Friday, which saw Bitcoin (BTC) price slump to an intraday low of $114,723. A recovery is gaining momentum, with BTC exchanging hands at $115,868 at the time of writing, indicating interest in buying the dip could rise in upcoming sessions.
Leading altcoins such as Ethereum (ETH) and Ripple (XRP) are holding steadily above their respective key support levels. Ethereum bulls have been quick to grab the token near support at $3,500, boosting the price to $3,717 at the time of writing. The cross-border money remittance token, XRP, is trading above support at $3.00 after testing a low of $2.95 on Thursday.
Market overview: Bitcoin retreats amid possible market top and distribution
The Index Bitcoin Cycle Indicators (IBCI) has closed in on the distribution zone, a range known to reflect euphoria and possible market tops, now for the third time during the current BTC bull cycle, according to CryptoQuant.
"However, the index only touched the lower base of this zone, reaching the 80% mark, still a far way from the 100% that signaled major tops in previous BTC cycles," a CryptoQuant analyst highlighted on Thursday.
The IBCI level, as shown in the chart below, suggests that the market is in an expansion phase, but has not yet reached its maximum to indicate the end of the cycle. Moreover, aggressive profit-taking has not begun, hinting at the possibility of the bullish cycle extending.
"The IBCI is being 'held up' by a base of fundamentals that points to an absence of generalized euphoria. This suggests that there is still room for new highs before the market reaches a definitive end-of-cycle top," the analyst added.
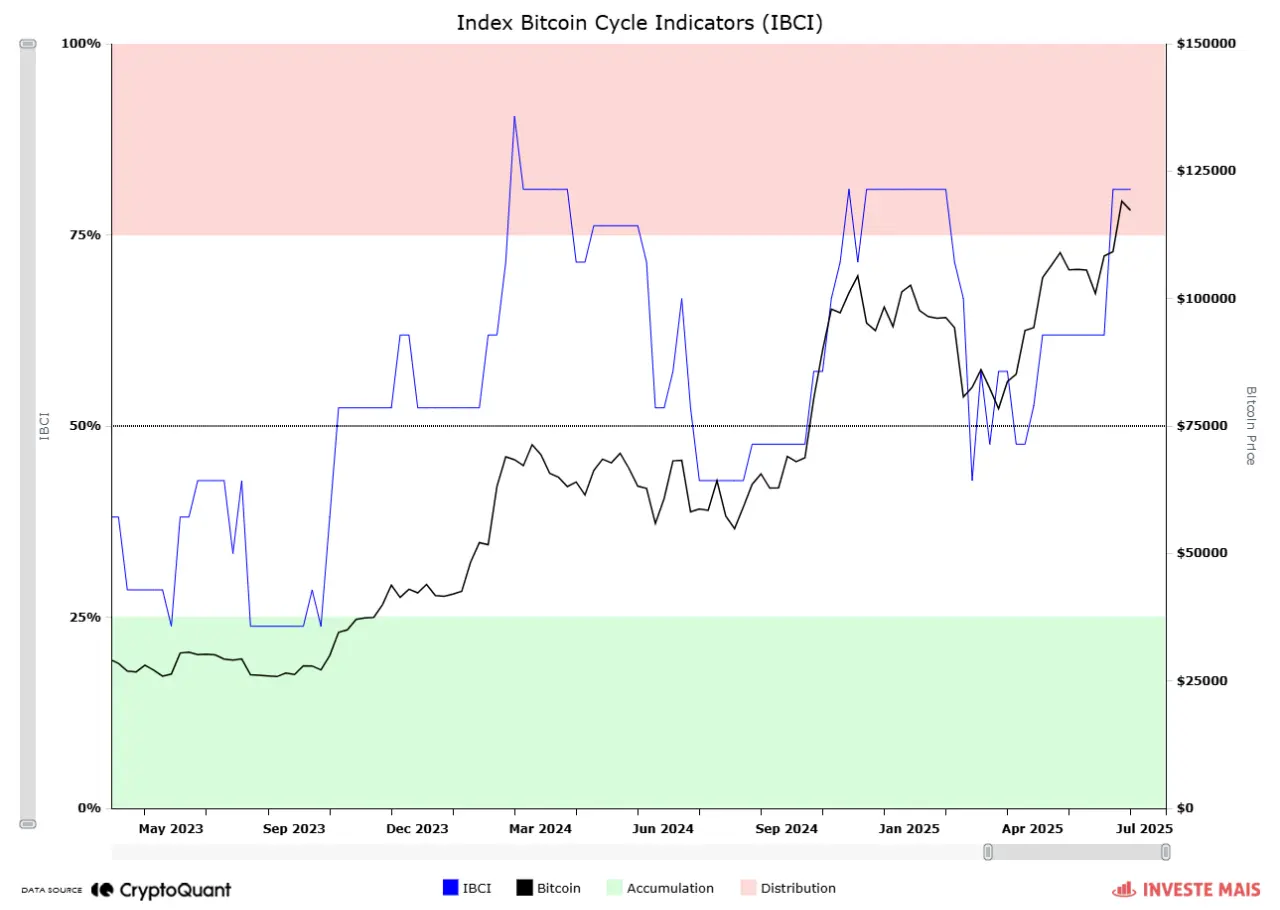
The Index Bitcoin Cycle Indicators | Source: CryptoQuant
A glance at the Altcoin Season Index suggests a pause in the altcoins' rally. CoinGlass data shows the index reversing to 43 after peaking at 59 on Monday, nearly three times the value of 20 on July 1. It is not the altcoin season until the index hits 75, indicating aggressive capital rotation from Bitcoin into other tokens.
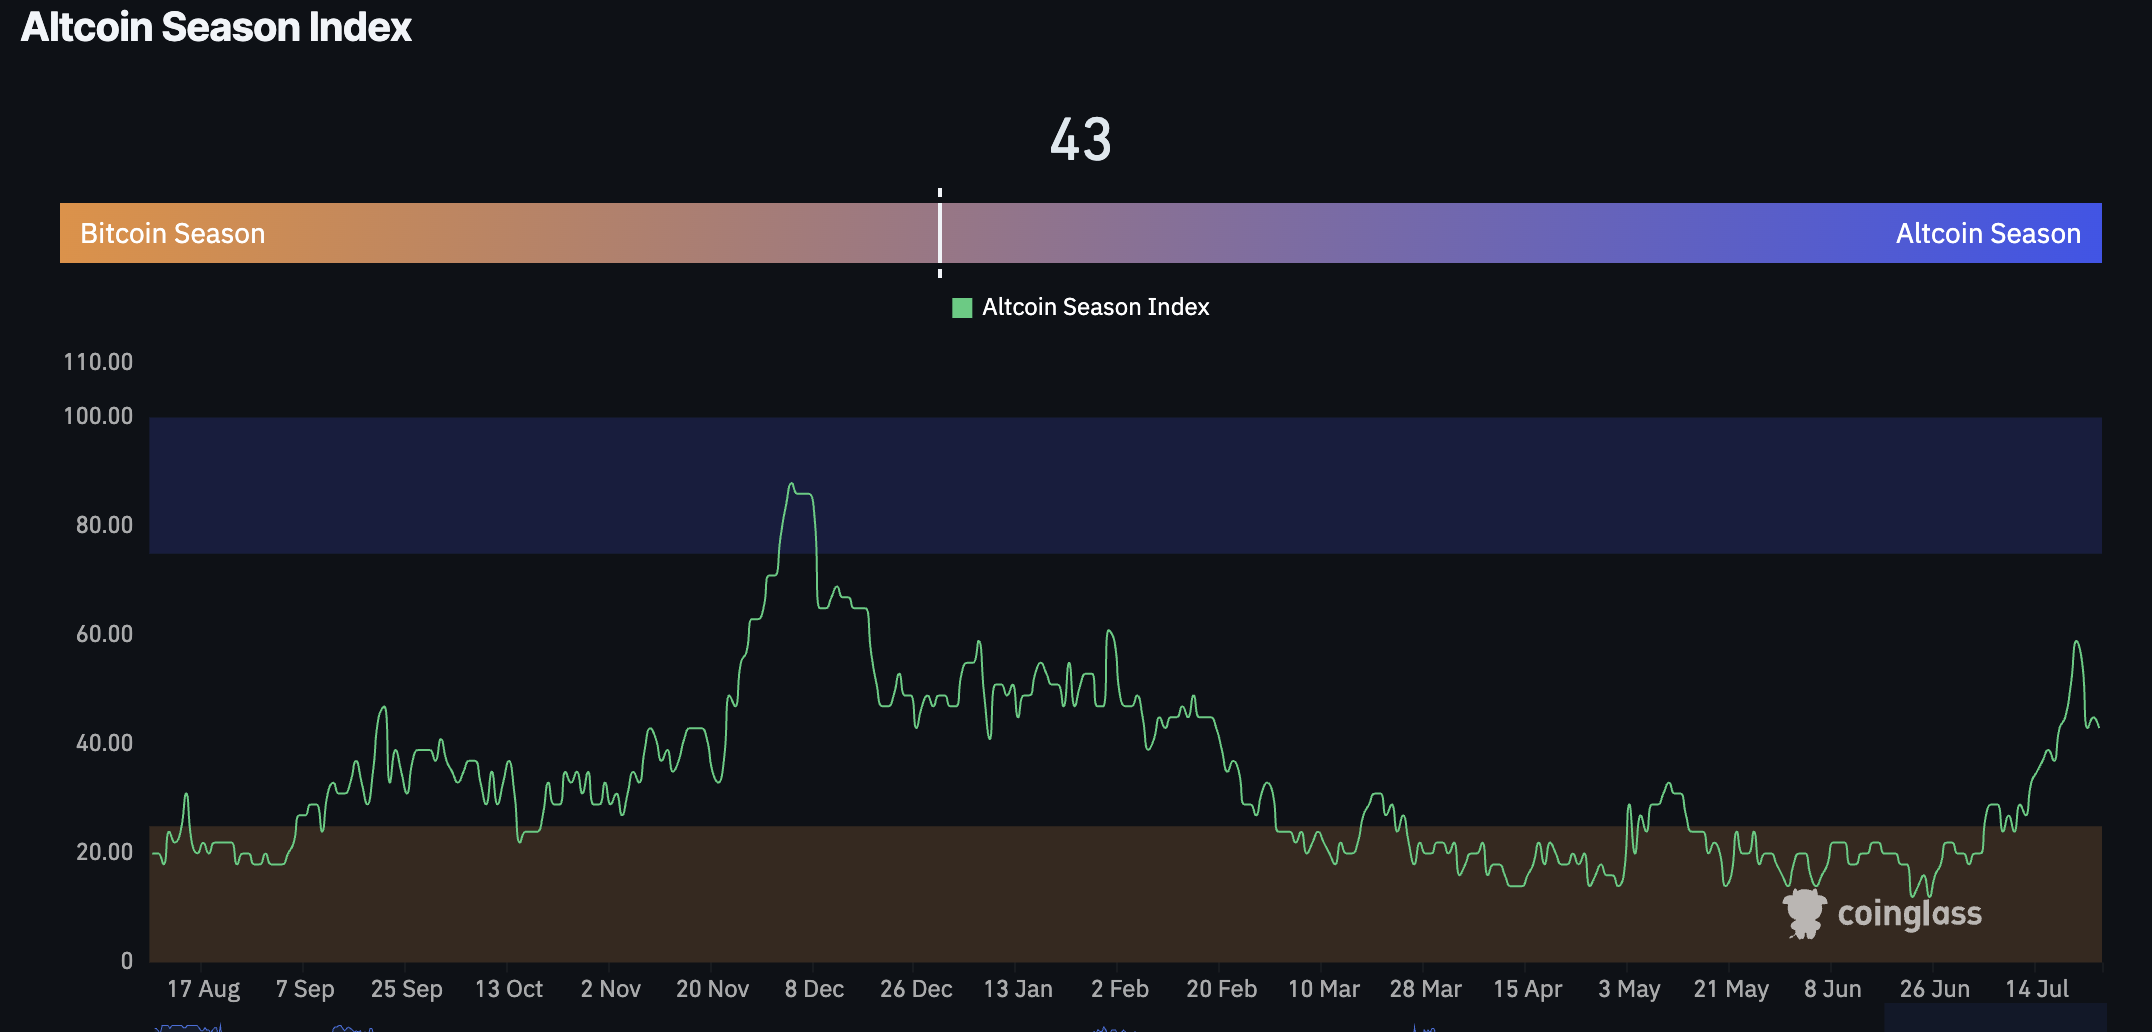
Altcoin Season Index | Source: CoinGlass
Data spotlight: Ethereum ETF inflow steady
Ethereum spot Exchange Traded Funds (ETFs) continue to post steady inflows despite the headwinds in the crypto market. According to SoSoValue, investment products licensed in the United States (US) experienced a daily net inflow of $231 million on Thursday, which fell below Wednesday's capital inflow of $332 million. Currently, the total cumulative net inflow stands at $8.88 billion, with net assets averaging $20.7 billion.
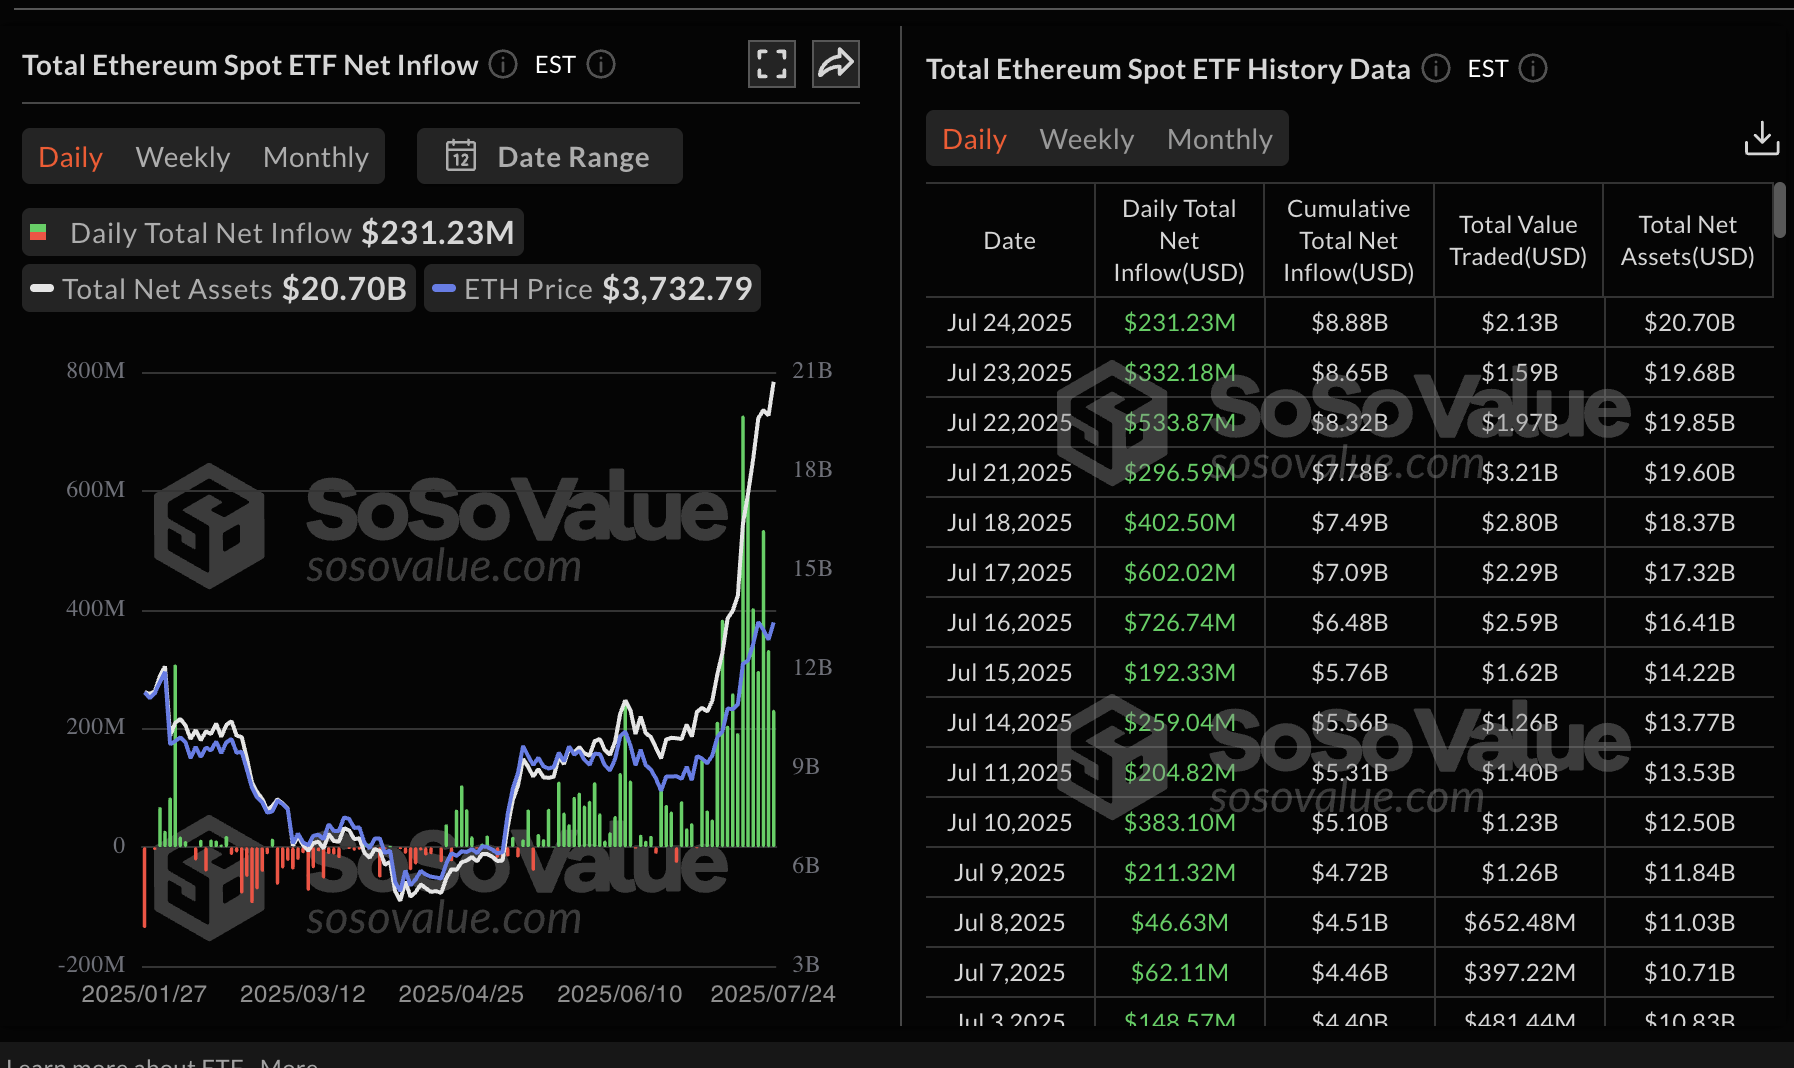
Ethereum spot ETF data | Source | SoSOValue
Bitcoin spot ETFs recorded their first net inflow volume this week, at approximately $227 million on Thursday, signaling an improvement in sentiment. Suppose investors anticipate volatility in the US Dollar (USD) due to the implementation of President Donald Trump's higher tariffs on August 1. In that case, they will likely seek exposure to hedge assets like Bitcoin and Gold, thus keeping prices near the all-time high.
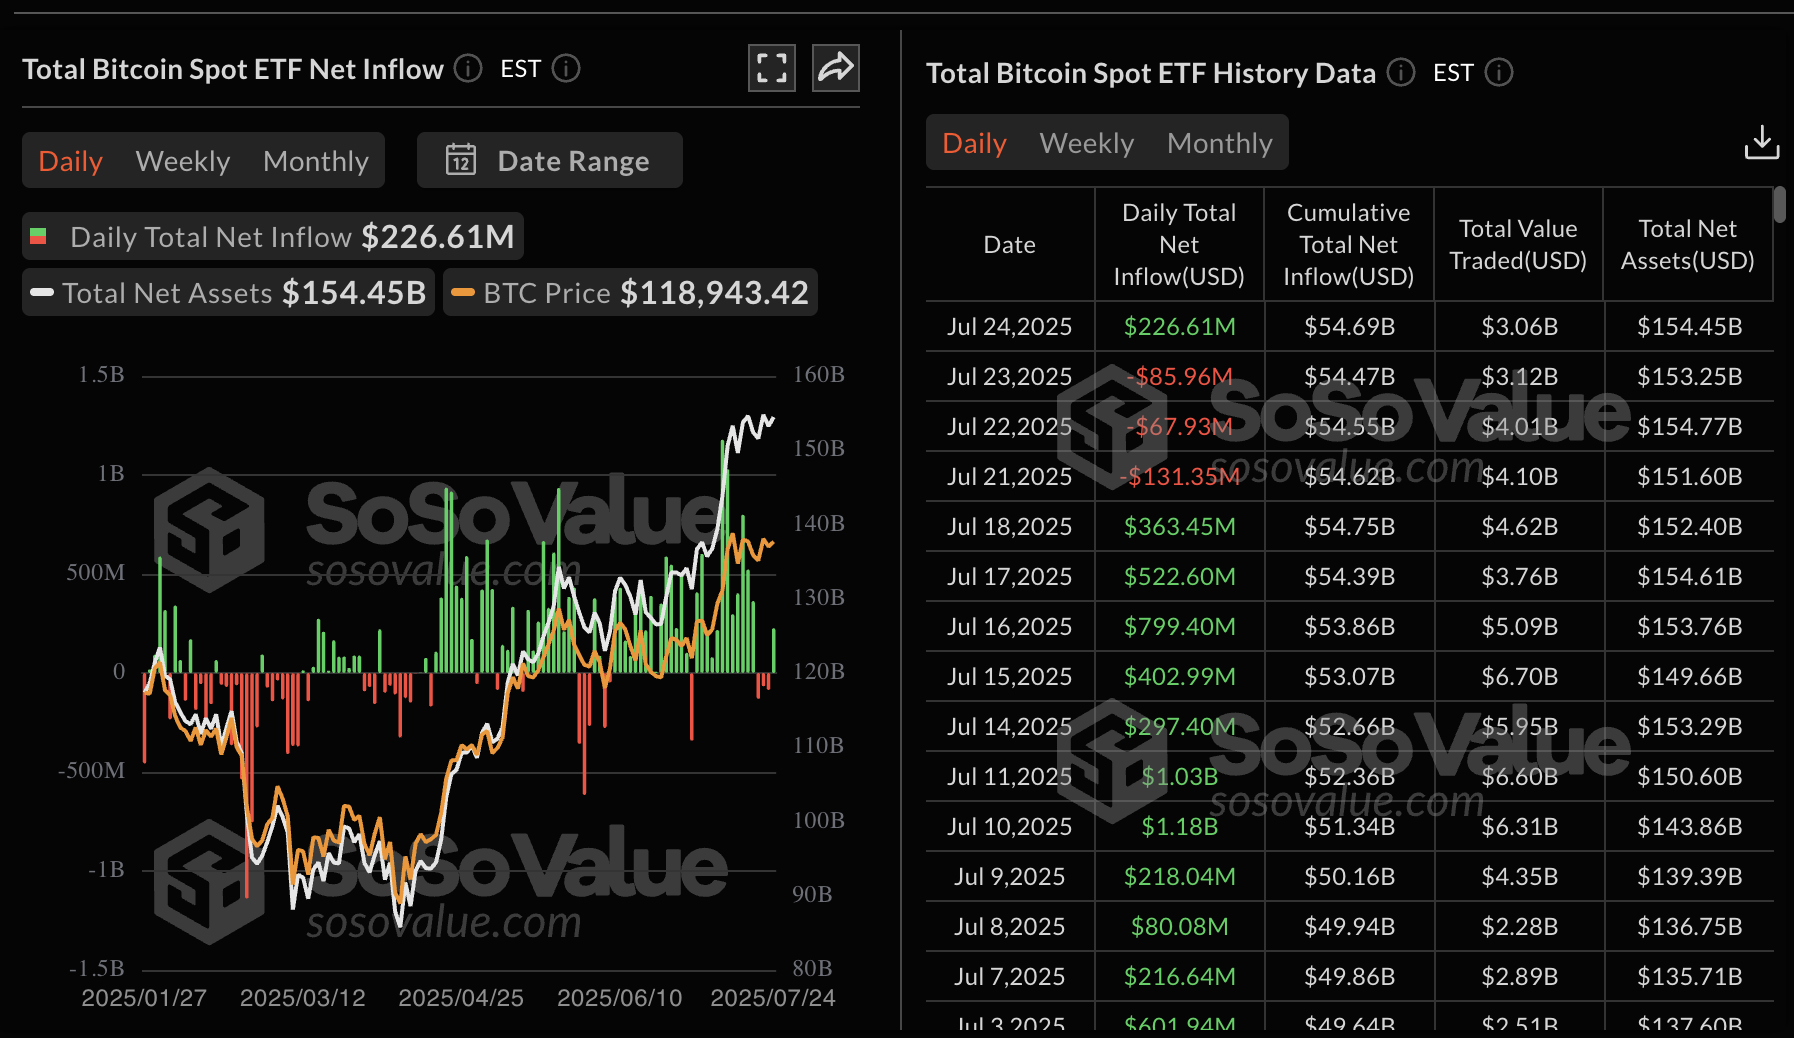
Bitcoin spot ETF data | Source | SoSOValue
As for XRP, interest in the token is dwindling following an impressive run-up to a new record high of $3.66. The Futures Open Interest (OI) chart below, which displays the notional value of futures and options contracts outstanding, shows a sharp correction from a yearly peak of $10.94 billion to $9.1 billion.
If the decline continues, it would indicate that sentiment and interest in XRP are declining, making it difficult for bulls to sustain the anticipated continuation of the uptrend.
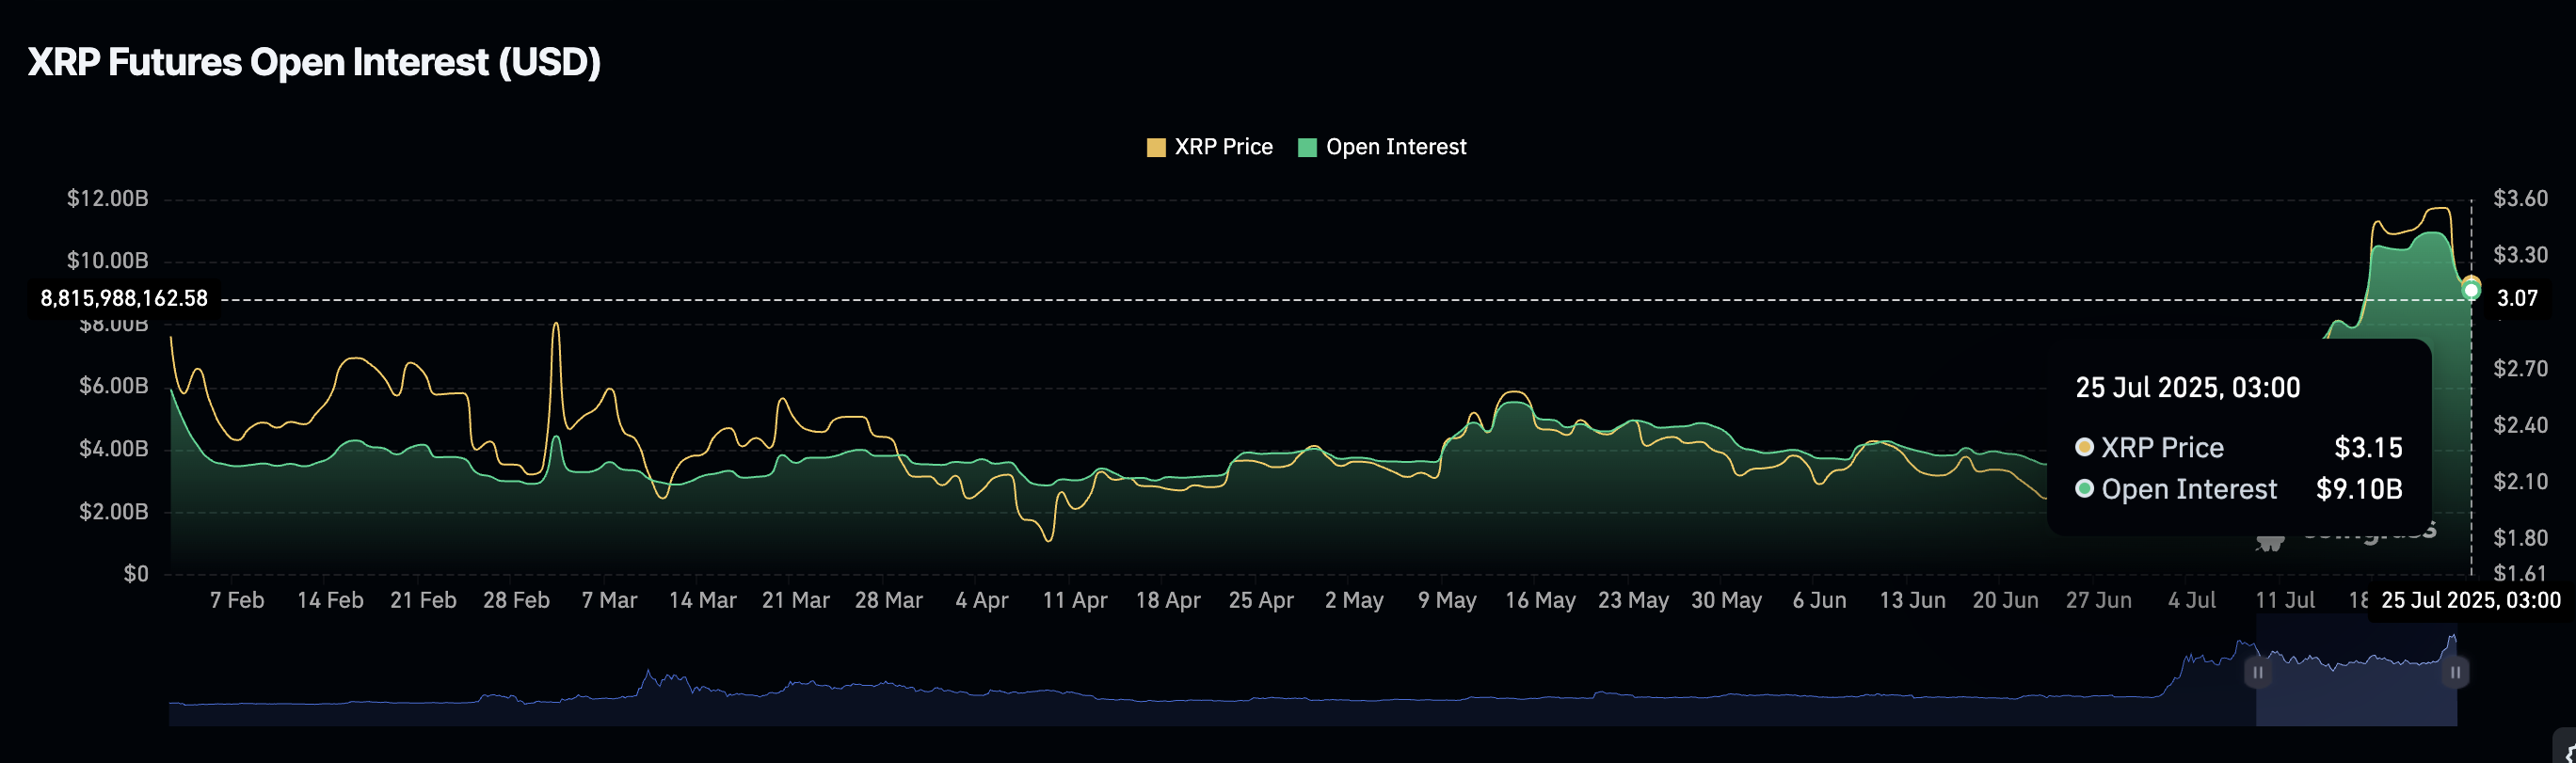
XRP Futures Open Interest | Source: CoinGlass
Chart of the Day: Bitcoin offers bearish signals
Bitcoin price has extended its decline after peaking at $120,090 on Wednesday. A support at $114,728 halted the down leg, paving the way for a minor reversal to $115,868 at the time of writing.
Despite the reversal, the short-term outlook remains bearish, backed by a sell signal from the Moving Average Convergence Divergence (MACD) indicator, which has been maintained since Thursday on the 4-hour chart.
If demand increases as investors buy the dip, the MACD indicator may recover toward the zero line, confirming a buy signal with the blue line crossing above the red signal line.
Key areas of interest to traders would be the 100-period Exponential Moving Average (EMA) at $116,461 and the 50-period EMA at $117,843. The 200-period EMA at $113,520 is in line to provide support if the decline resumes.
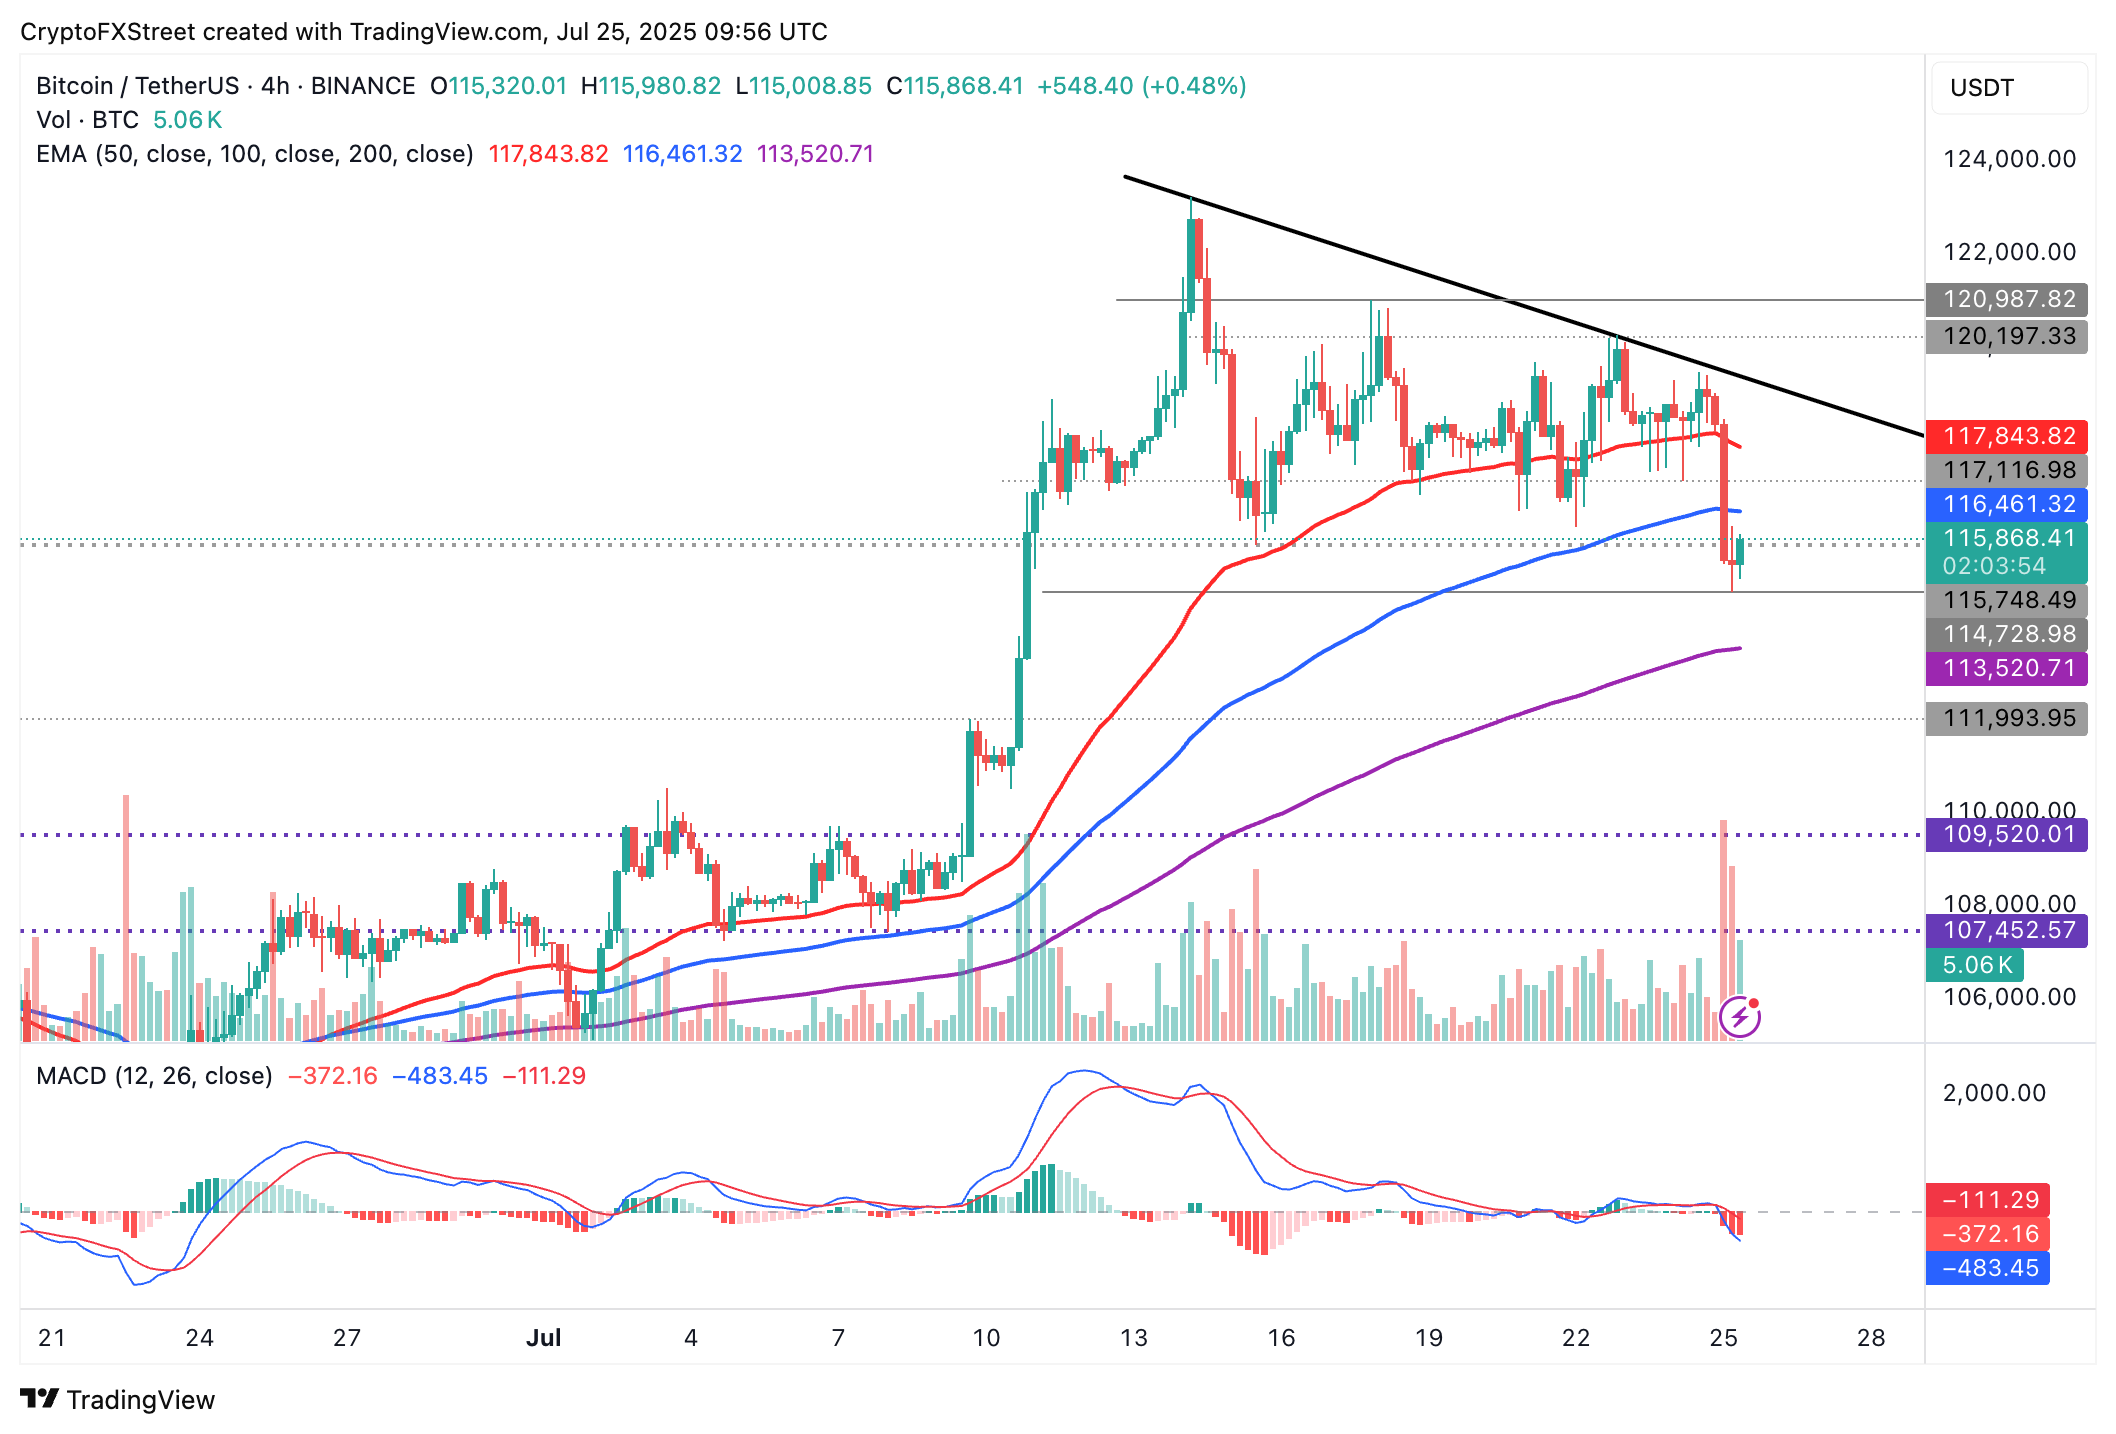
BTC/USDT 4-hour chart
Altcoins update: Ethereum approaches breakout
Ethereum price is getting closer to another breakout after rebounding from support near $3,500. The 4-hour chart below shows ETH price testing the trendline resistance, which, if broken, could encourage risk-on sentiment and boost the uptrend toward the $4,000 milestone.
In the event of a reversal, the 50-period EMA at $3,575 will serve as the first key support. However, if the decline extends, the 100-period EMA at $3,351 and the 200-period EMA at $3,065 will come into play to absorb the selling pressure.
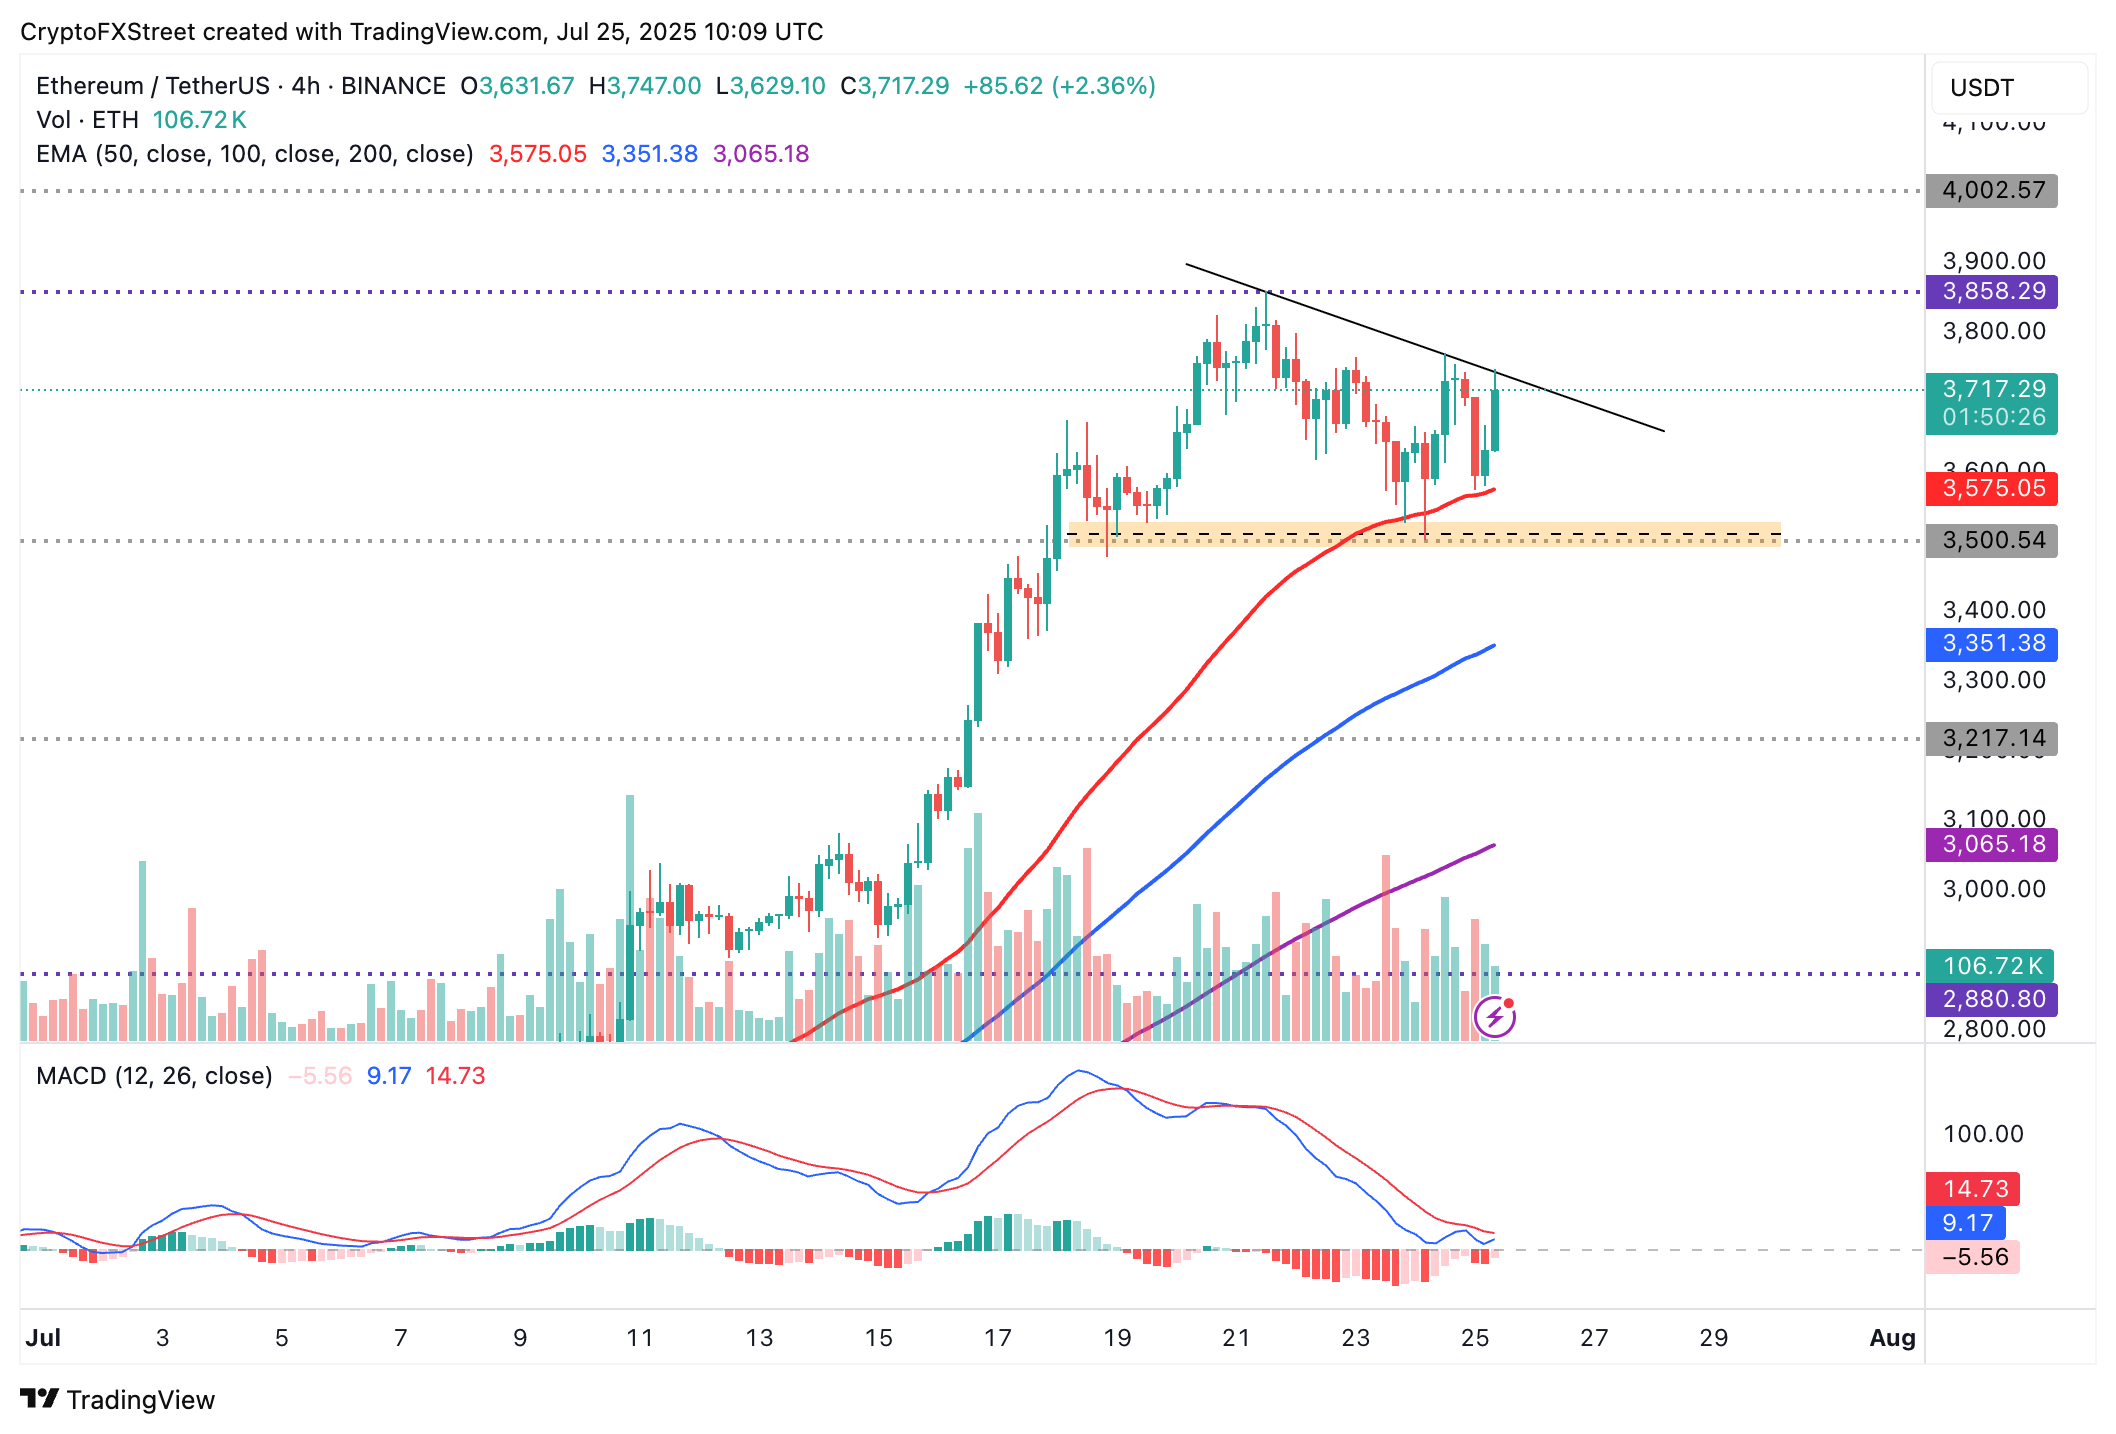
ETH/USDT 4-hour chart
As for XRP, a recovery is underway above the support level at $3.07, provided by the 100-period EMA on the 4-hour chart. A steady upward trend in the price could result in a buy signal from the MACD indicator, prompting traders to seek exposure. Hence, there's a need for traders to watch out for the blue MACD line crossing above the red signal line.
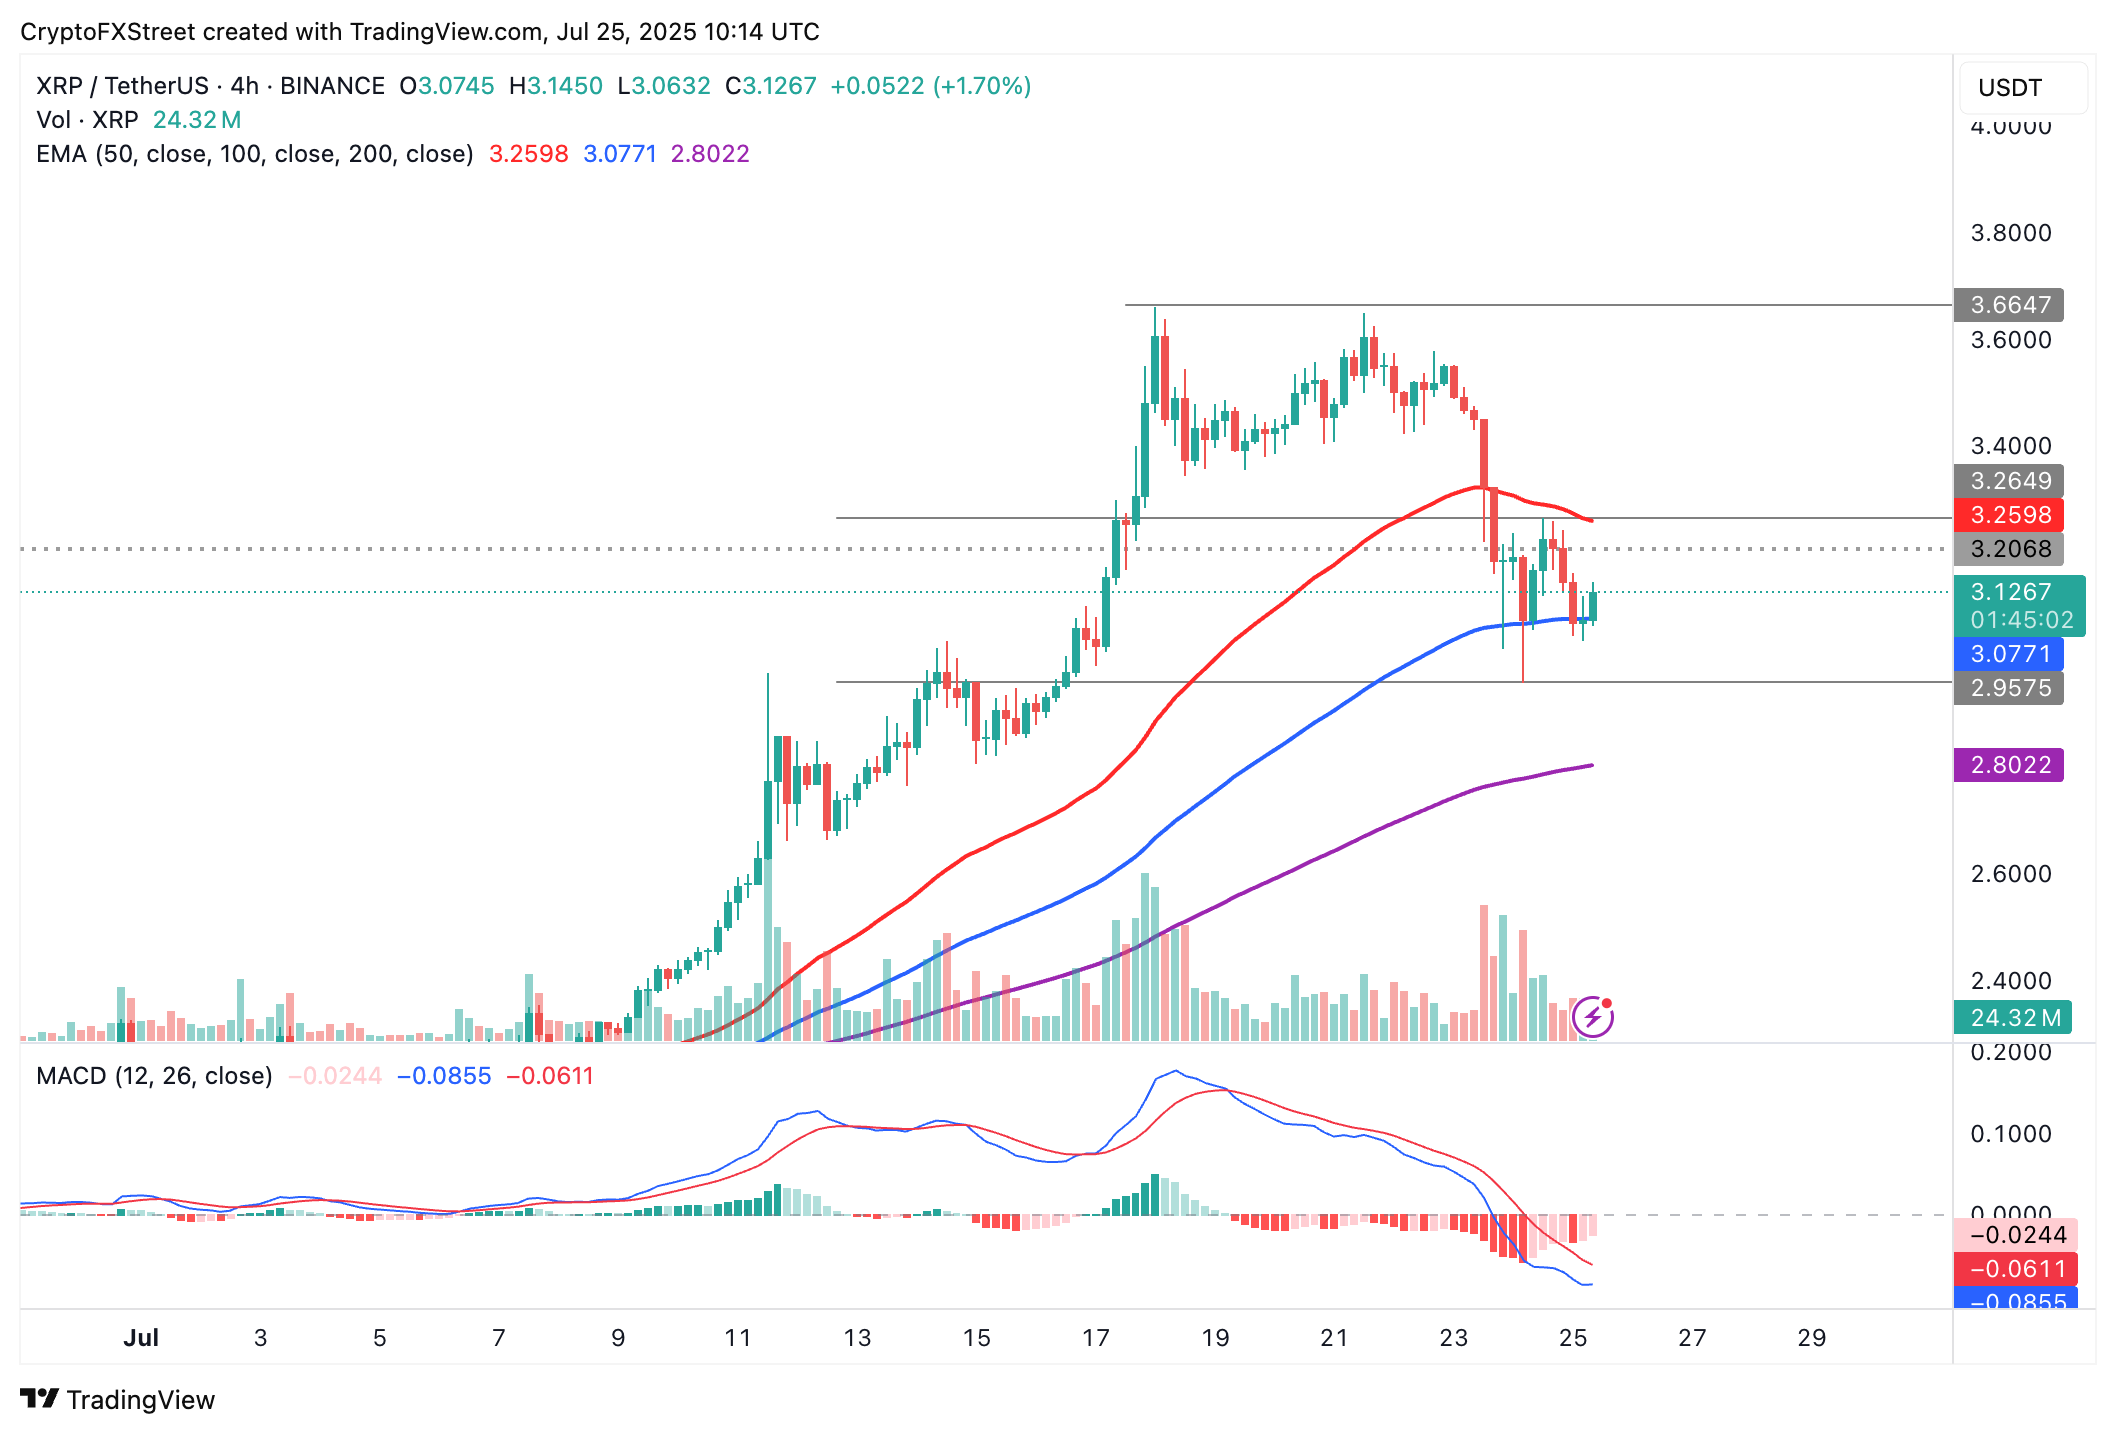
XRP/USDT 4-hour chart
Despite an improving short-term technical picture, XRP fundamentals show weakness, particularly in the futures Open Interest and funding rates, which have retreated over the last few days. That said, it could be premature to rule out a correction below the $3.07 support, which could expand the bearish scope to the 200-period EMA at $2.80, tested on July 15.
Cryptocurrency metrics FAQs
The developer or creator of each cryptocurrency decides on the total number of tokens that can be minted or issued. Only a certain number of these assets can be minted by mining, staking or other mechanisms. This is defined by the algorithm of the underlying blockchain technology. On the other hand, circulating supply can also be decreased via actions such as burning tokens, or mistakenly sending assets to addresses of other incompatible blockchains.
Market capitalization is the result of multiplying the circulating supply of a certain asset by the asset’s current market value.
Trading volume refers to the total number of tokens for a specific asset that has been transacted or exchanged between buyers and sellers within set trading hours, for example, 24 hours. It is used to gauge market sentiment, this metric combines all volumes on centralized exchanges and decentralized exchanges. Increasing trading volume often denotes the demand for a certain asset as more people are buying and selling the cryptocurrency.
Funding rates are a concept designed to encourage traders to take positions and ensure perpetual contract prices match spot markets. It defines a mechanism by exchanges to ensure that future prices and index prices periodic payments regularly converge. When the funding rate is positive, the price of the perpetual contract is higher than the mark price. This means traders who are bullish and have opened long positions pay traders who are in short positions. On the other hand, a negative funding rate means perpetual prices are below the mark price, and hence traders with short positions pay traders who have opened long positions.
Recommended Articles


