
Another 40% Crash for Hedera? History Says It’s Possible
HBAR’s price rally might be losing steam. Despite a strong monthly gain of 58.77%, HBAR has erased all its weekly profits and is down over 8% in the past 24 hours.
While this might seem like a standard cooldown, a closer look at past price behavior, short-term chart signals, and key support zones suggests deeper pain could be in store.
Historical Drawdowns Hint at a Familiar Profit-Taking Zone
Why look at drawdowns now? Because Hedera has entered a zone where profit-booking historically begins. In March 2025, when HBAR had rallied to $0.26, the drawdown from its all-time high was around 53.74%. That’s exactly when a 47% crash followed, dragging the token down to $0.14 in just a month.
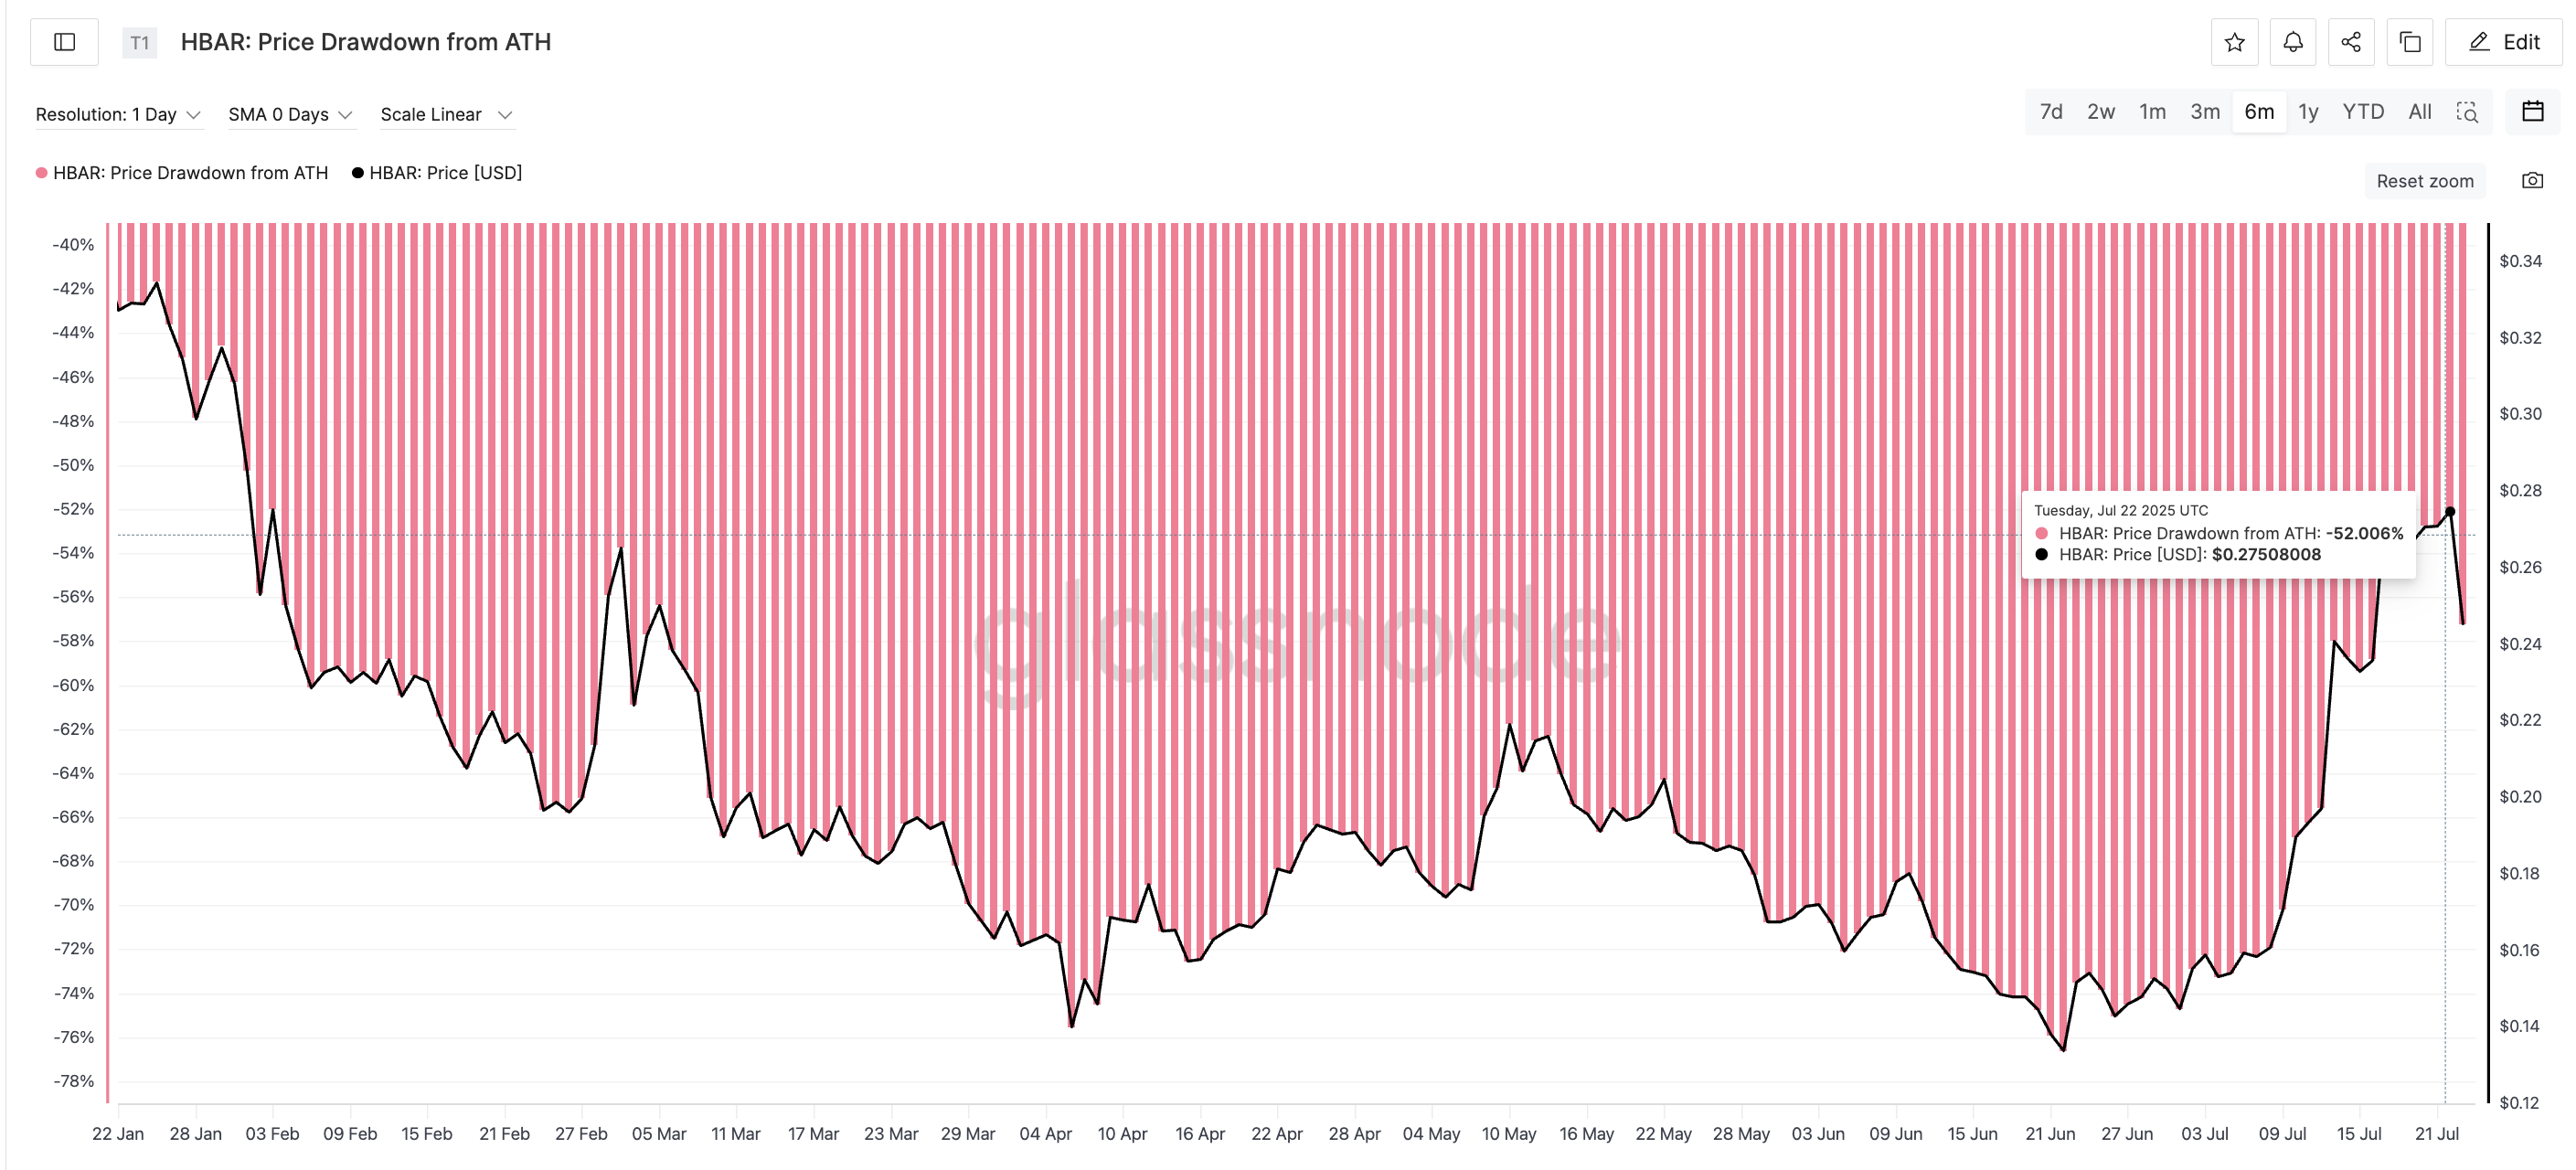 HBAR price ATH drawdown, and correction history: Glassnode
Fast forward to July 22, and the drawdown stood at 52%, with HBAR trading near $0.27. Since then, the correction has already begun; a sign that traders may again be taking profits in this 50–60% drawdown zone.
Even if this plays out like March but with a lighter touch (courtesy of the altcoin season narrative), a 40% drop from $0.27 puts the HBAR price around $0.16. Interestingly, this lines up with a key support level. More on this later in the analysis!
In short, historical drawdown zones are where traders have typically hit the brakes. And that pattern looks to be repeating.
ATH drawdown measures how far a token’s price has fallen from its all-time high. It helps identify common zones where traders lock in profits.
Death Cross on the 4-Hour Chart May Accelerate the HBAR Price Drop
Zooming into the 4-hour chart reveals another bearish warning. The 20-period EMA (exponential moving average) or the red line is closing in on the 50-period EMA (orange line), a classic bearish crossover known as a “death cross.” While it hasn’t triggered yet, the setup is almost complete.
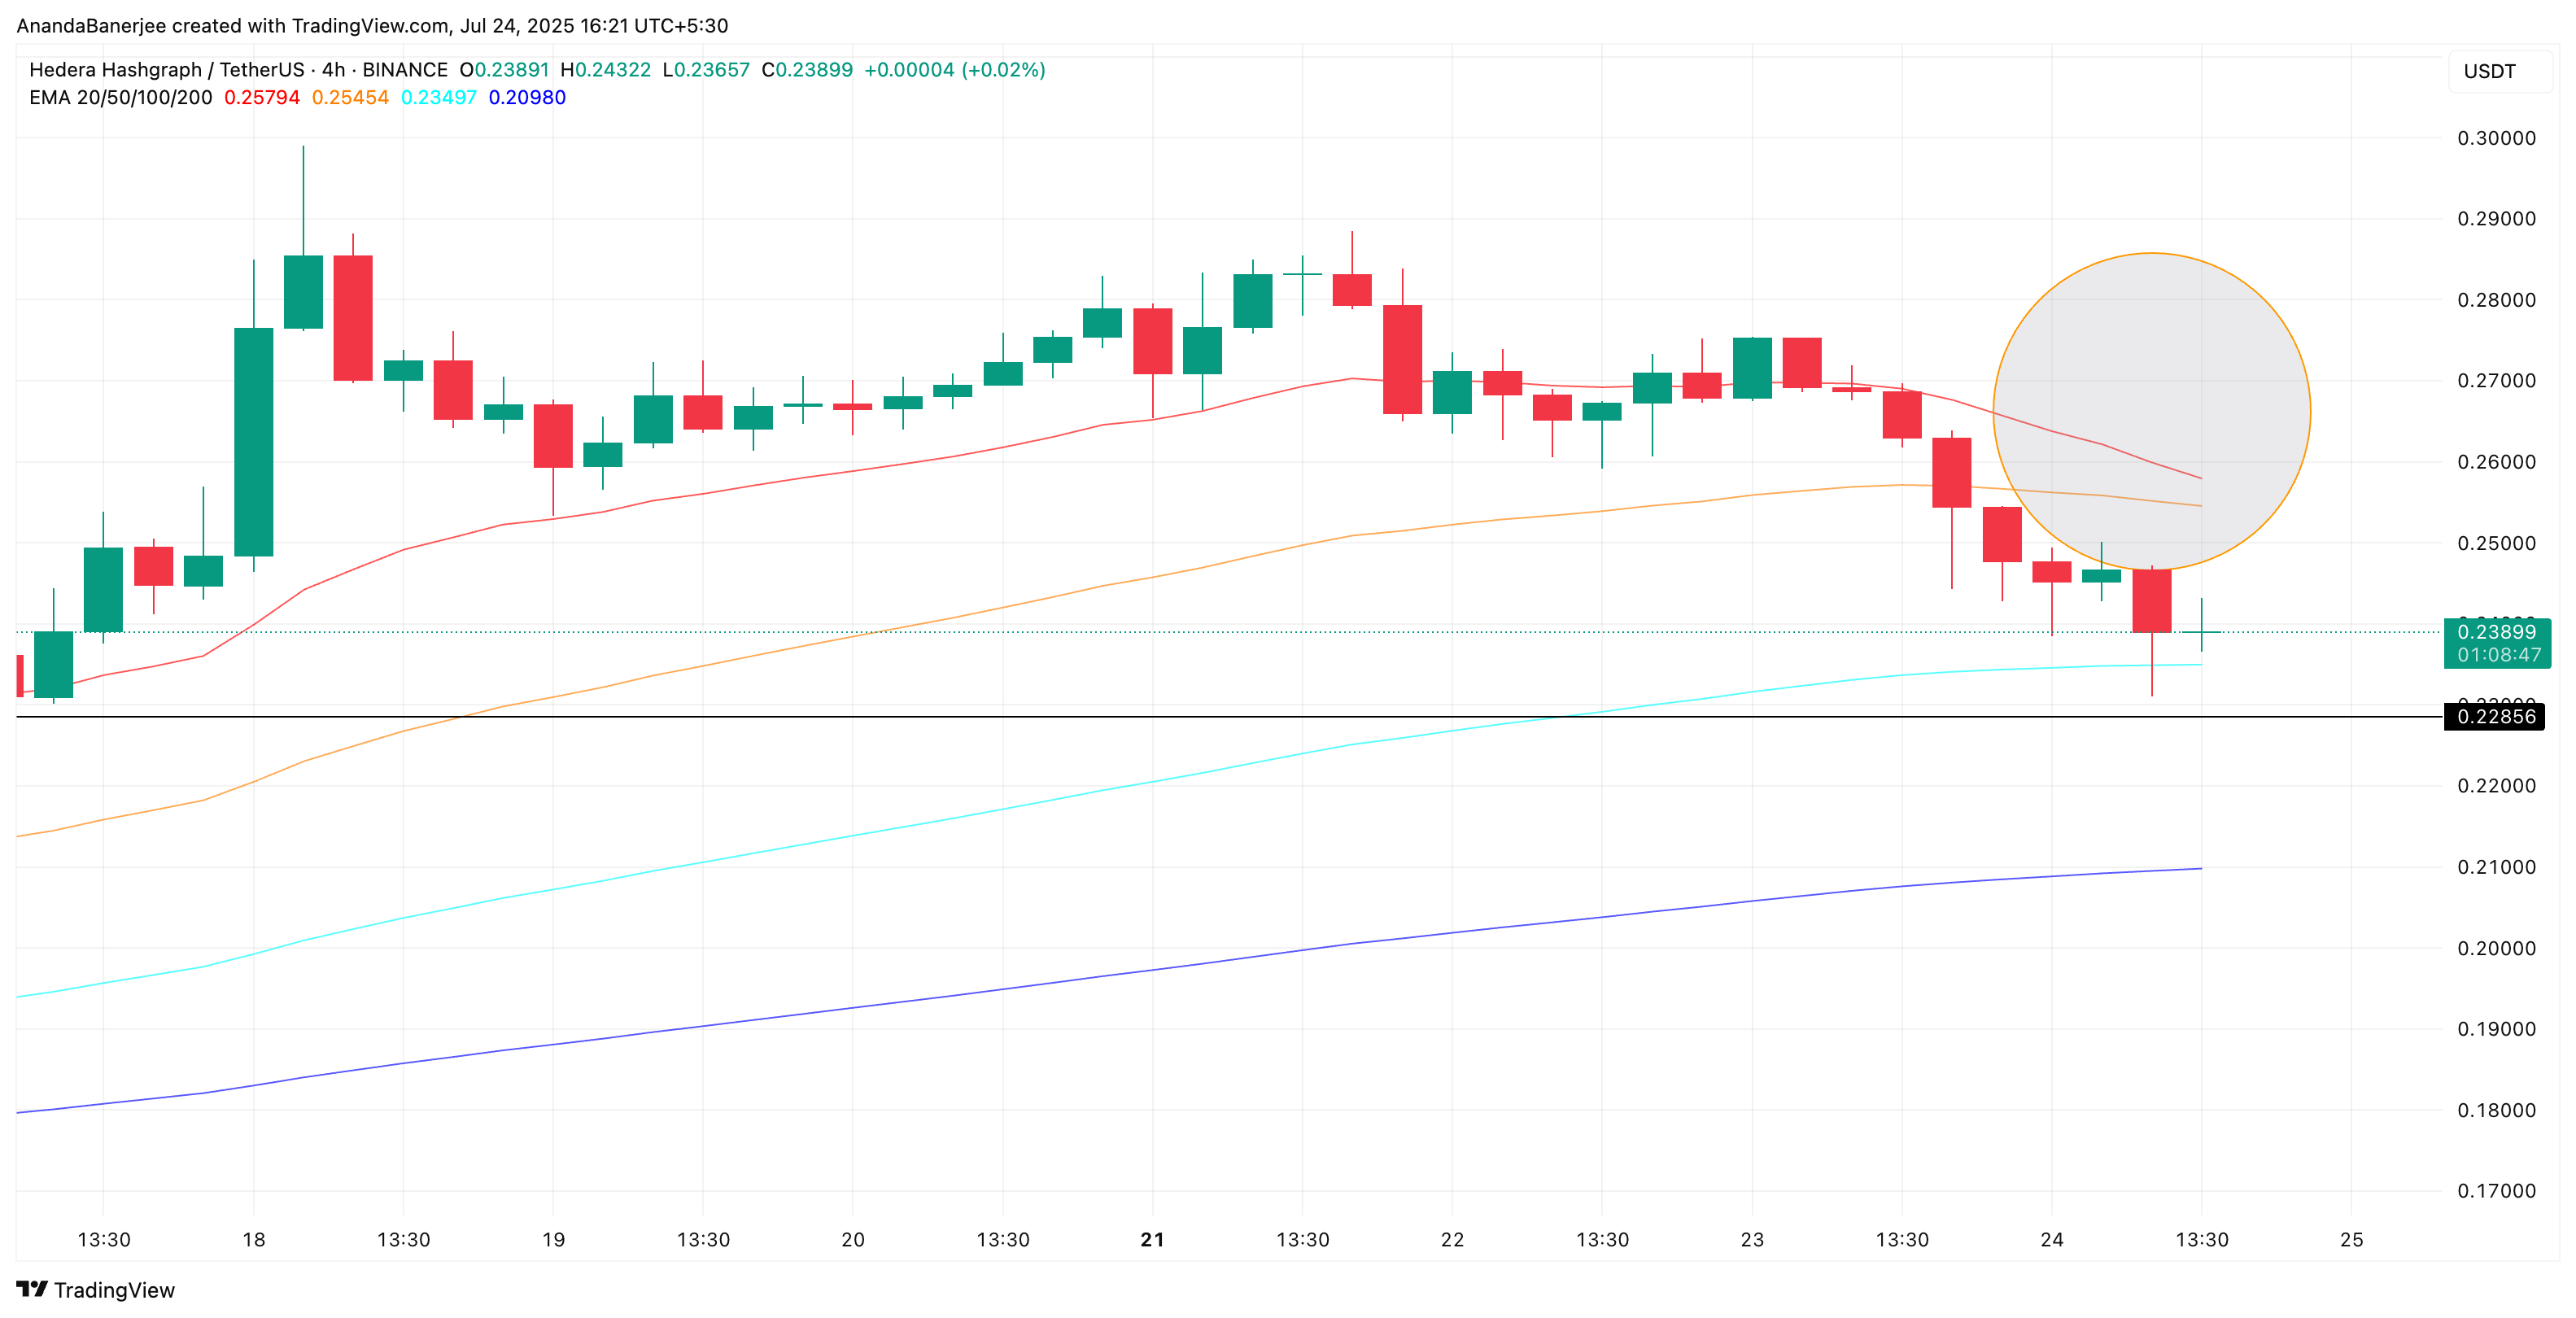 HBAR price and EMA crossover: TradingView
We use the 4-hour chart here because it often picks up trend shifts before the daily timeframe does. This early signal suggests that momentum is shifting in favor of the bears.
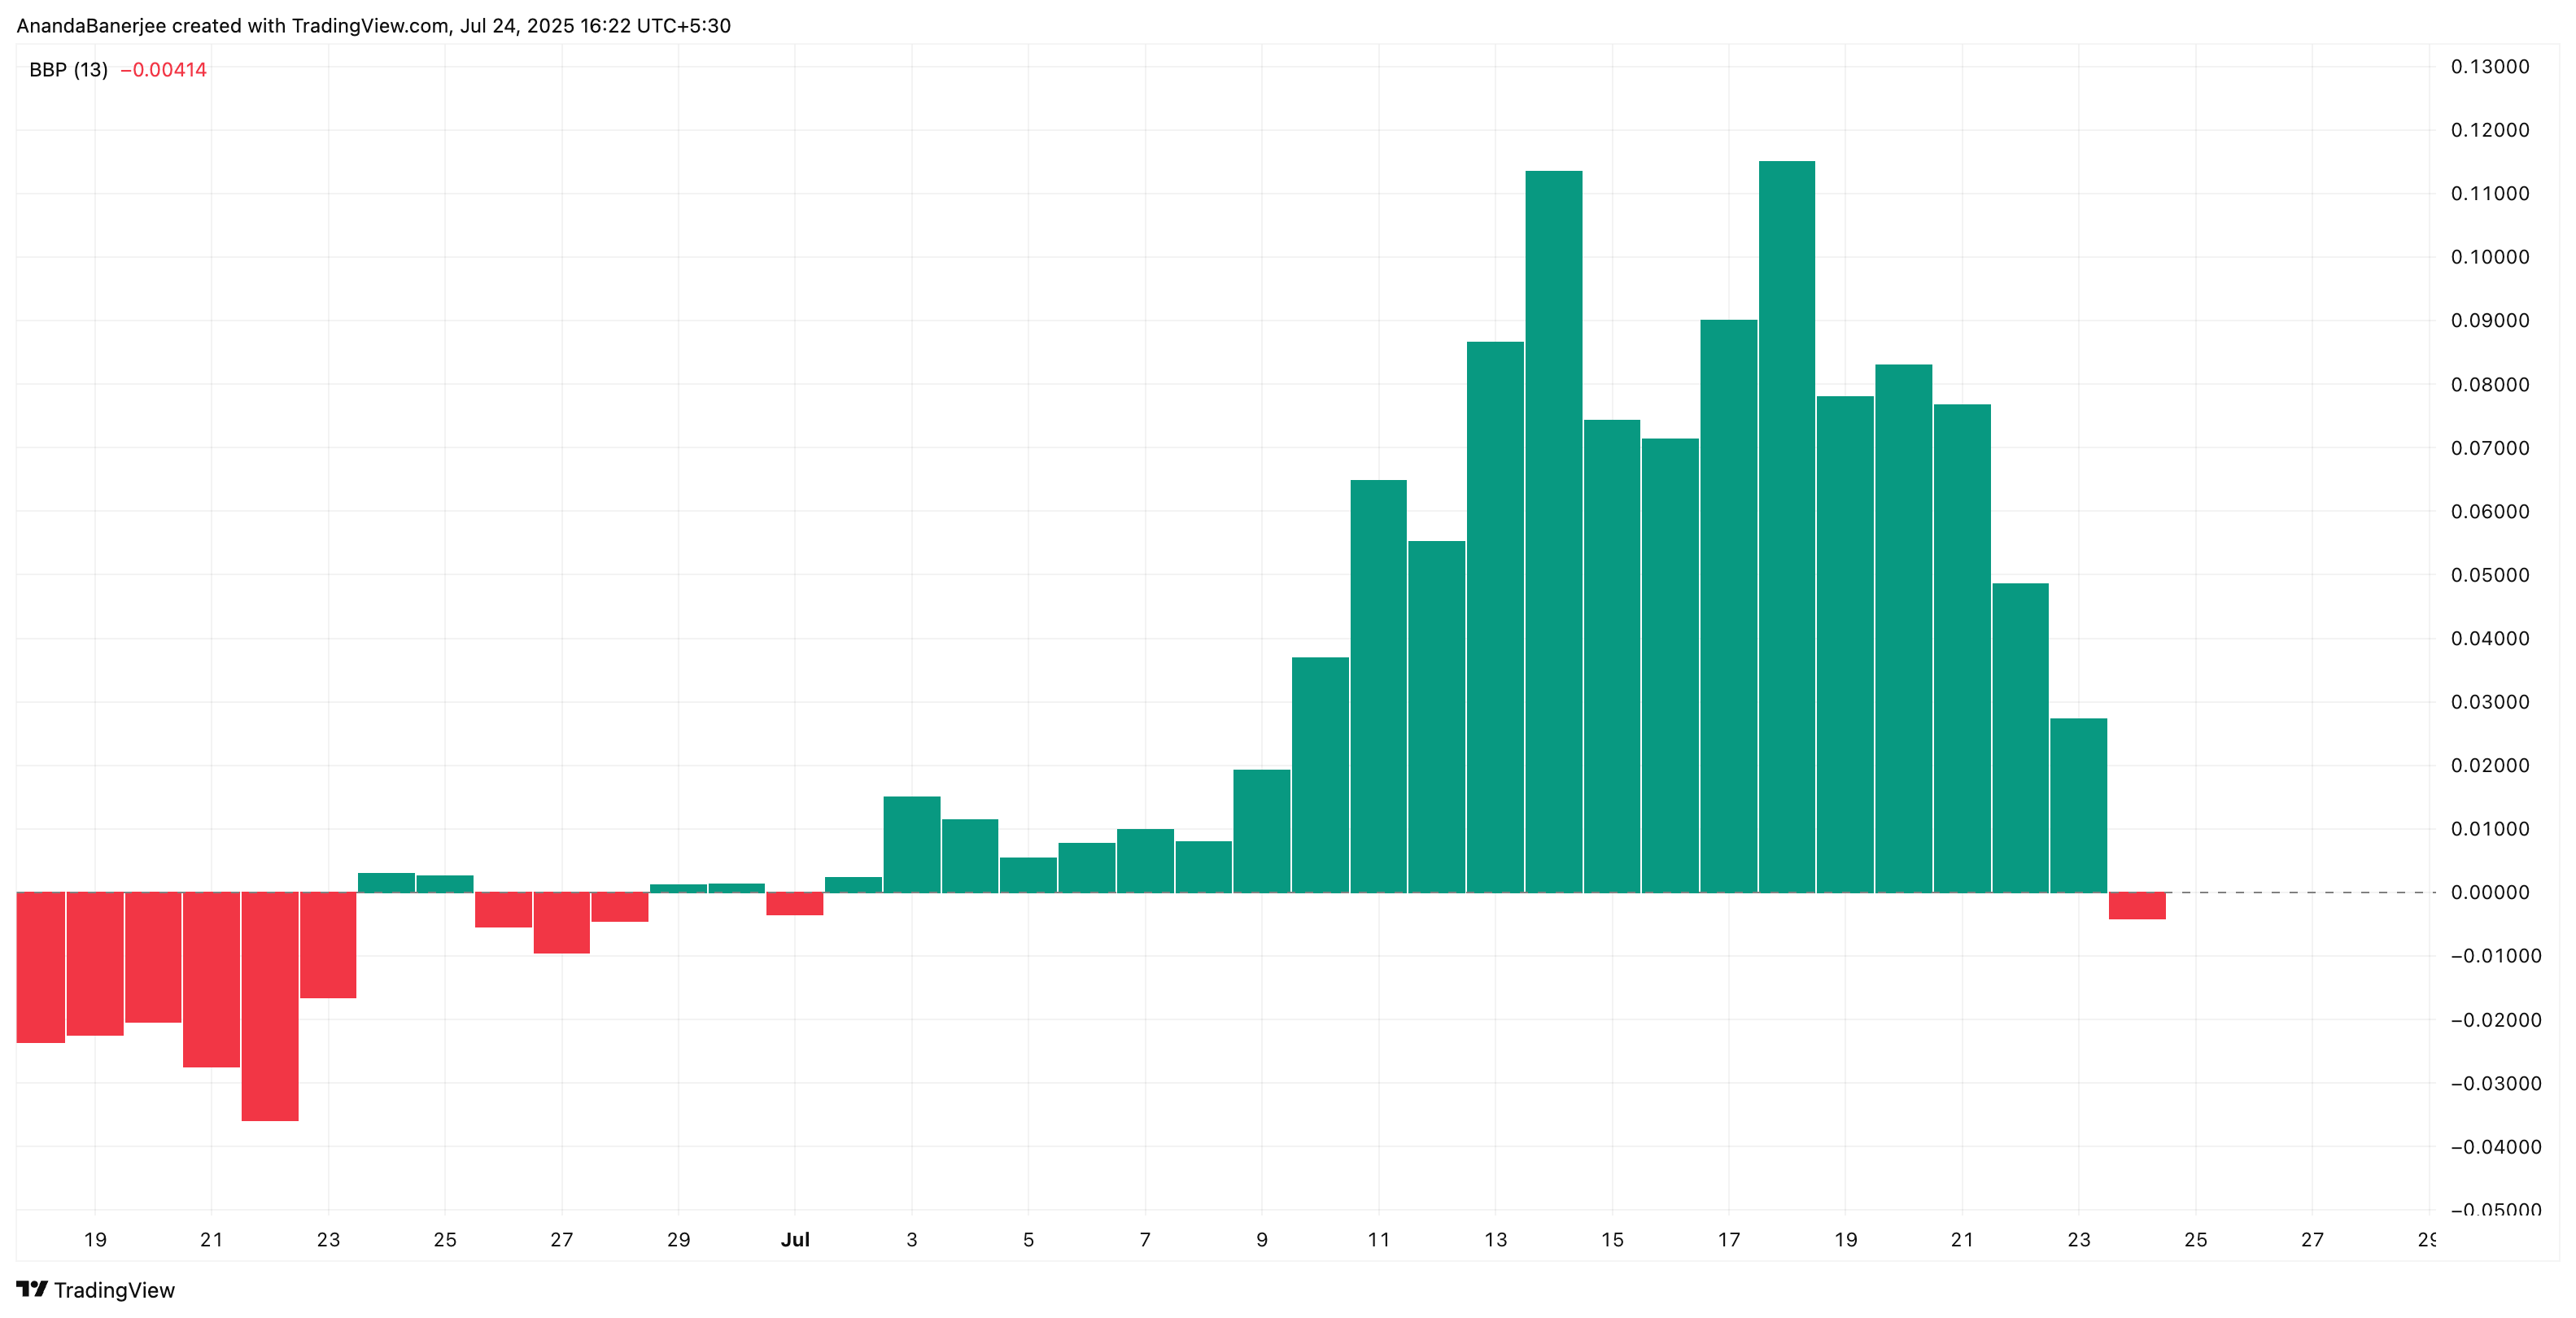 HBAR Bull Bear power indicator: TradingView
Supporting this view is the Bull Bear Power Index, which just flipped negative. Sellers are gaining ground; a signal that the drop could accelerate if bulls fail to step in. If the crossover confirms, led by bears taking control, expect momentum-driven selling to push prices lower, especially with history already setting the stage.
Bull Bear Power measures the strength of buyers vs. sellers. When it turns negative (red), it means bears have taken control.
For token TA and market updates: Want more token insights like this? Sign up for Editor Harsh Notariya’s Daily Crypto Newsletter here.
Critical HBAR Price Support Lies At $0.21
The HBAR price is currently trading around $0.23, teetering just above the 0.382 Fibonacci retracement level also at $0.23. This line was drawn from the recent low of $0.12 to the high of $0.29.
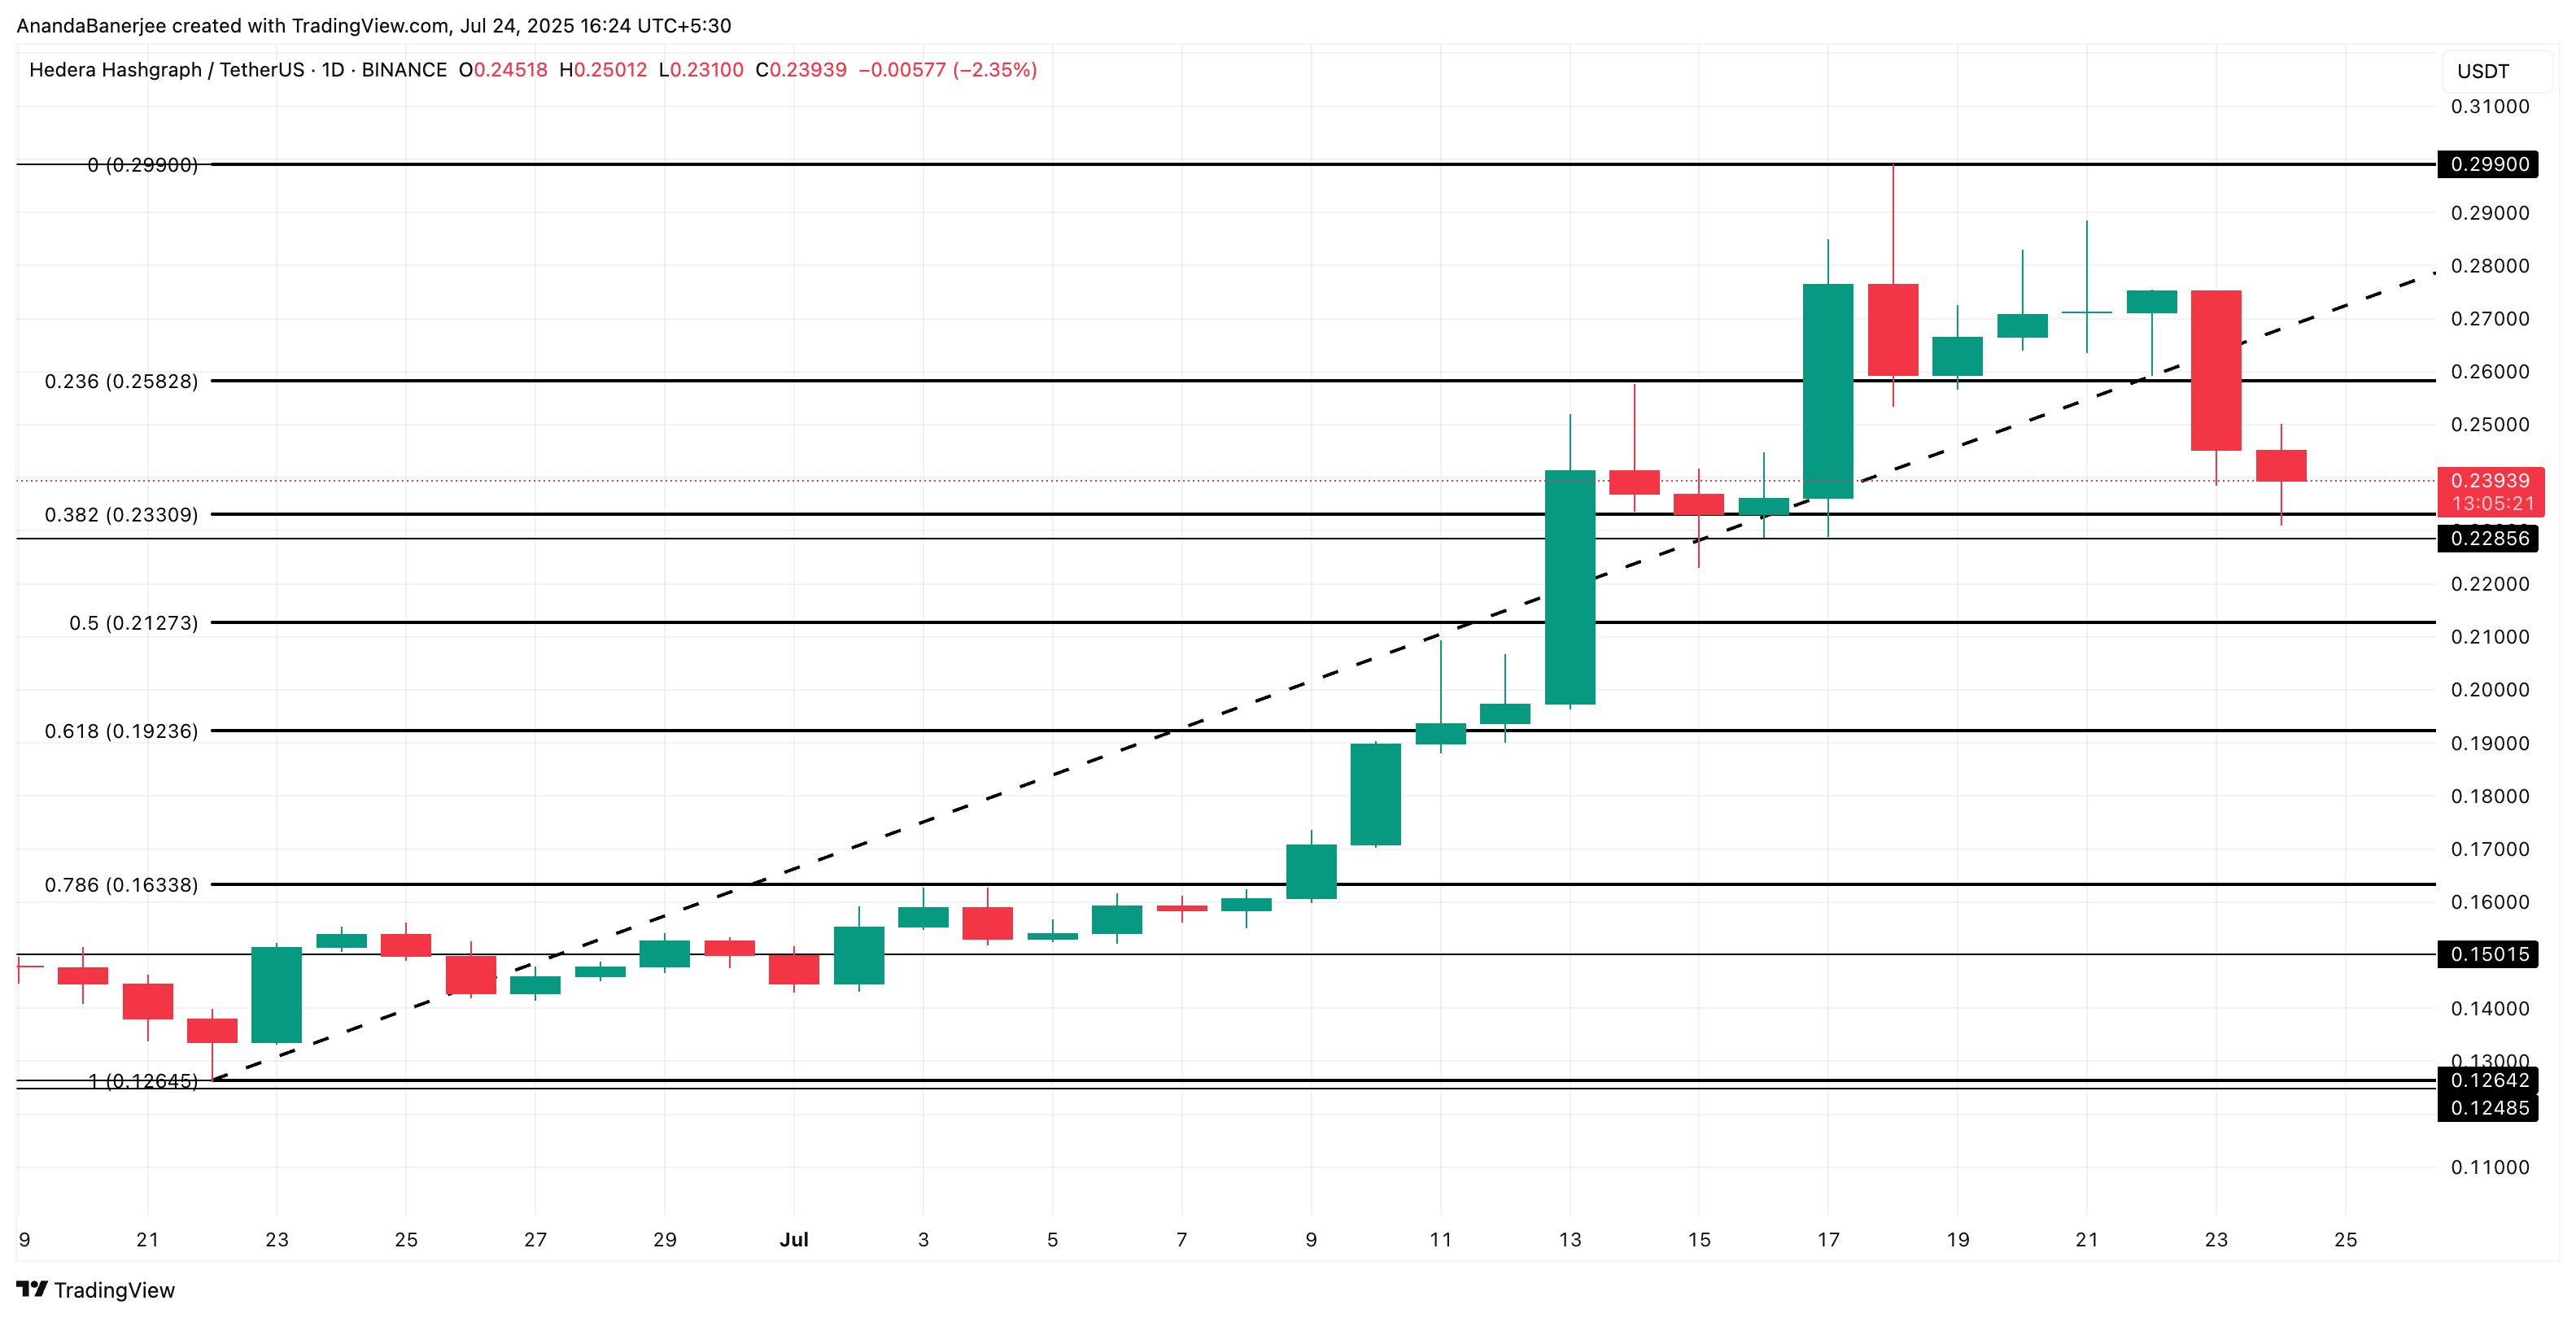 HBAR price analysis: TradingView
If $0.23 breaks, which seems increasingly likely, the next support lies at $0.212 (Fib 0.5 level). Beyond that, $0.19 and $0.16 become critical levels to watch; the latter being a 40% drop from the recent peak.
However, if HBAR manages to reclaim the $0.25 support (now turned resistance) and the death crossover doesn’t happen, the bearish hypothesis might get invalidated.
Recommended Articles


