

Pyth Network could extend losses targeting $0.1 ahead of mega $298 million token unlock
- Pyth Network sends multiple sell signals, triggering double-digit losses.
- Headwinds could accelerate declines amid a colossal $298 million token unlock, approximately 59% of the market capitalisation.
- Open interest rose 9%, while trading volume surged 75% to $82 million, signaling increased interest as PYTH slides.
Pyth Network's (PYTH) price steep decline to $0.135, down over 13% on Monday, mirrors volatile swings in the broader cryptocurrency market. The first-party oracle token, known for real-time market data to financial decentralized applications (dApps), flaunts a weakening technical structure amid mixed sentiment ahead of a gigantic token unlock event expected on Tuesday.
Pyth Network faces potential supply shock
Like many altcoins, Pyth Network's tokenomics provide for staggered token unlocks, with the upcoming event likely to trigger immense volatility. According to CryptoRank data, the unlock on Tuesday will release approximately 2.13 billion PYTH tokens, representing 58.7% of the current market cap of roughly $508 million. This is equal to approximately $298 million in value.
Currently, 3.62 billion PYTH, approximately 36.2% of the total supply of 10 billion, is in circulation. The token unlock event will increase the circulating supply to 6.38 billion PYTH, representing 63.8% of the total supply.
The release of billions of tokens, more than half of the market capitalization, could result in a significant supply shock. If the beneficiaries of the unlocked tokens sell on the open market, sell-side pressure could surge, leading to extended losses, given that PYTH is already down over 11% on the day.
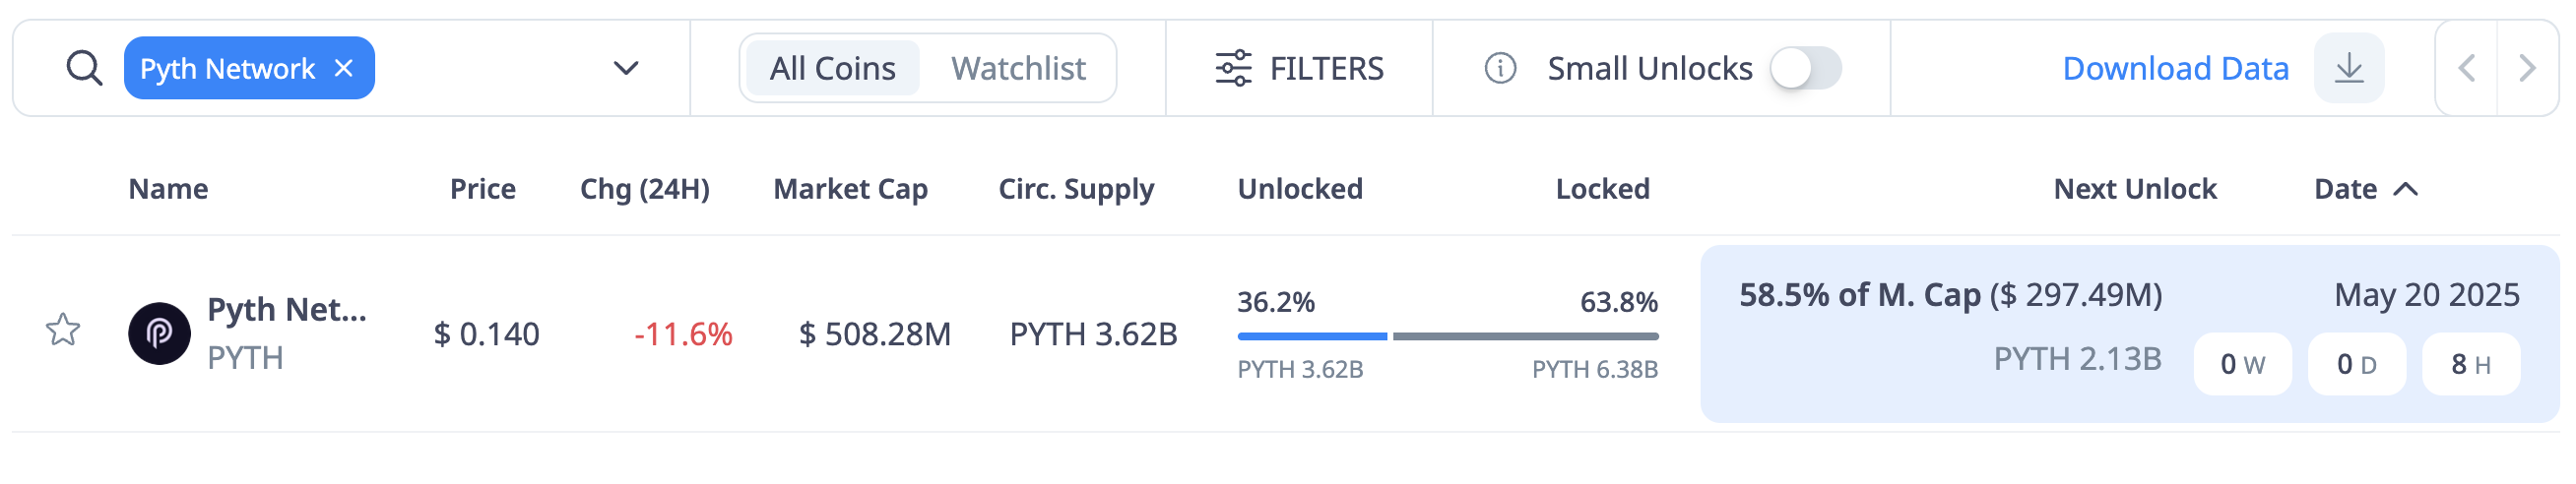
Pyth Network token unlock data | Source: CryptoRank
However, interest in PYTH is rising, with the Open Interest (OI) increasing 9.11% to approximately $46 million. CoinGlass data shows a subsequent surge in the trading volume by 75% to roughly $82 million in the last 24 hours.
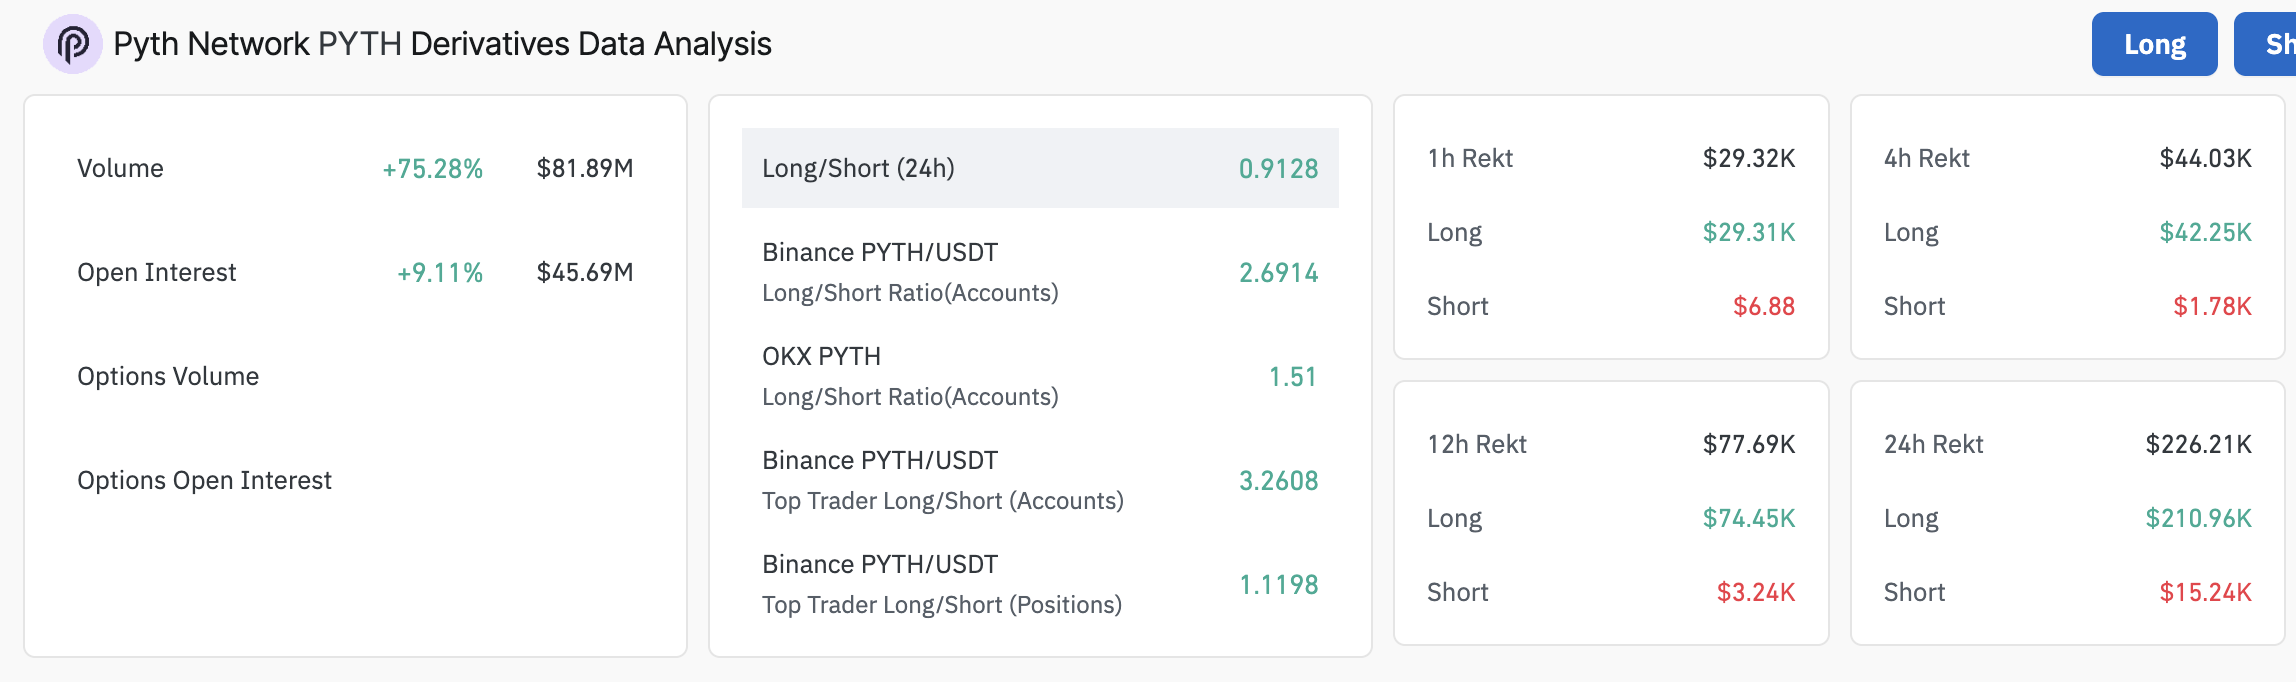
PYTH derivatives market data | Source: CoinGlass
Rising OI alongside increasing volume indicates that trader interest in the token is growing, with new positions being opened. It also signals higher liquidity, making it easier for traders to enter or exit positions. If PYTH's price extends the drawdown, increasing OI as volume rises would imply a strong bearish momentum.
Pyth Network bears take control amid price decline
Pyth Network's price extends losses below the 50-day Exponential Moving Average (EMA) currently at $0.158, following its recent uptrend's rejection around the 100-day EMA at approximately $0.18.
A sell signal from the SuperTrend indicator encourages traders to sell PYTH, anticipating a larger pullback towards the April 7 support at $0.107. This trend-following indicator uses the Average True Range (ATR) to measure volatility. A sell signal occurs when the price falls below the SuperTrend indicator's line, turning red from green.
Traders can use this tool as a dynamic support or resistance, suggesting PYTH is in a strong downtrend.
After confirming a sell signal on the daily chart, the Moving Average Convergence Divergence (MACD) indicator reinforces the bearish structure. Such a signal manifests with the MACD line (blue) crossing below the signal line. The expanding red histograms below the centre line cement the bears' influence on PYTH.
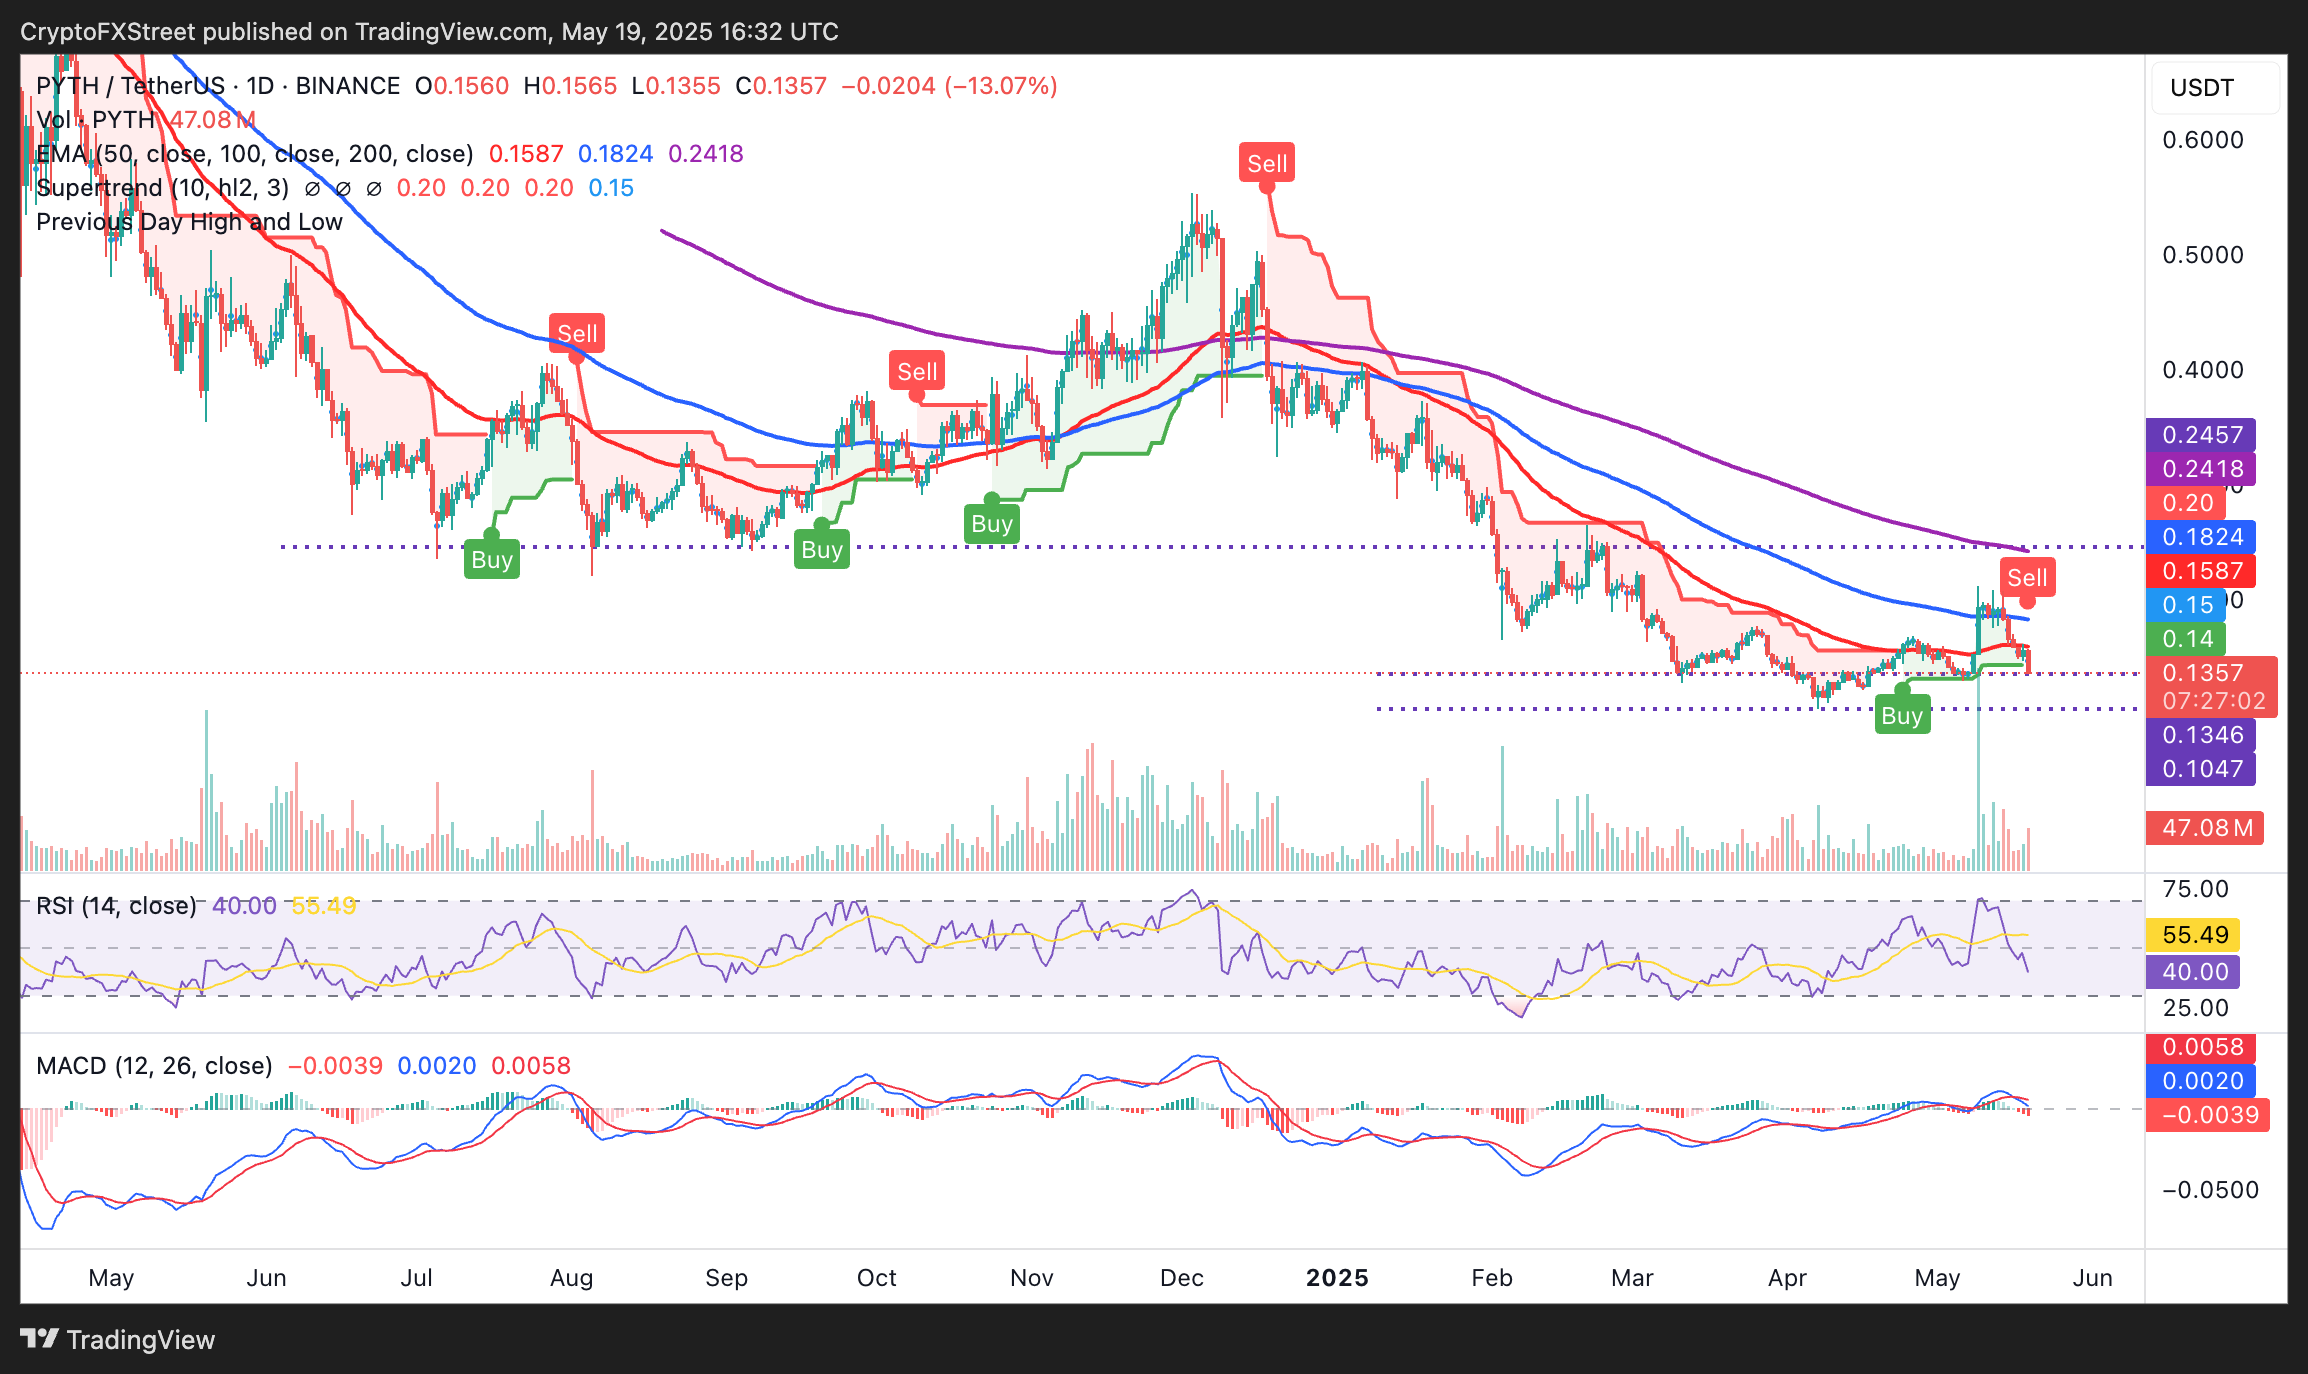
PYTH/USDT daily chart
The Relative Strength Index (RSI) indicator at 40 indicates a strong downward trend, reflecting PYTH's retreat from its peak of $0.211. This suggests the potential for further declines toward lower support levels, such as the $0.107 demand zone tested on April 7.
However, if the RSI slips below 30 into oversold territory, it could signal an impending trend reversal, as such conditions often precede sharp recoveries and significant price gains.
Cryptocurrency prices FAQs
Token launches influence demand and adoption among market participants. Listings on crypto exchanges deepen the liquidity for an asset and add new participants to an asset’s network. This is typically bullish for a digital asset.
A hack is an event in which an attacker captures a large volume of the asset from a DeFi bridge or hot wallet of an exchange or any other crypto platform via exploits, bugs or other methods. The exploiter then transfers these tokens out of the exchange platforms to ultimately sell or swap the assets for other cryptocurrencies or stablecoins. Such events often involve an en masse panic triggering a sell-off in the affected assets.
Macroeconomic events like the US Federal Reserve’s decision on interest rates influence crypto assets mainly through the direct impact they have on the US Dollar. An increase in interest rate typically negatively influences Bitcoin and altcoin prices, and vice versa. If the US Dollar index declines, risk assets and associated leverage for trading gets cheaper, in turn driving crypto prices higher.
Halvings are typically considered bullish events as they slash the block reward in half for miners, constricting the supply of the asset. At consistent demand if the supply reduces, the asset’s price climbs.
Recommended Articles


