
Solana price faces 50-day resistance as SOL futures debut on CME Group with $5M volume on fifth anniversary
- Solana price stagnated around the $128 mark on Monday, despite multiple active bullish catalysts.
- Alameda research’s recent SOL unlocks ahead of FTX creditor repayments created a bearish overhang since start of March
- The falling wedge trading pattern hints SOL could retest the 50-day peak of $259 mark during the next rebound phase.
Solana (SOL) stagnated around the $128 mark on Monday despite multiple bullish catalysts. The recent SOL unlocks by Alameda Research, ahead of FTX creditor repayments, have created a persistent bearish overhang since early March.
Solana (SOL) stagnates below $130 despite fresh bullish catalysts
Since the beginning of March 2025, Solana has underperformed relative to rival layer-1 altcoins. Key developments, including ETF filing advancements and Donald Trump’s inclusion of SOL in a crypto strategic reserve, have acted as bullish catalysts. However, while assets like XRP, Cardano, and Litecoin have rallied on similar news, Solana has struggled to gain upward momentum.
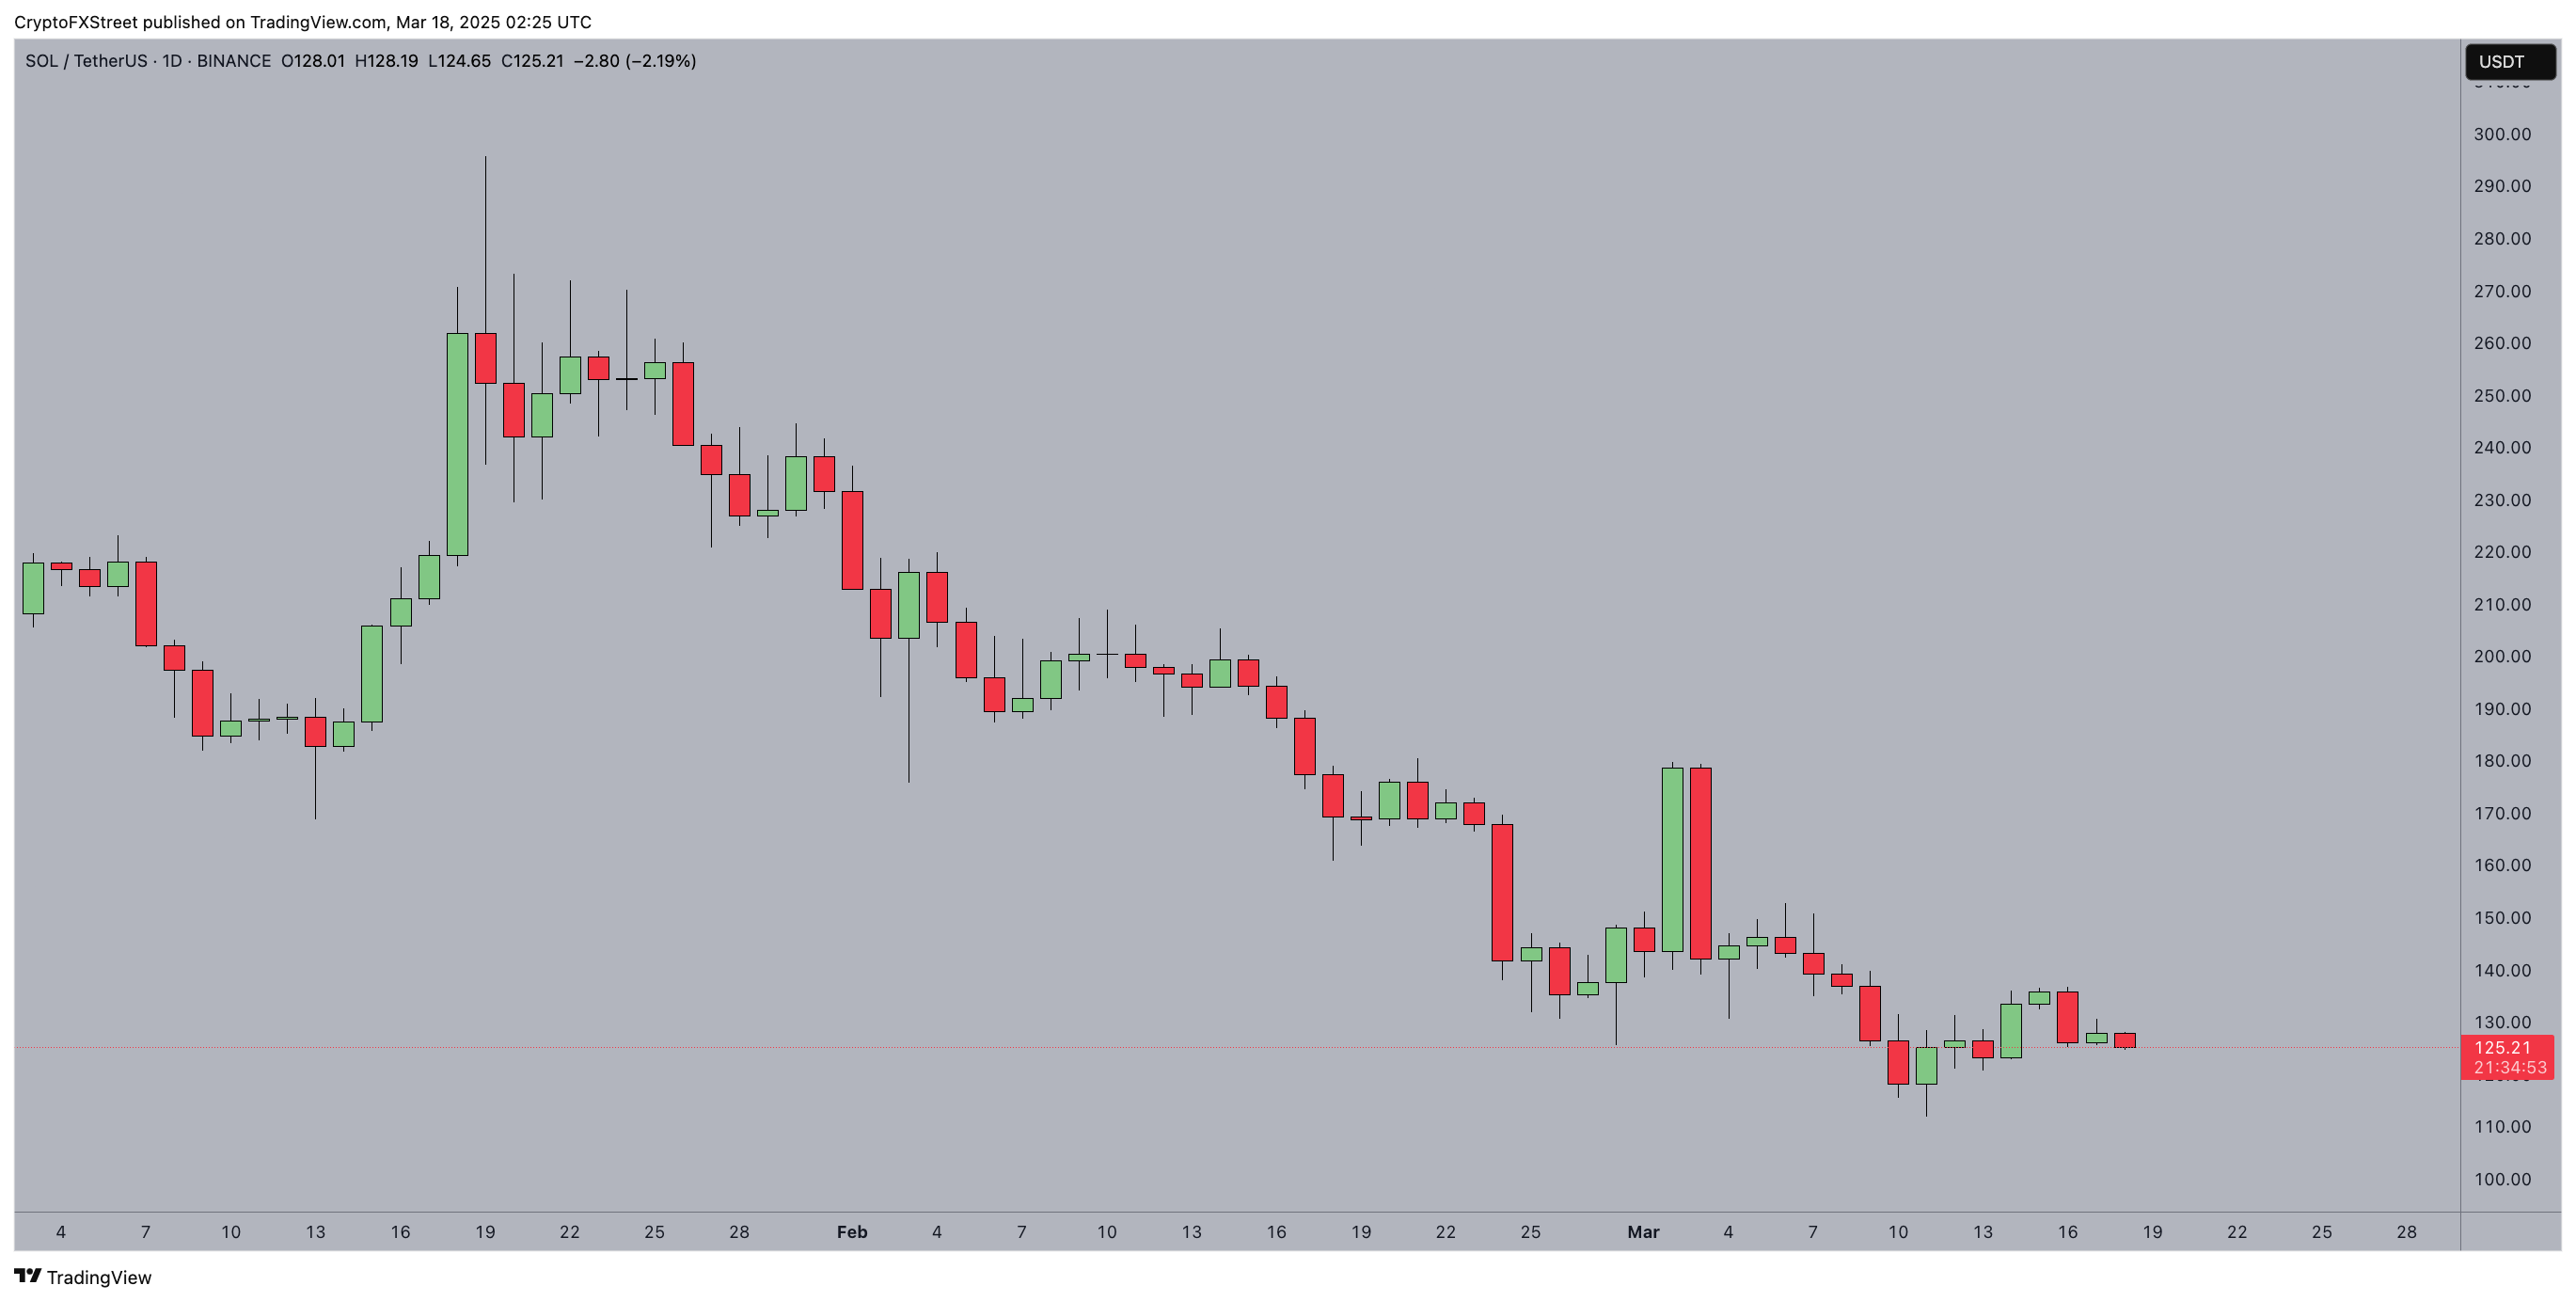 Solana price action | SOLUSD
This trend continued on Monday as Solana remained trapped below the $130 resistance level, despite two major positive market events.
CME launches Solana Futures, yet price action remains subdued
Following its announcement in February, the Chicago Mercantile Exchange (CME) officially launched Solana futures trading on Monday.
Trading volumes reached $5 million on the first day, reflecting growing institutional interest.
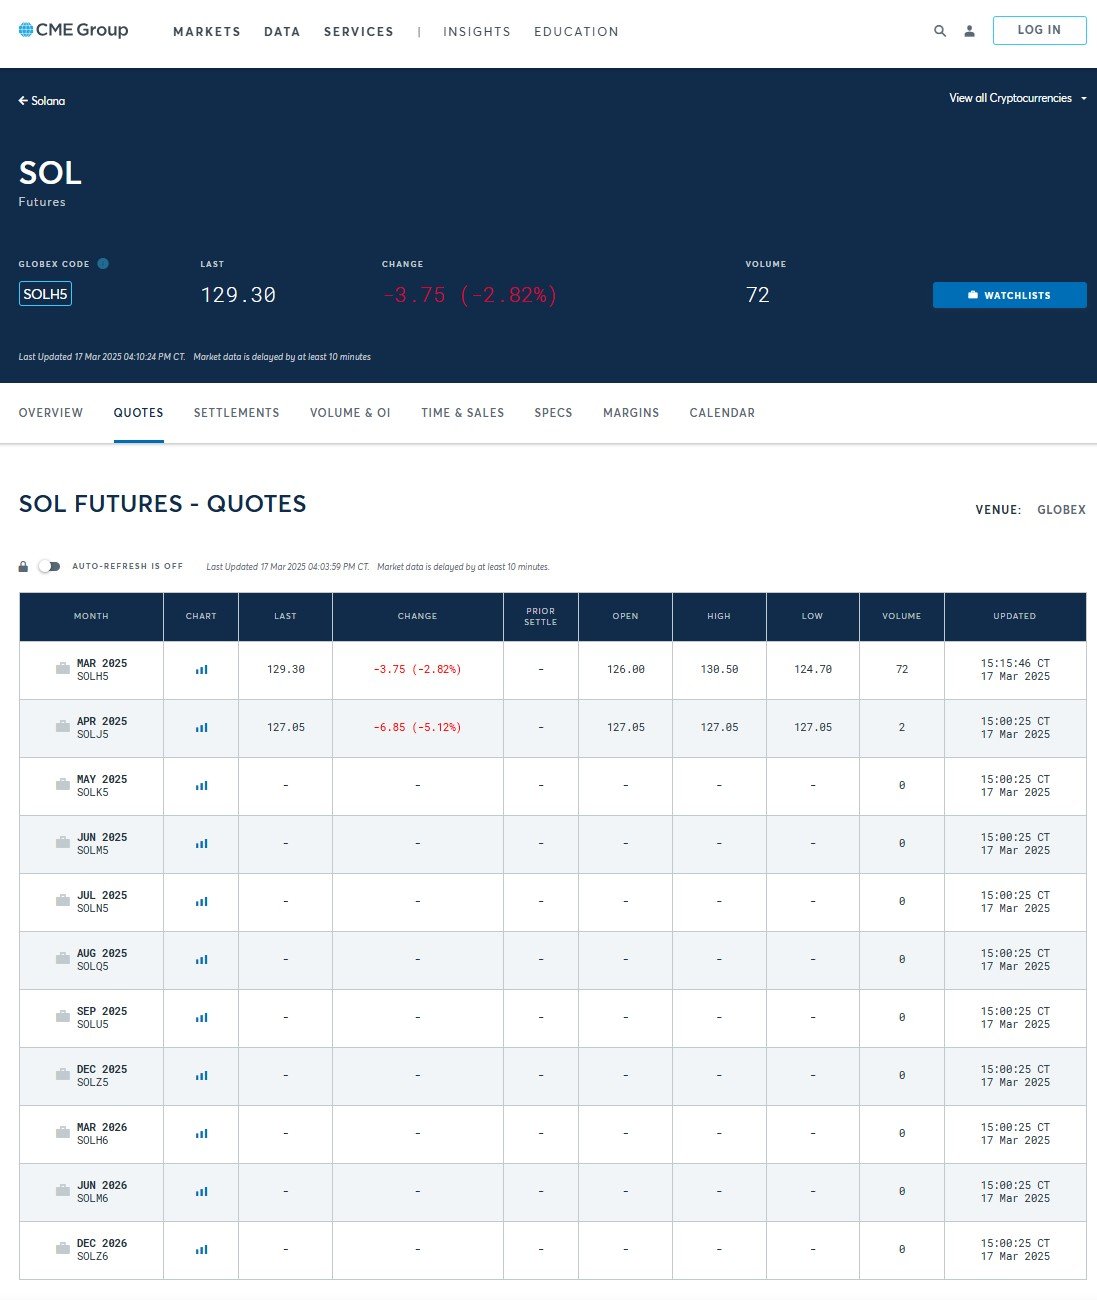
Solana futures, first day trading volumes hit $5 million | Source: CME Group
While this development boosted investor sentiment, it failed to generate immediate buying pressure, as SOL remained below the $130 resistance level.
Solana’s 5th Anniversary: A record-breaking milestone without market impact
In a second major positive catalyst this week, the Solana team celebrated the blockchain network’s fifth anniversary with a commemorative post on March 16, 2025.
Launched in March 2020 by founder Anatoly Yakovenko Solana, marks 5th anniversary with record-breaking stats.
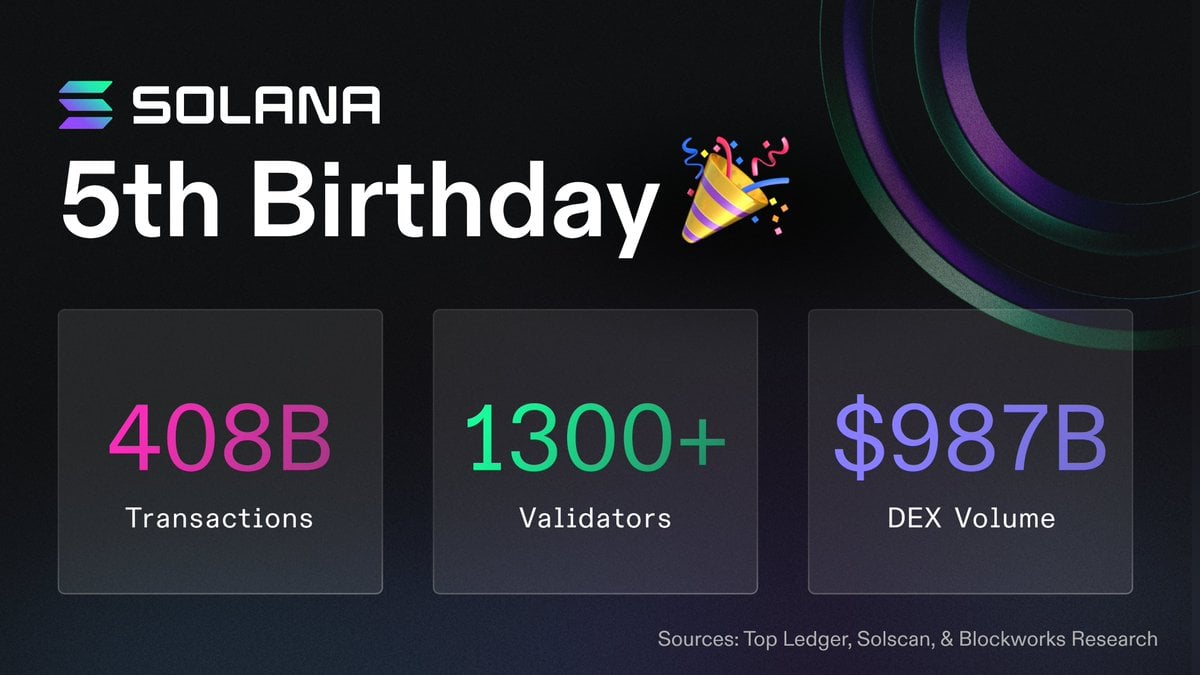
Solana fifth anniversary stats, March 2025 | Source: X.com/Solana
According to the anniversary post on X, the Solana blockchain has processed over 408 billion transactions, secured by more than 1,300 validators, and facilitated a total volume exceeding $987 billion. These figures affirm Solana’s position as one of the top 3 most valuable layer-1 blockchain, renowned for its speed and scalability.
Despite a series of planned ecosystem events to mark the occasion, Solana’s fifth anniversary failed to ignite a price rally on Monday, March 17. SOL traded sideways at around $128.
Why is SOL price stagnant despite major catalysts?
FTX estate outflows have created a persistent bearish overhang on Solana prices since the start of the month.
On March 1, 2025, the FTX estate and Alameda Research initiated the un-staking of 11.2 million SOL tokens, valued at approximately $1.5 billion.
By March 4, blockchain analytics firm Spot On Chain reported that 3.03 million SOL ($432.5 million) had been unstaked and distributed across 37 wallets, with 24,799 SOL ($3.38 million) already deposited on Binance.
This marked the largest single un-staking event since November 2023, when FTX first began liquidating assets post-bankruptcy. Since then, a total of 7.83 million SOL has been unstaked, leaving an estimated 5.5 million SOL ($693.8 million at $126 per SOL) still locked in staking reserves, according to Arkham Intelligence.
SOL Price Forecast: Falling Wedge pattern hints at $259 breakout after prolong consolidation
With further sell-offs expected from the FTX estate’s liquidations, new buyers remain hesitant to accumulate SOL at current levels, contributing to the ongoing price stagnation.
However, on the positive side, strategic bull traders could hold SOL as prolonged consolidations often precedes major price breakout phases.
Technical indicators on the SOLUSD daily chart also offer data-driven insights supporting this optimistic long-term outlook on Solana price action.
First the SMA death cross, where the 50-day moving average has fallen below the 200-day moving average, which confirms the lingering bearish momentum caused by FTX estate month-long sell-offs.
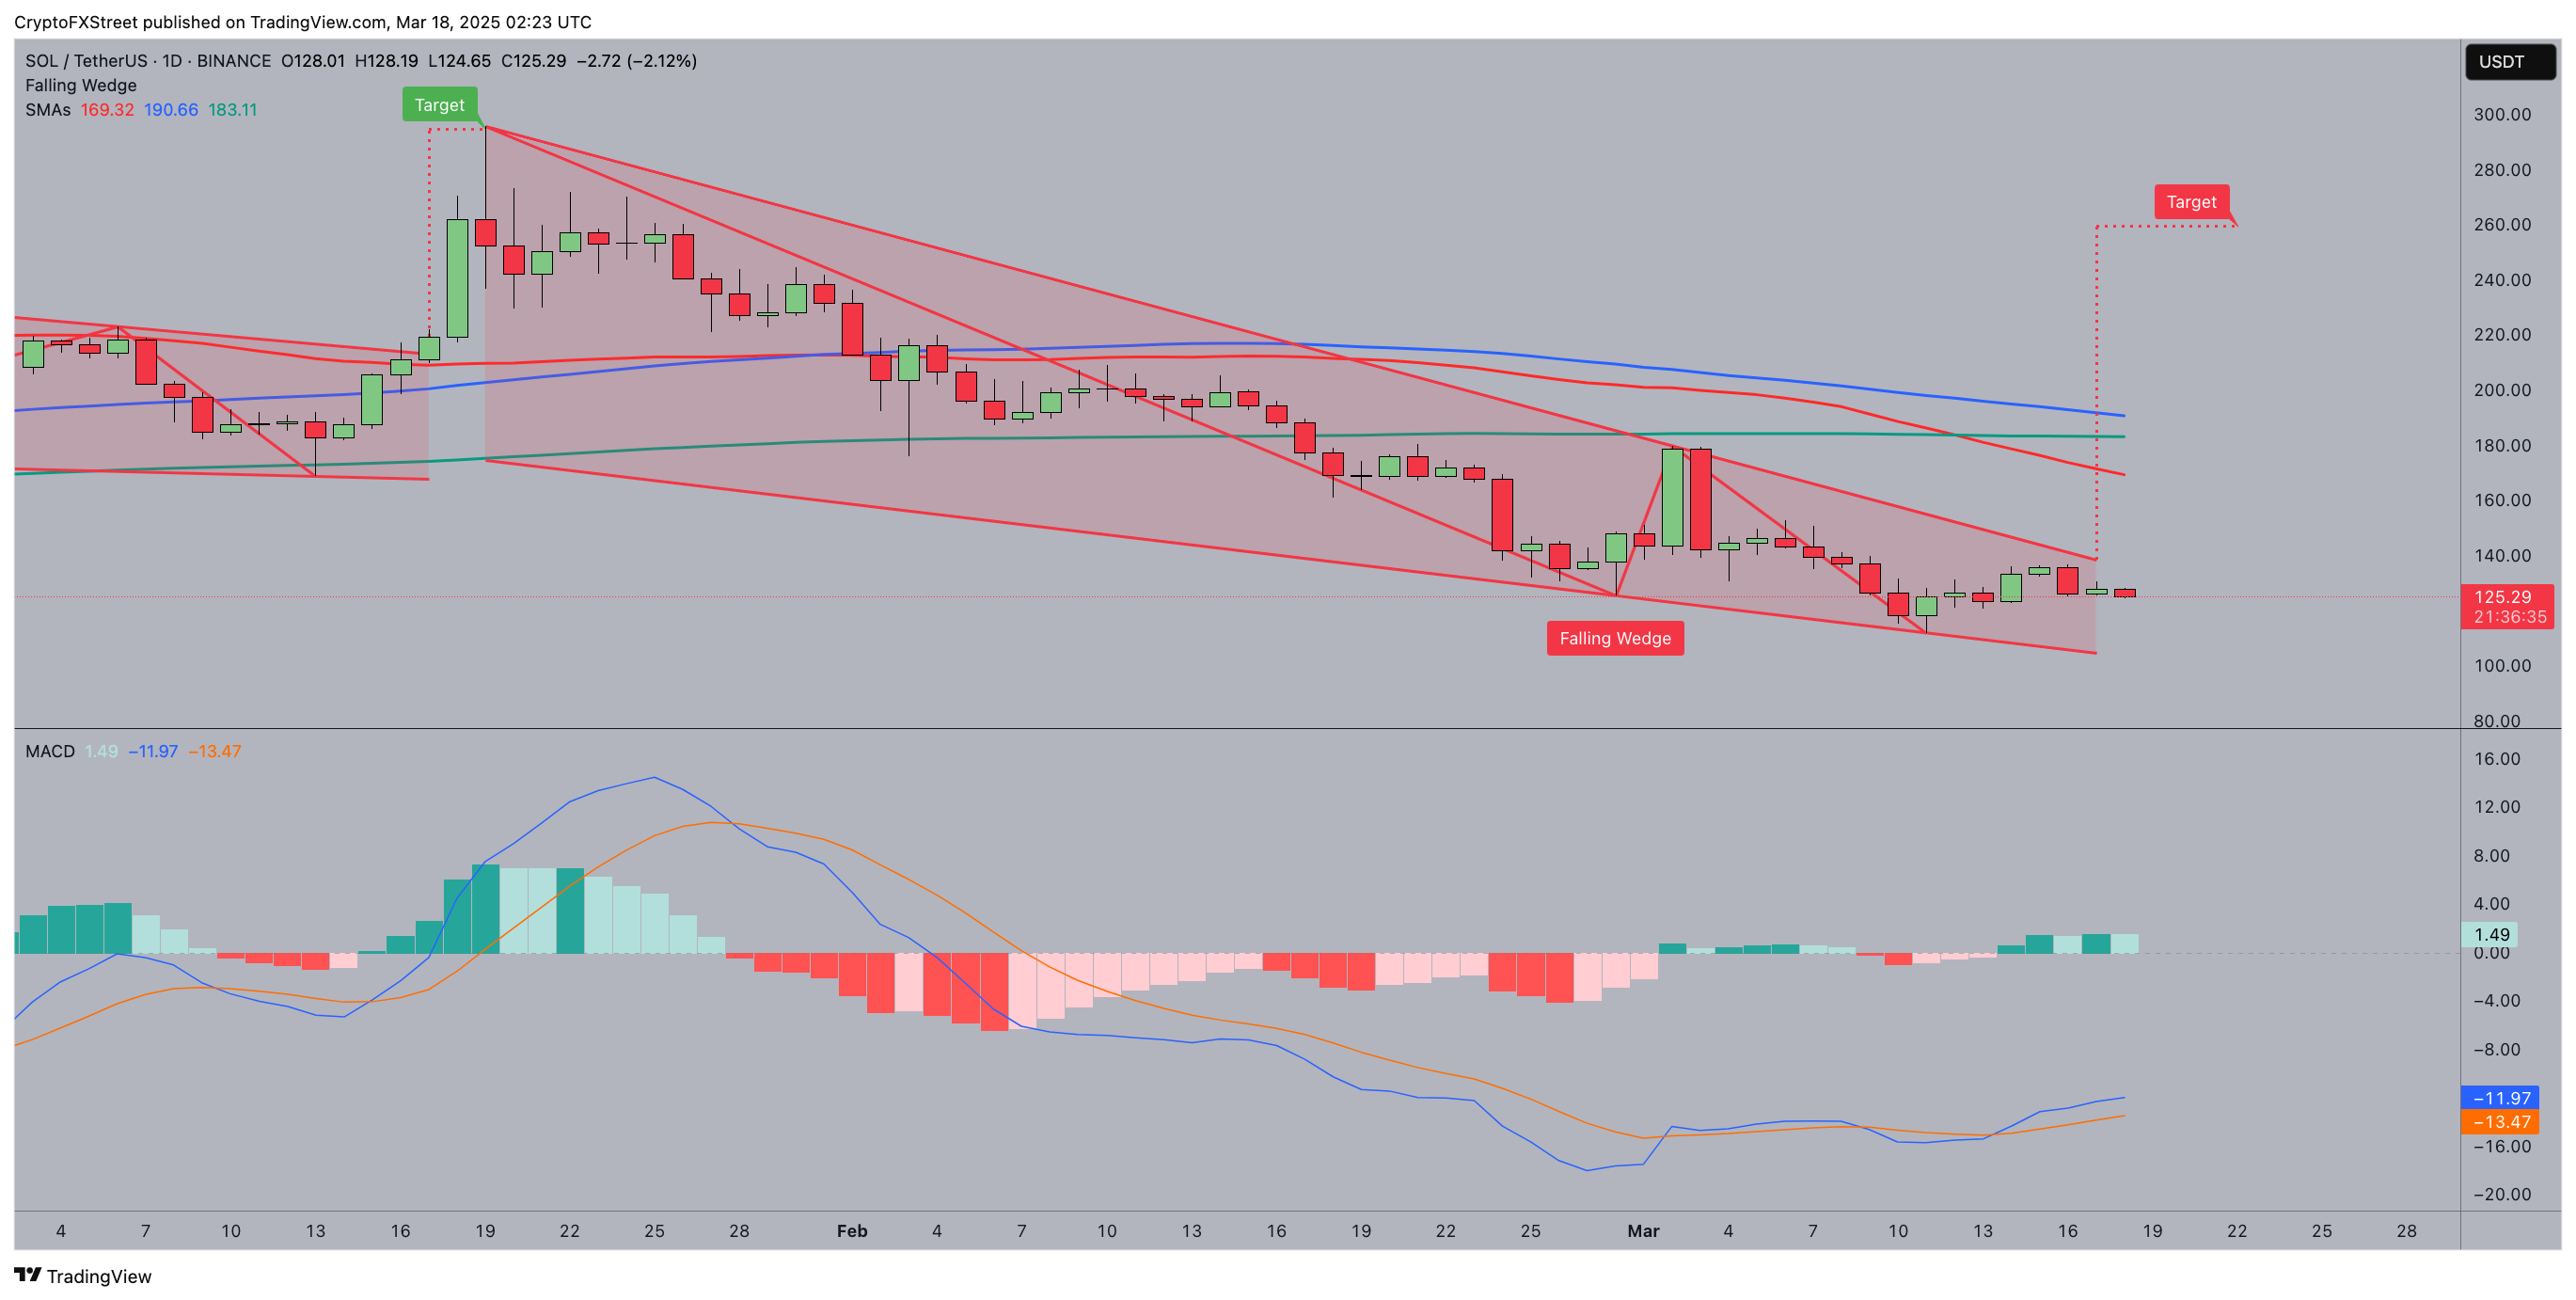 Solana price forecast | SOLUSDT
Historically, such crosses confirm sustained downtrends, but they can also indicate oversold conditions when paired with strong reversal patterns. In this case, the Falling Wedge pattern hints at a near-term breakout for Solana price as sell-side pressure diminishes.
Supporting this outlook, the MACD histogram is showing early signs of bullish divergence, with green bars indicating a potential momentum shift.
If the MACD signal line crosses above the baseline, it could confirm a buy signal, aligning with past cycles where similar conditions led to sharp price recoveries.
However, failure to break out above the $130-$140 resistance zone could result in extended consolidation or a retest of lower support levels near $115-$120 before an uptrend resumes.
A successful breakout from the Falling Wedge would set SOL on a trajectory toward $169-$190, aligning with the 50-day resistance zone, before potentially surging to $259, a level last seen in January 2025.
Recommended Articles


