

Bitcoin Price Forecast: BTC pops above $82,000, setting new all-time high
Bitcoin price today: $82,000
- Bitcoin price reaches a new all-time high of $82,471 on Monday, following a rally of almost 17% the previous week.
- US spot Bitcoin ETFs experienced inflows of $1.61 billion last week following Trump’s victory and the Fed interest-rate cut.
- Historically, Bitcoin has delivered strong returns for traders in November, with an average gain of 44.24%, marking the highest monthly average of the year.
- The technical outlook on the weekly chart suggests a bullish rally ahead, while the daily chart indicates a potential short-term pullback.
Bitcoin (BTC) trades around $82,000 on Monday, having reached a new all-time high (ATH) of $82,471 earlier in the day and extending last week’s 17% rally. Optimism in crypto markets is widespread after the victory of crypto-friendly candidate Donald Trump in the US presidential election. While the long-term outlook for BTC and other altcoins looks positive, chances of a short-term correction are also increasing following seven consecutive daily sessions of gains.
The rally was further boosted by over $1.6 billion in US spot Bitcoin Exchange Traded Funds (ETFs) inflows and a Federal Reserve interest rate cut. Moreover, historically, data suggest the continuation of the ongoing rally as Bitcoin has traditionally delivered strong returns in November. From a technical point of view, while the weekly chart suggests a continued bullish rally, the daily chart points to a short-term pullback.
Institutional demand supports BTC’s bullish outlook
Institutional flows continued accumulating Bitcoin last week, with more inflow coming after Trump’s victory. According to Coinglass ETF data, US spot Bitcoin ETFs experienced a total net inflow of $1.61 billion last week. Thursday marked the highest single-day inflow ($1.36 billion) since the ETFs’ launch in January.
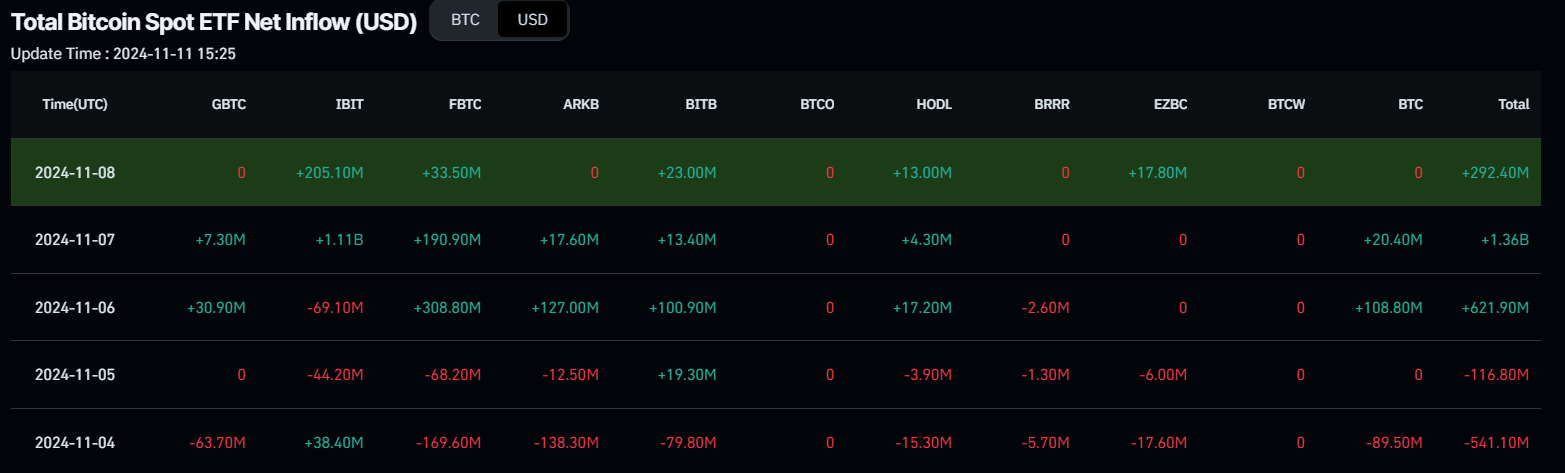
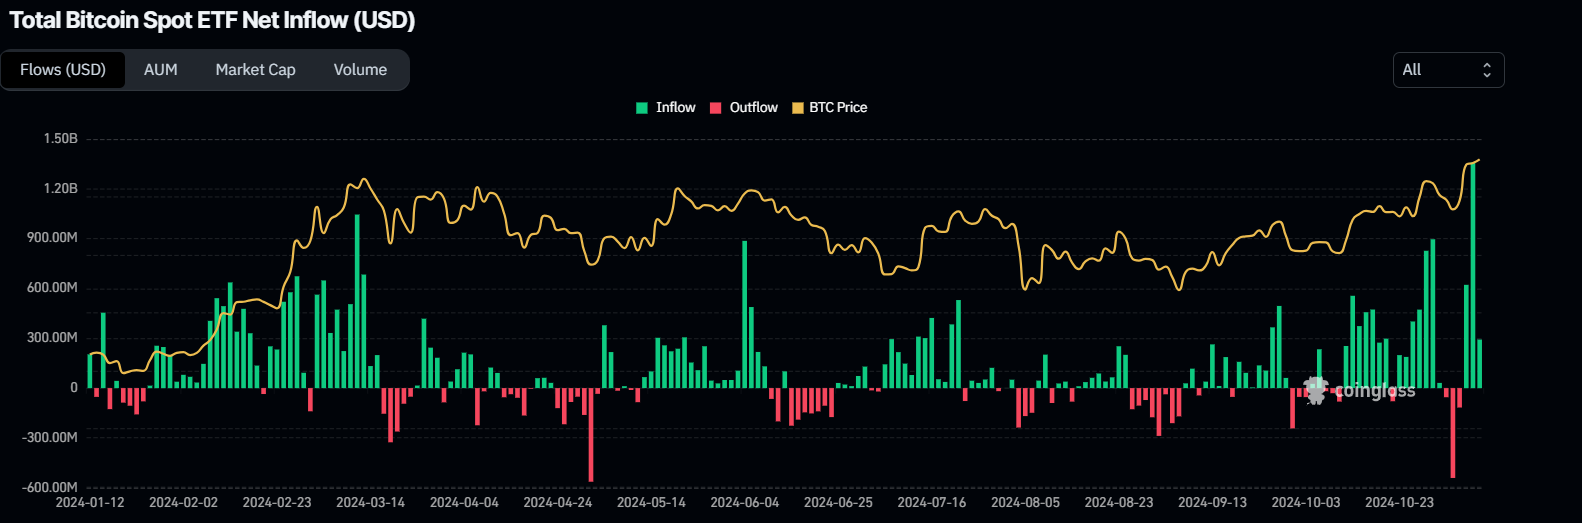
Total Bitcoin Spot ETF Net Inflow chart. Source: Coinglass
Bitcoin surges following Trump’s victory, Fed rate cut
Bitcoin surged almost 17% last week, hitting a new high of $81,500 on Sunday. The rally was largely fueled by Donald Trump’s decisive victory in the US presidential election. His pro-Bitcoin stance and proposed policies, such as eliminating taxes on Bitcoin transactions and creating a strategic reserve, have sparked bullish sentiment in the crypto community.
Additionally, on Thursday, the Fed reduced interest rates by 25 basis points (bps), further fueling the ongoing rally in Bitcoin and the broader crypto market. Historically, cryptocurrencies have responded positively to low interest-rate environments, as lower borrowing costs boost investors’ purchasing power, encouraging them to invest in risky assets like Bitcoin rather than keeping funds in banks for higher returns.
Bitcoin has the highest average monthly returns in November
Coinglass’s Historical Bitcoin Monthly Return (%) data shows how Bitcoin has performed in different monthly percentages. As shown in the graph below, Bitcoin generally yielded positive returns for traders in November, with an average of 44.24%, by far the highest monthly average out of all 12 months.
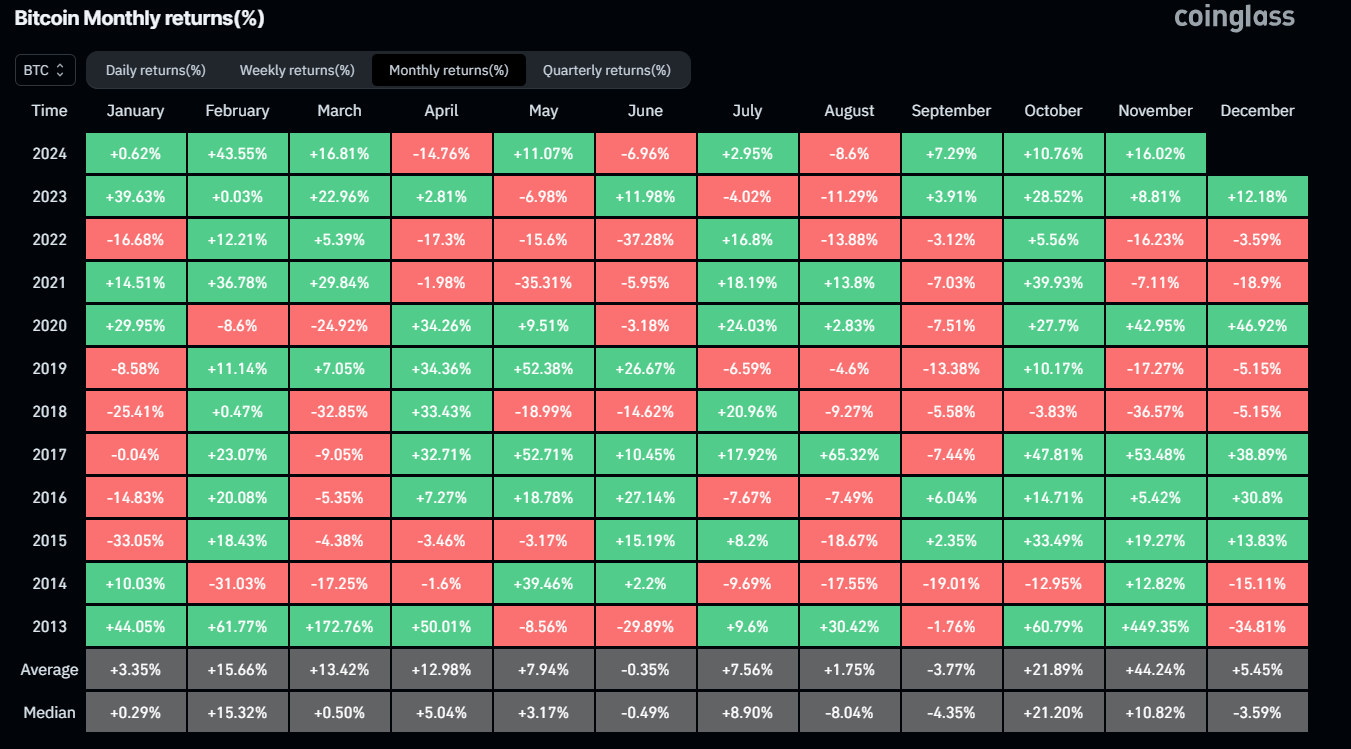
Bitcoin Monthly Return (%) chart. Source: Coinglass
Looking at the broader Q4, the average gain is 84%, well above the current 28.5% registered so far this quarter.
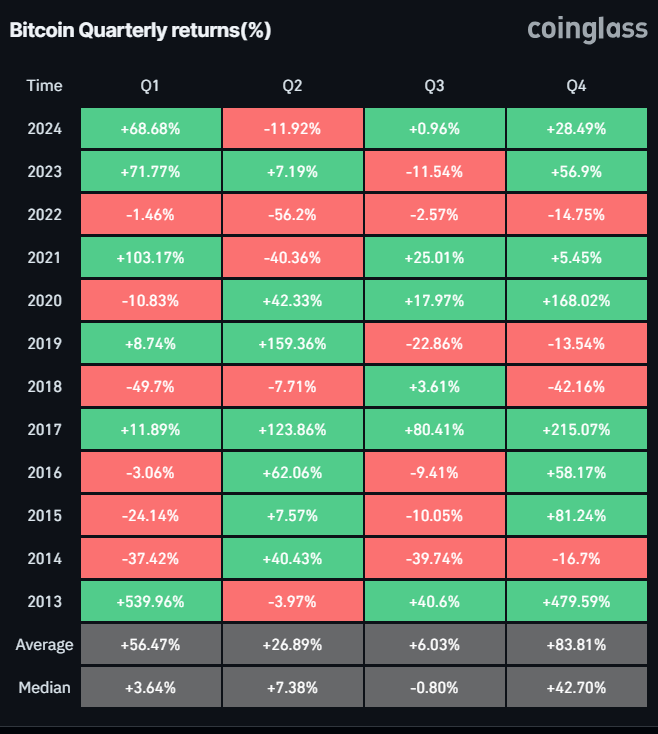
Bitcoin Quarterly returns (%) chart. Source: Coinglass
Bitcoin Price Forecast: Long-term bullish, short-term bearish
The weekly chart shows that BTC surged 16.86% last week. As of Monday, it was trading at around $82,000, reaching a new all-time high (ATH) of $82,471.
If BTC maintains its upward momentum, it could extend the rally to retest the 141.4% Fibonacci extension level at $84,034 (drawn from March’s high of $73,777 to August’s low of $49,000). A successful weekly close above this level would trigger an additional rally of 5.8%, potentially reaching a projected new all-time high of $89,089 at the 161.8% Fibonacci extension level.
The Relative Strength Index (RSI) on the weekly chart is currently at 69, nearing the overbought level of 70 and pointing upwards, indicating that bullish momentum is strong.
However, if the RSI enters the overbought territory and then moves back down, it could signal a potential sell-off or a pullback. Another possibility is the rally could continue, with the RSI staying above the overbought level and maintaining the bullish trend.
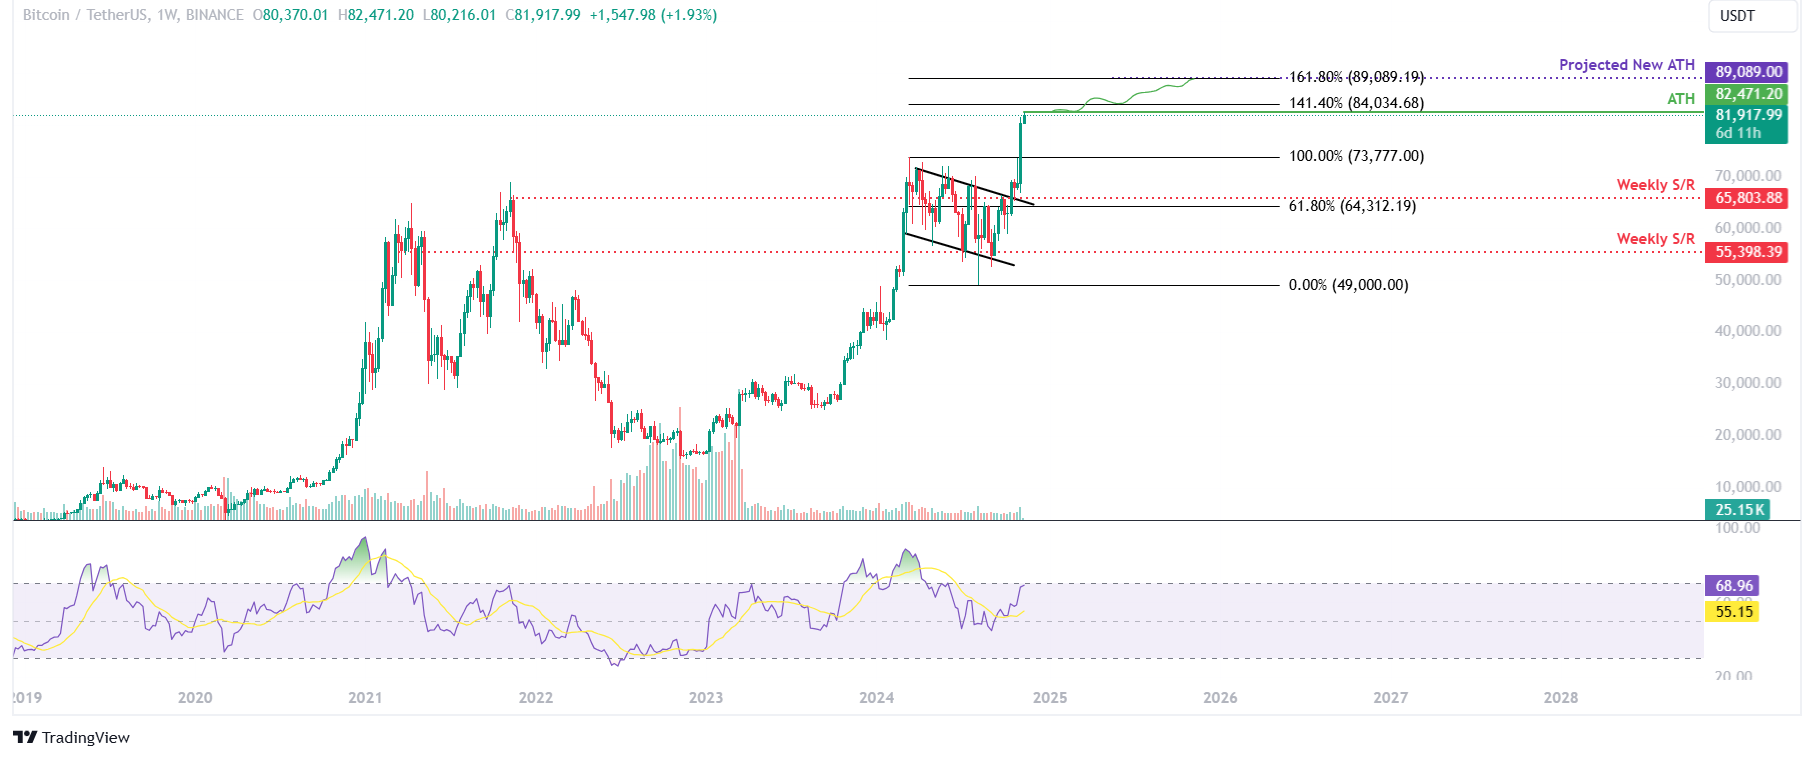
BTC/USDT weekly chart
The daily chart suggests the chances of a pullback are high. The chart indicates seven consecutive green candlesticks since November 5, suggesting the rally may be overstretched. Additionally, the RSI stands at 79, well above its overbought level of 70, signaling increasing risk. Traders should exercise caution when adding to their long positions, as a move out of the overbought territory by the RSI could provide a clear sign of a pullback.
If BTC faces a corrective pullback, it could decline 4% from its current position and retest its $78,777 support level.
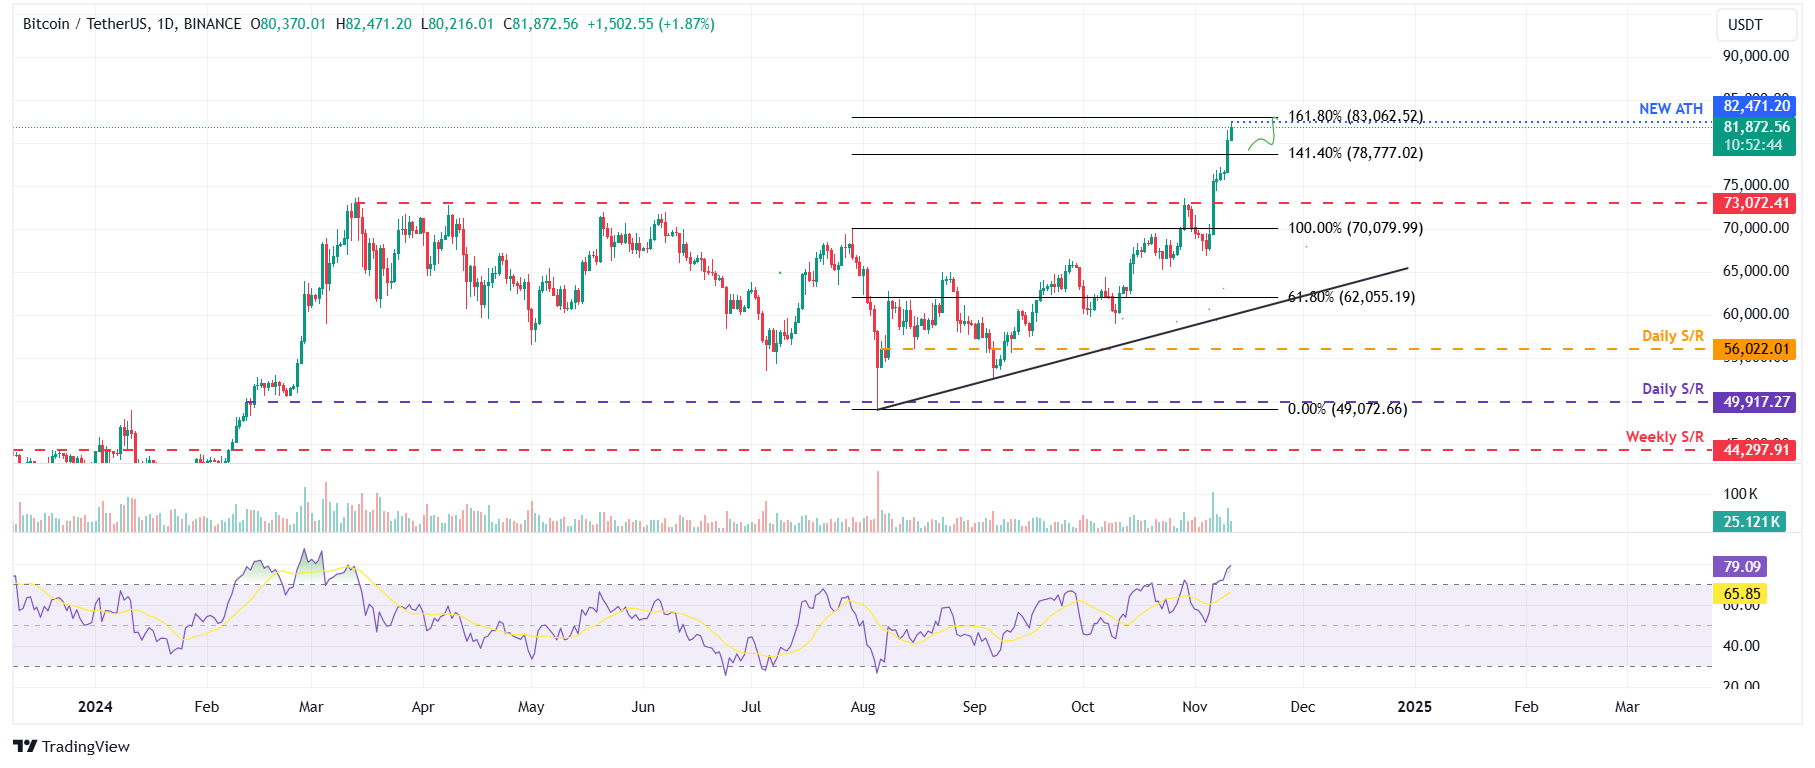
BTC/USDT daily chart
However, if the bulls continue the upward momentum, the rally would extend to retest its 161.8% Fibonacci extension level (drawn from July’s high of $70,079 to August’s low of $49,072) at $83,062.
Bitcoin, altcoins, stablecoins FAQs
Bitcoin is the largest cryptocurrency by market capitalization, a virtual currency designed to serve as money. This form of payment cannot be controlled by any one person, group, or entity, which eliminates the need for third-party participation during financial transactions.
Altcoins are any cryptocurrency apart from Bitcoin, but some also regard Ethereum as a non-altcoin because it is from these two cryptocurrencies that forking happens. If this is true, then Litecoin is the first altcoin, forked from the Bitcoin protocol and, therefore, an “improved” version of it.
Stablecoins are cryptocurrencies designed to have a stable price, with their value backed by a reserve of the asset it represents. To achieve this, the value of any one stablecoin is pegged to a commodity or financial instrument, such as the US Dollar (USD), with its supply regulated by an algorithm or demand. The main goal of stablecoins is to provide an on/off-ramp for investors willing to trade and invest in cryptocurrencies. Stablecoins also allow investors to store value since cryptocurrencies, in general, are subject to volatility.
Bitcoin dominance is the ratio of Bitcoin's market capitalization to the total market capitalization of all cryptocurrencies combined. It provides a clear picture of Bitcoin’s interest among investors. A high BTC dominance typically happens before and during a bull run, in which investors resort to investing in relatively stable and high market capitalization cryptocurrency like Bitcoin. A drop in BTC dominance usually means that investors are moving their capital and/or profits to altcoins in a quest for higher returns, which usually triggers an explosion of altcoin rallies.
Recommended Articles


