
EUR/USD wavers in calm markets, following strong US data, a hawkish ECB
- The Euro fluctuates near highs with the US Dollar a tad firmer on Friday.
- The upbeat US macroeconomic figures offset the impact of a hawkish ECB statement.
- Hopes that the US-EU trade deal is within reach keep EUR downside attempts limited.
The EUR/USD pair remains practically flat on Friday, consolidating gains near the three-week highs hit on the previous day. The US Dollar is a tad firmer, supported by positive US macroeconomic data, which offset the hawkish stance of the European Central Bank's (ECB) after Thursday's monetary policy decision.
The Euro (EUR) is trading around the 1.1750 level at the early European trading session on Friday after pulling back from 1.1790 highs on Thursday, following the ECB's monetary policy decision. The pair, however, remains about 1% higher on the week, relatively close to the multi-year high at 1.1830 hit earlier in July.
The ECB boosted the Euro on Thursday as President Christine Lagarde hinted at a longer interest rate pause. Lagarde stuck to her classical "meeting by meeting" approach on interest rates, but she showed optimism about the growth outlook and stated that inflation risks are strongly anchored, casting doubts about further cuts this year.
In the US, business activity beat expectations, led by a significant improvement in the services sector, while the weekly Initial Jobless Claims fell against expectations, giving further reasons to the Federal Reserve (Fed) to wait for more clarity about the impact of US tariffs on inflation and economic growth. The US Dollar extended its recovery after the data.
There is only second-tier data this Friday, with the German IFO Business Climate Index to be released during the European morning and the US Durable Goods Orders later on. Markets are expected to remain calm with currencies trading within narrow ranges, as investors brace for an event-packed week, with the Federal Reserve (Fed) monetary policy decision on the horizon.
Euro PRICE Today
The table below shows the percentage change of Euro (EUR) against listed major currencies today. Euro was the strongest against the British Pound.
| USD | EUR | GBP | JPY | CAD | AUD | NZD | CHF | |
|---|---|---|---|---|---|---|---|---|
| USD | 0.00% | 0.19% | 0.00% | 0.13% | 0.25% | 0.06% | 0.06% | |
| EUR | -0.00% | 0.23% | 0.00% | 0.16% | 0.16% | 0.06% | 0.06% | |
| GBP | -0.19% | -0.23% | -0.22% | -0.09% | -0.07% | -0.15% | -0.18% | |
| JPY | 0.00% | 0.00% | 0.22% | 0.12% | 0.19% | 0.06% | 0.05% | |
| CAD | -0.13% | -0.16% | 0.09% | -0.12% | 0.16% | -0.08% | -0.11% | |
| AUD | -0.25% | -0.16% | 0.07% | -0.19% | -0.16% | -0.11% | -0.08% | |
| NZD | -0.06% | -0.06% | 0.15% | -0.06% | 0.08% | 0.11% | -0.01% | |
| CHF | -0.06% | -0.06% | 0.18% | -0.05% | 0.11% | 0.08% | 0.00% |
The heat map shows percentage changes of major currencies against each other. The base currency is picked from the left column, while the quote currency is picked from the top row. For example, if you pick the Euro from the left column and move along the horizontal line to the US Dollar, the percentage change displayed in the box will represent EUR (base)/USD (quote).
Daily digest market movers: Euro remains supported on hopes of a trade deal
- The Euro is on track for a strong performance this week, fuelled by hopes of an imminent trade deal with the US. European Commission sources revealed that the deal includes 15% tariffs with exemptions for some products like automobiles or alcohol, which would avert the 30% levy announced by US President Donald Trump earlier this month.
- The pair, however, lost ground on Thursday, as the US flash S&P Global PMI showed that the Service's activity expanded to a 55.2 level in July, from 52.9 in June, beating expectations of a 53.0 reading. The Manufacturing PMI fell to 49.5 from 52.0 in the previous month and against expectations of an improvement to 52.5. The Composite index rose to 54.6 in July, from 52.9 in June.
- At the same time, data from the US Department of Labour revealed that Initial Jobless Claims declined for the sixth consecutive week to a three-month low of 217K, from the previous week's 221K, against expectations of an increase to 227K.
- Earlier on Thursday, the ECB left its Deposit Rate unchanged at 2%, as widely expected, and President Christine Lagarde affirmed that economic growth is "in line, if not better than the baseline" and observed that long-term rate expectations remain around the 2% target, hinting at a larger rate pause.
- Later on Friday, the German Ifo Business Climate is expected to show a moderate improvement with both the current assessment and the economic expectations indexes ticking up from June's levels.
- In the US, Durable Goods Orders are seen contracting at a 10.8% pace after a 16.4% rise in June. Core orders, which exclude transportation, are expected to have slowed down to 0.1% from last month's 0.5% growth.
EUR/USD consolidates gains with the 1.1830 level in sight
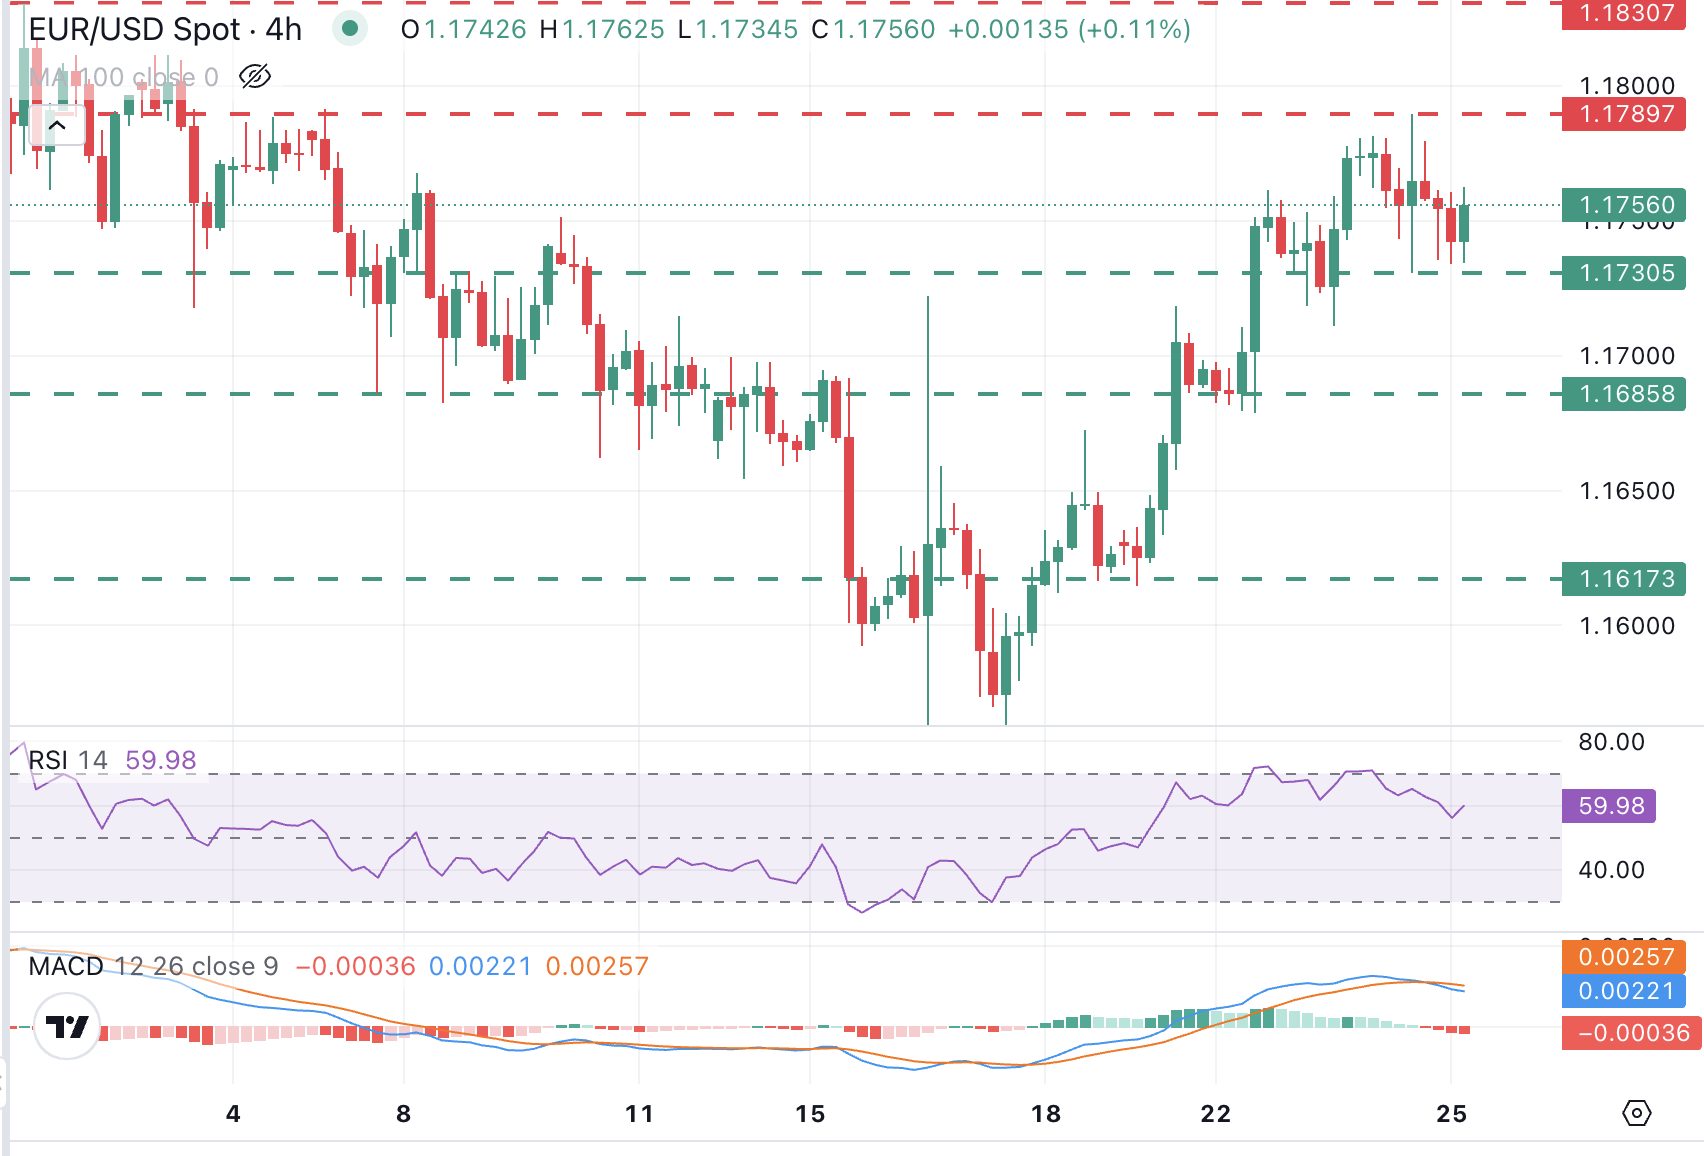
EUR/USD is trading within previous ranges on Friday, consolidating gains, following a significant recovery earlier this week, with technical indicators still in bullish territory. The 4-hour Relative Strength Index (RSI) indicator has retreated from overbought levels but remains above the 50 line that divides the positive from the negative area.
Price action remains supported above Thursday's low, at 1.1735 so far, guarding the path towards the July 23 and July 22 lows, at 1.1710 and 1.1680, respectively. On the upside, Thursday´s high, at 1.1790, is likely to challenge bulls ahead of the multi-year high at 1.1830.
Economic Indicator
Initial Jobless Claims
The Initial Jobless Claims released by the US Department of Labor is a measure of the number of people filing first-time claims for state unemployment insurance. A larger-than-expected number indicates weakness in the US labor market, reflects negatively on the US economy, and is negative for the US Dollar (USD). On the other hand, a decreasing number should be taken as bullish for the USD.
Read more.Last release: Thu Jul 24, 2025 12:30
Frequency: Weekly
Actual: 217K
Consensus: 227K
Previous: 221K
Source: US Department of Labor
Every Thursday, the US Department of Labor publishes the number of previous week’s initial claims for unemployment benefits in the US. Since this reading could be highly volatile, investors may pay closer attention to the four-week average. A downtrend is seen as a sign of an improving labour market and could have a positive impact on the USD’s performance against its rivals and vice versa.
Economic Indicator
S&P Global Services PMI
The S&P Global Services Purchasing Managers Index (PMI), released on a monthly basis, is a leading indicator gauging business activity in the US services sector. As the services sector dominates a large part of the economy, the Services PMI is an important indicator gauging the state of overall economic conditions. The data is derived from surveys of senior executives at private-sector companies from the services sector. Survey responses reflect the change, if any, in the current month compared to the previous month and can anticipate changing trends in official data series such as Gross Domestic Product (GDP), industrial production, employment and inflation. A reading above 50 indicates that the services economy is generally expanding, a bullish sign for the US Dollar (USD). Meanwhile, a reading below 50 signals that activity among service providers is generally declining, which is seen as bearish for USD.
Read more.Last release: Thu Jul 24, 2025 13:45 (Prel)
Frequency: Monthly
Actual: 55.2
Consensus: 53
Previous: 52.9
Source: S&P Global
Recommended Articles


