
Silver Price Forecast: XAG/USD downside attempts remain contained above $38.75
- Silver reversal has met buyers at the $38.75 area, which keeps the broader bullish trend in place.
- Precious metals are struggling as deals between the US and major trading partners have boosted risk appetite.
- XAG/USD rally from late June lows is showing signs of exhaustion.
Silver (XAG/USD) is trading lower for the second consecutive day on Thursday, as the risk-on mood weighs on demand for the safe-haven precious metals, but the pair has a significant support at the $38.75 area (July 22 lows), which is keeping the bullish structure in place so far.
News that the EU is closing in on a trade deal with the US, following another deal with Japan and similar agreements with the Philippines and Indonesia, has boosted risk appetite, with investors relieved that the worst trade tariffs can be averted.
Technical Analysis: Silver’s bullish momentum might be losing steam
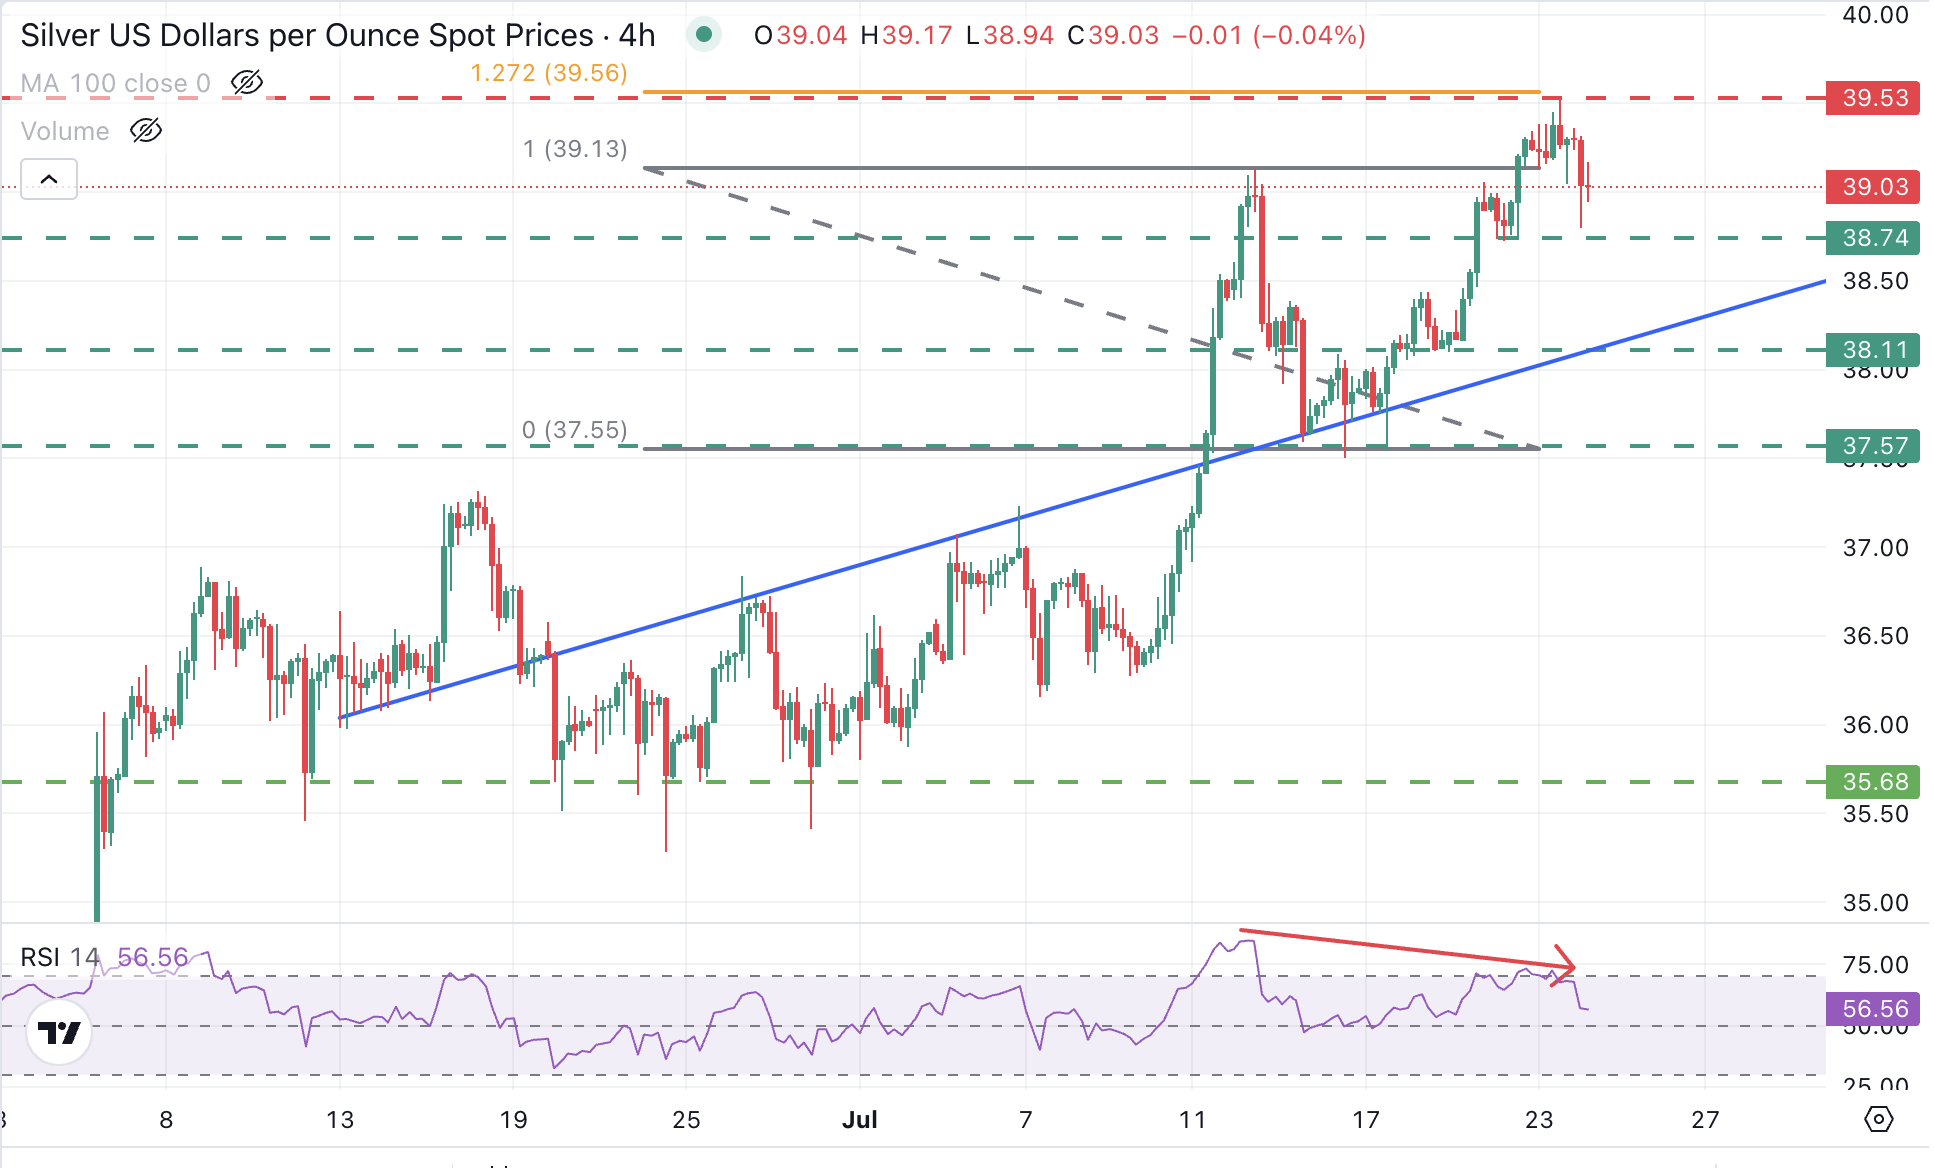
From a technical standpoint, price action remains bullish. The rally, however, may be showing signs of exhaustion after gaining about 10% since late June. The 4-hour RSI is featuring a bearish divergence that is often a sign that a significant correction is ahead.
The mentioned $38.75 area is keeping bears at bay for now, but the pair seems unable to return to Wednesday’s highs. A breach of that level would bring the confluence of the July 18 lows and the reverse trendline at $38.10 to the focus. Below here, a trend shift would be confirmed, and the next target would be the July 15, 16, and 17 lows at $37.55.
On the upside, resistance lies at Wednesday’s high, at $39.40. Further up, the next target would be the 161.8% Fibonacci extension of the early July rally, at the $40.00 psychological area.
Silver FAQs
Silver is a precious metal highly traded among investors. It has been historically used as a store of value and a medium of exchange. Although less popular than Gold, traders may turn to Silver to diversify their investment portfolio, for its intrinsic value or as a potential hedge during high-inflation periods. Investors can buy physical Silver, in coins or in bars, or trade it through vehicles such as Exchange Traded Funds, which track its price on international markets.
Silver prices can move due to a wide range of factors. Geopolitical instability or fears of a deep recession can make Silver price escalate due to its safe-haven status, although to a lesser extent than Gold's. As a yieldless asset, Silver tends to rise with lower interest rates. Its moves also depend on how the US Dollar (USD) behaves as the asset is priced in dollars (XAG/USD). A strong Dollar tends to keep the price of Silver at bay, whereas a weaker Dollar is likely to propel prices up. Other factors such as investment demand, mining supply – Silver is much more abundant than Gold – and recycling rates can also affect prices.
Silver is widely used in industry, particularly in sectors such as electronics or solar energy, as it has one of the highest electric conductivity of all metals – more than Copper and Gold. A surge in demand can increase prices, while a decline tends to lower them. Dynamics in the US, Chinese and Indian economies can also contribute to price swings: for the US and particularly China, their big industrial sectors use Silver in various processes; in India, consumers’ demand for the precious metal for jewellery also plays a key role in setting prices.
Silver prices tend to follow Gold's moves. When Gold prices rise, Silver typically follows suit, as their status as safe-haven assets is similar. The Gold/Silver ratio, which shows the number of ounces of Silver needed to equal the value of one ounce of Gold, may help to determine the relative valuation between both metals. Some investors may consider a high ratio as an indicator that Silver is undervalued, or Gold is overvalued. On the contrary, a low ratio might suggest that Gold is undervalued relative to Silver.
Recommended Articles


