

AUD/USD slides as weak inflation data fuels RBA rate cut bets

Source Fxstreet
  • Australian inflation missed expectations, reinforcing RBA rate cut speculation.
  • US-China trade tensions keep pressure on the Aussie.
  • Markets await the Fed’s decision for further direction.

The AUD/USD dropped by 0.57% to 0.6225 on Wednesday, struggling near weekly lows below 0.6250. Softer-than-expected inflation data from Australia strengthened expectations of a February rate cut by the Reserve Bank of Australia (RBA), putting additional pressure on the Aussie. Weak economic signals from China and escalating US-Sino trade tensions further dampened sentiment, while investors awaited the Federal Reserve’s policy decision later in the day.

Market sentiment remains cautious as investors await the Federal Reserve's (Fed) highly anticipated monetary policy decision. While the central bank is widely expected to keep interest rates steady, market participants are keen to gauge its stance on future rate cuts. Any hawkish tilt from the Fed, emphasizing persistent inflation risks or delaying policy easing, could drive further strength in the US Dollar, pressuring the AUD/USD lower.

At the same time, Australia’s inflation figures came in below expectations, adding to speculation that the RBA will ease monetary policy in its upcoming meeting. The latest data showed that quarterly inflation rose by just 0.2%, missing the projected 0.3%. On an annual basis, inflation slowed to 2.4%, down from 2.8% in the previous quarter and below the expected 2.5%. While December’s Monthly CPI increased by 2.5%, as forecasted, it remained within the RBA’s 2%-3% target range.
Adding to the Aussie’s challenges, concerns over potential US tariffs on Chinese goods continue to mount. White House Press Secretary Karoline Leavitt reiterated that President Donald Trump is still considering imposing 10% tariffs on China, with a decision expected in February. 

Technical overview

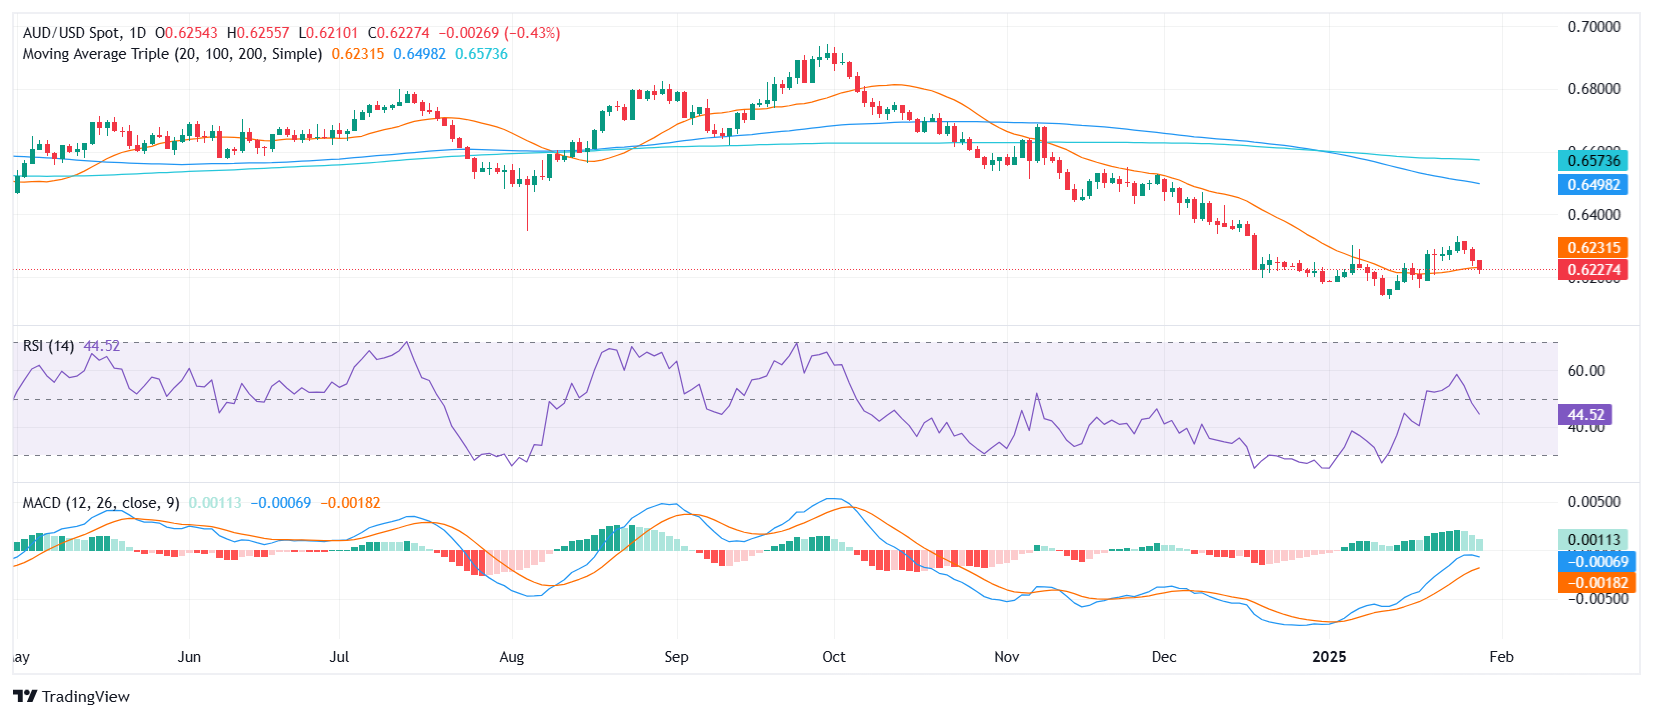
The AUD/USD remains under pressure, trading within a tight range as it struggles to recover. The Relative Strength Index (RSI) stands at 43, sharply declining in negative territory, indicating sustained bearish momentum. Meanwhile, the MACD histogram prints green bars but declinig, signaling some bullish presence.
Despite recent losses, technical indicators suggest mixed signals. The MACD hints at potential upside, while the RSI remains bearish. If the pair fails to reclaim the 20-day Simple Moving Average (SMA) at 0.6230, selling pressure could intensify. Immediate support is seen at 0.6200, with a break lower exposing 0.6170. Resistance remains at 0.6250, followed by 0.6300.

AUD/USD daily chart
 

Disclaimer: For information purposes only. Past performance is not indicative of future results.
placeholder
Fed hike odds near 90% into Wednesday's decision — how to trade the dollar, gold and the S&P 500A 0.3% monthly core CPI print has lifted the market-implied probability of a 25bp Fed hike on 16 September to roughly 86.5% ~ 90%, which would be the first increase since July 2023. Here is the decision timeline, the pricing versus the forecasts, both scenarios, and the key levels for the dollar, gold and the S&P 500.
Author  Suzie
Sep 14, Mon
A 0.3% monthly core CPI print has lifted the market-implied probability of a 25bp Fed hike on 16 September to roughly 86.5% ~ 90%, which would be the first increase since July 2023. Here is the decision timeline, the pricing versus the forecasts, both scenarios, and the key levels for the dollar, gold and the S&P 500.
placeholder
Silver breaks $64 as precious metals rebound — can gold hold the $4,280 line into the Fed decision?Silver has climbed back above $64 an ounce for the first time this week, leading a broad rebound across precious metals hours before the Federal Reserve delivers what is expected to be its first rate hike since 2023. Spot silver was last at $64.64, up 1.49% on the day, while gold reclaimed $4,300 and platinum and palladium both advanced. The question now is whether the bounce is a genuine turn — or a pause before the Fed's dot plot decides the next move.
Author  Suzie
Sep 16, Wed
Silver has climbed back above $64 an ounce for the first time this week, leading a broad rebound across precious metals hours before the Federal Reserve delivers what is expected to be its first rate hike since 2023. Spot silver was last at $64.64, up 1.49% on the day, while gold reclaimed $4,300 and platinum and palladium both advanced. The question now is whether the bounce is a genuine turn — or a pause before the Fed's dot plot decides the next move.
placeholder
Bitcoin falls below $75,000 as the CLARITY Act fails in the Senate — what the vote means for cryptoThe US Senate blocked the Digital Asset Market CLARITY Act in a 49-50 procedural vote, sending Bitcoin briefly below $75,000 — its biggest one-day drop since June. Ethereum fell more than 8%, Coinbase slid 10% and $75 billion of crypto market value evaporated. Here is what the vote was, why it failed, and the levels that matter now.
Author  Suzie
Sep 16, Wed
The US Senate blocked the Digital Asset Market CLARITY Act in a 49-50 procedural vote, sending Bitcoin briefly below $75,000 — its biggest one-day drop since June. Ethereum fell more than 8%, Coinbase slid 10% and $75 billion of crypto market value evaporated. Here is what the vote was, why it failed, and the levels that matter now.
placeholder
Dow drops 631 points as the Fed hikes — but futures are rebounding: what's next for US stocks?The Dow fell 631 points and the S&P 500 closed below 7,600 after the Fed hiked rates for the first time since 2023, with the dot plot showing 16 of 18 officials expect more tightening. Asia-session futures are already recovering — here are the levels and analyst views that decide whether 7,500 holds.
Author  Irene Q.
Yesterday 02: 54
The Dow fell 631 points and the S&P 500 closed below 7,600 after the Fed hiked rates for the first time since 2023, with the dot plot showing 16 of 18 officials expect more tightening. Asia-session futures are already recovering — here are the levels and analyst views that decide whether 7,500 holds.
placeholder
Dollar index tops 100 for the first time since July as the Fed's hawkish dot plot sinks inThe U.S. dollar index broke back above 100 for the first time since 31 July after the Fed delivered its first rate hike since 2023, with the dot plot showing 16 of 18 officials expect at least one more increase this year. Here are the levels that matter for DXY, the currencies feeling it most, and what to watch next.
Author  Irene Q.
Yesterday 02: 45
The U.S. dollar index broke back above 100 for the first time since 31 July after the Fed delivered its first rate hike since 2023, with the dot plot showing 16 of 18 officials expect at least one more increase this year. Here are the levels that matter for DXY, the currencies feeling it most, and what to watch next.
Related Instrument
goTop
quote