GBP/USD softens towards 1.2700 ahead of Tuesday’s UKJ labor figures, BoE Gov Bailey testimony

Source Fxstreet
  • GBP/USD slips back once again on Monday, dips into 1.2715.
  • UK labor figures due on Tuesday.
  • BoE Governor Bailey to testify on state of economy before UK Parliament.

The GBP/USD fell back once more on Monday, testing 1.2715 after a short-lived rally at the Modnay open reversed course. The Pound Sterling (GBP) couldn’t get over 1.2765 against the US Dollar (USD), sliding 0.4% peak-to-trough before consolidating in holiday-thinned market volumes during the US extended weekend in observance of Martin Luther King Day.

The UK’s Rightmove House Price Index rose 1.3% in January, compared to December’s -1.9%, while the annualized figure declined 0.7%, rebounding slightly from the previous period’s -1.1%. The MoM is a firm rebound in the headline figure, but still well below last May’s near-term peak of 1.8%.

Up next will be Tuesday’s UK Claimant Count Change, ILO Unemployment Rate, and Average Earnings for the annualized quarter ended in November.

December’s Claimant Count Change printed at 16K, while the ILO quarterly Unemployment Rate is forecast to hold steady at 4.2%. UK Average Earnings growth is expected to decline both with and without bonuses factored in, with Average Earnings Excluding Bonuses for the quarter through November expected to tick back from 7.3% to 6.6%.

Bank of England (BoE) Governor Andrew Bailey will be testifying before the Lords’ Economic Affairs Committee in London before departing to attend the World Economic Forum in Davos, Switzerland.

GBP/USD Technical Outlook

The GBP/USD is caught in a near-term sideways grind, with intraday prices getting caught up on the 200-hour Simple Moving Average (SMA) near 1.2720, while 1.2780 is proving to be a tricky technical ceiling for the pair to overcome.

Despite the pair stuck on the low side of the 1.2800 handle near December’s peak, the pair remains on the high end of momentum on daily candles, with the pair up 5.75% from October’s swing low of 1.2037.

GBP/USD Hourly Chart
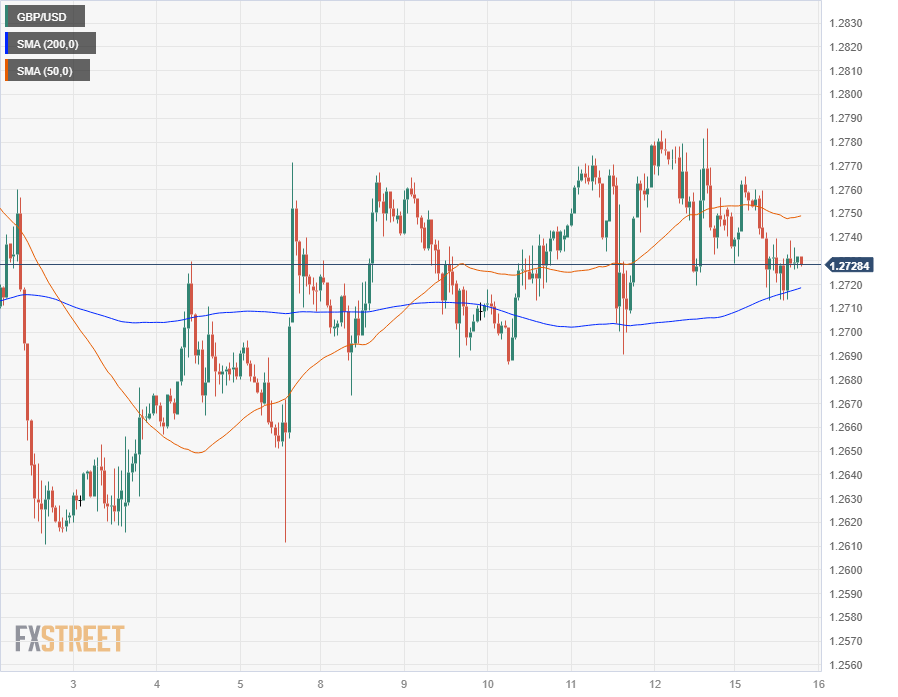
GBP/USD Daily Chart

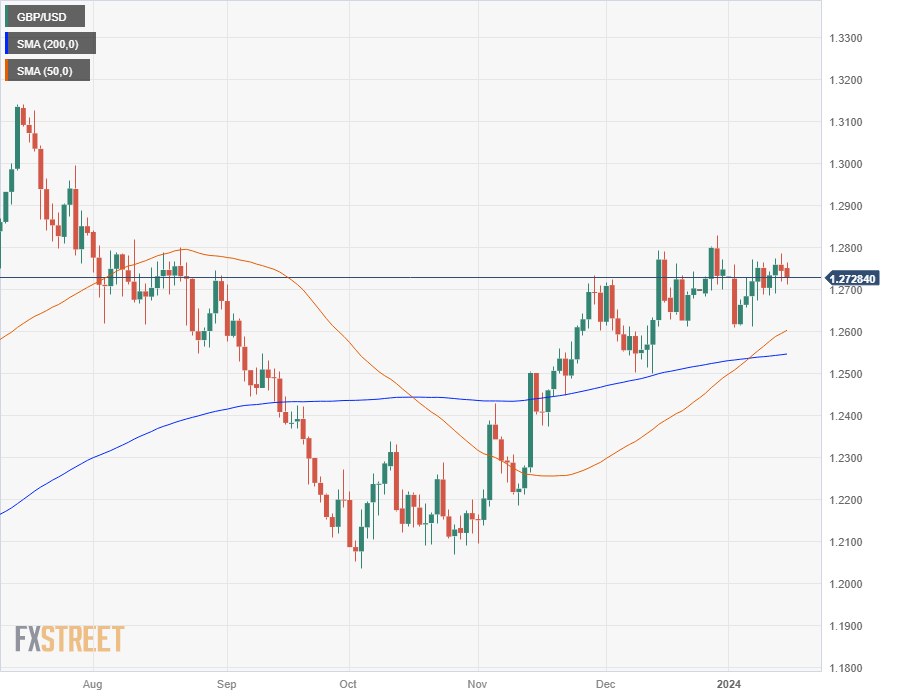
GBP/USD Technical Levels


Disclaimer: For information purposes only. Past performance is not indicative of future results.
placeholder
Bitcoin Suffers Year’s Strongest Waterfall-Style Decline. Will It Next Drop to the $60,000 Mark?During the Asian trading session on June 4, Bitcoin continued its multi-day slump, briefly dropping below the $62,000 mark to $61,338. As of press time, Bitcoin was trading at $63,844, wi
Author  TradingKey
8 hours ago
During the Asian trading session on June 4, Bitcoin continued its multi-day slump, briefly dropping below the $62,000 mark to $61,338. As of press time, Bitcoin was trading at $63,844, wi
placeholder
Bitcoin drops below $65K amid reinforced bear market signalsBitcoin (BTC) dipped further below $65,000 on Wednesday, with onchain data from Glassnode signaling a market firmly in a bear phase. The decline has pushed prices back into a key valuation range between the Realized Price and the True Market Mean.
Author  FXStreet
16 hours ago
Bitcoin (BTC) dipped further below $65,000 on Wednesday, with onchain data from Glassnode signaling a market firmly in a bear phase. The decline has pushed prices back into a key valuation range between the Realized Price and the True Market Mean.
placeholder
Forex Today: US Dollar stays resilient ahead of key US dataHere is what you need to know on Wednesday, June 3:
Author  FXStreet
Yesterday 10: 27
Here is what you need to know on Wednesday, June 3:
placeholder
$1.5 Billion in Crypto Assets Liquidated, Bitcoin Falls Below $66,000 Mark. What Is the Reason?On June 2, Eastern Time, the cryptocurrency market suffered its most severe wave of concentrated liquidations so far this year. Bitcoin ( BTC) fell below the $70,000 psychological support
Author  TradingKey
Yesterday 06: 32
On June 2, Eastern Time, the cryptocurrency market suffered its most severe wave of concentrated liquidations so far this year. Bitcoin ( BTC) fell below the $70,000 psychological support
placeholder
WTI rises to near $93.00 as Iran launches missiles toward Kuwait, BahrainWest Texas Intermediate (WTI) gains ground for the third successive day, trading around $92.90 per barrel during the Asian hours on Wednesday.
Author  FXStreet
Yesterday 01: 24
West Texas Intermediate (WTI) gains ground for the third successive day, trading around $92.90 per barrel during the Asian hours on Wednesday.
Related Instrument
goTop
quote