


USD/CNH tests the immediate support at the lower boundary of the rectangle around 168.80.
The 14-day Relative Strength Index remains below the 50 level, indicating a prevailing bearish bias.
The primary support appears at the nine-day EMA at 7.1781.
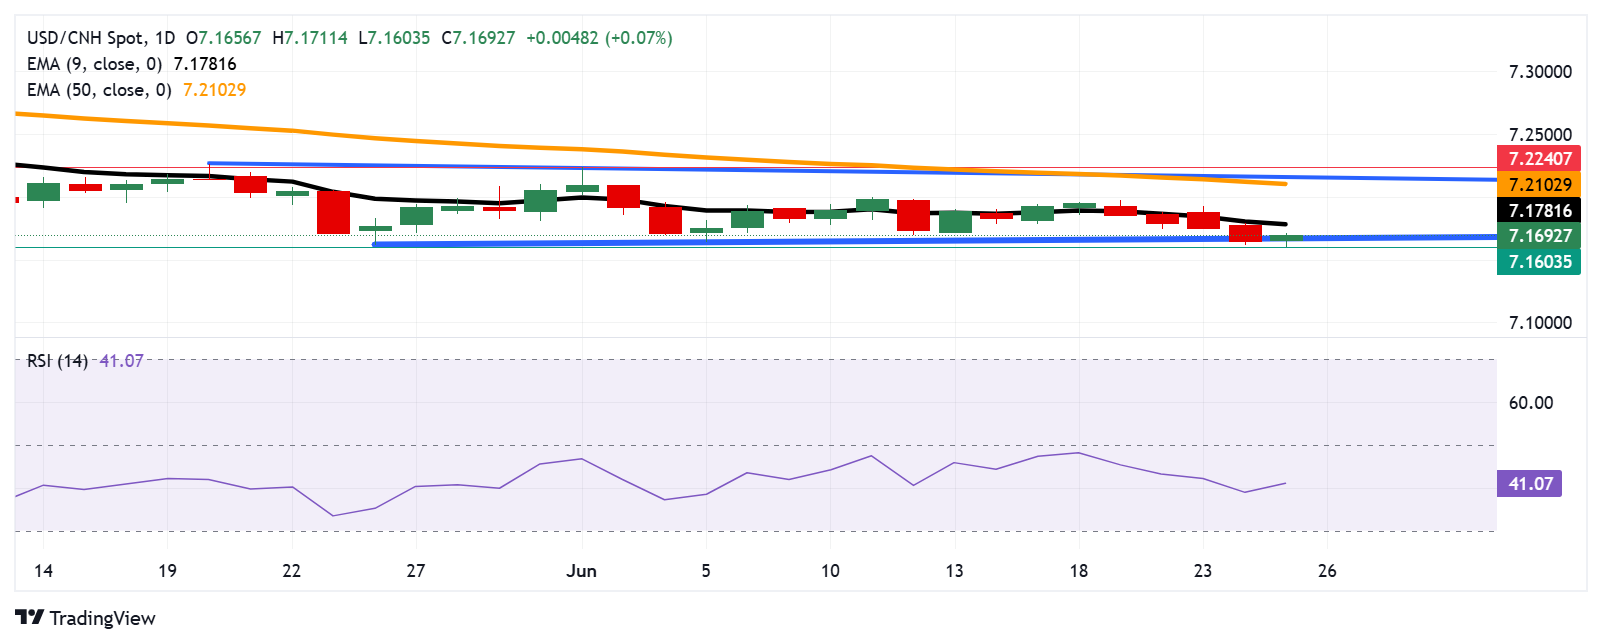
The USD/CNH pair halts its four-day winning streak, trading around 7.1690 during the Asian hours on Wednesday. An analysis of the daily chart indicates that the pair moves sideways within a rectangular pattern, which points to a consolidation phase.
However, the 14-day Relative Strength Index (RSI), a key momentum indicator, remains below the 50 level, suggesting a bearish momentum is in play. Additionally, the USD/CNH pair trades below the nine-day Exponential Moving Average (EMA), further suggesting weaker short-term price momentum.
On the downside, the USD/CNH pair hovers around the lower boundary of the rectangle around 168.80. A break below this level could confirm the ongoing bearish bias and put the downward pressure on the pair to retest the seven-month low at 7.1603, which was recorded on June 25.
The nine-day EMA at 7.1781 appears as the initial barrier. A successful breach above this level would improve the short-term price momentum and support the pair to explore the region around the 50-day EMA at 7.2102, followed by the rectangle’s upper boundary around 7.2150. Further resistance appears at the monthly high of 7.2240, reached on June 2.
USD/CNH: Daily Chart
* The content presented above, whether from a third party or not, is considered as general advice only. This article should not be construed as containing investment advice, investment recommendations, an offer of or solicitation for any transactions in financial instruments.


