

NZD/USD wobbles inside Thursday’s trading range around 0.6000 as investors seeks clarity on US-Iran tensions.
The White House signaled on Thursday that it has no plans to strike Iran in coming days.
The PBoC left its one-year and five-year LPRs steady at their current levels.
The NZD/USD pair trades in a limited range near the psychological level of 0.6000 during European trading hours on Friday. The Kiwi pair consolidates as investors seek clarity on the next action by the United States (US) on Iran.
On Thursday, the comments from the White House signaled that Washington has no plans to involve in the Israel-Iran war directly and will decide about that in next two weeks. This has increased the risk-appetite of investors, potentially increasing demand for riskier assets, such as the New Zealand Dollar (NZD).
Apparently, the safe-haven demand of the US Dollar (USD) has diminished, which has sent the US Dollar Index (DXY) lower to 98.60 from the weekly high of 99.15 posted on Thursday.
Meanwhile, the People’s Bank of China (PBoC) has held its interest rates unchanged, as expected, in the policy meeting earlier in the day. The PBoC kept the one-year and five-year loan prime rate (LPR) at 3.00% and 3.50%, respectively. The PBoC guided that it is committed to liquidity injections rather than additional rate cuts to protect banks’ net interest margins, Reuters reported.
Monetary policy decisions from the PBoC impacts the New Zealand Dollar significantly, given that the New Zealand (NZ) economy relies heavily on its exports to China.
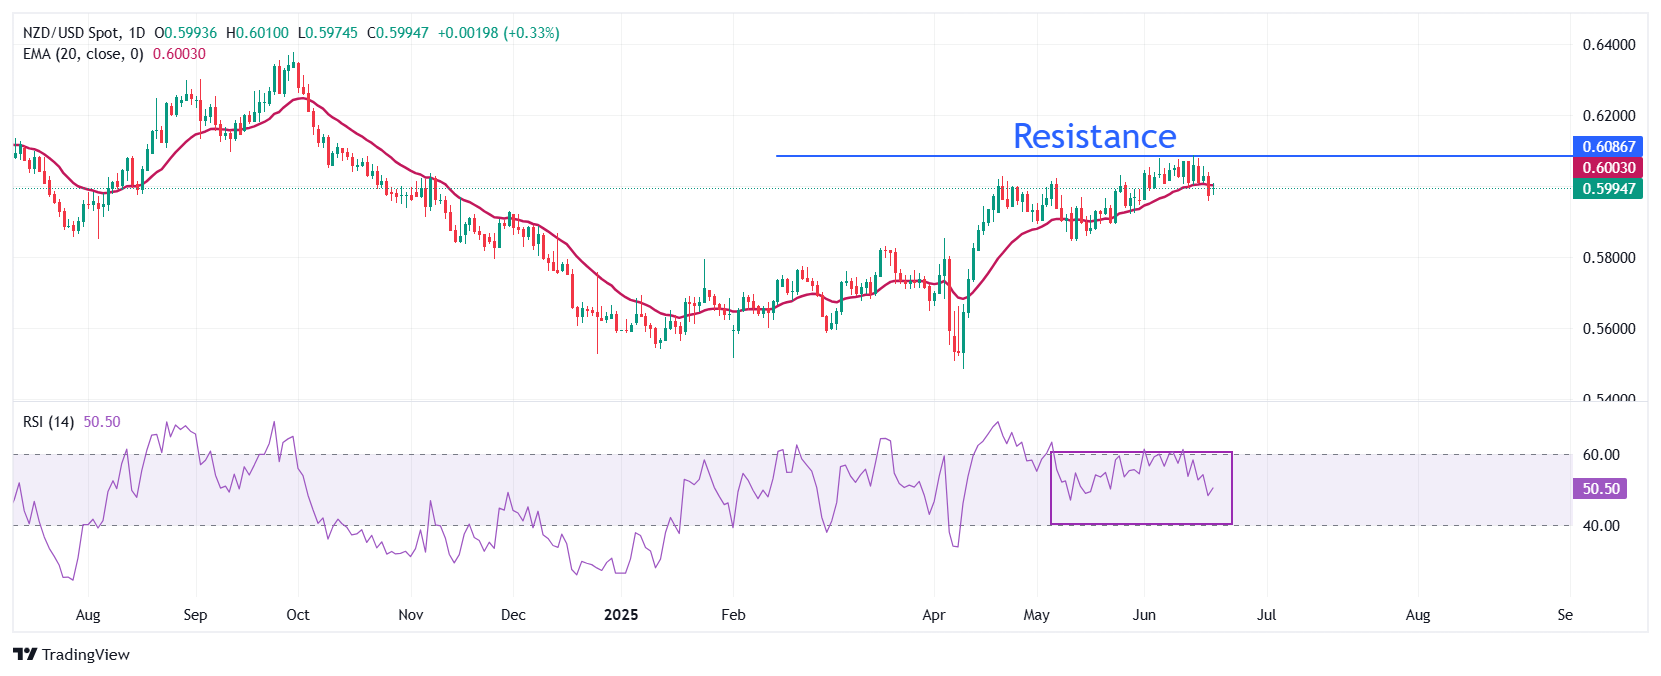
NZD/USD oscillates well inside the Thursday’s trading range, exhibiting a volatility contraction. The Kiwi pair wobbles around the 20-day Exponential Moving Average (EMA) near 0.6003, indicating a sideways trend.
The 14-day Relative Strength Index (RSI) oscillates inside the 40.00-60.00 range, suggesting indecisiveness among investors.
The Kiwi pair is expected to rise towards the September 11 low of 0.6100 and the October 9 high of 0.6145 if it manages to break above the June 19 high of 0.6040.
In an alternate scenario, a downside move below the May 12 low of 0.5846 will expose it to the round-level support of 0.5800, followed by the April 10 high of 0.5767.
NZD/USD daily chart
* The content presented above, whether from a third party or not, is considered as general advice only. This article should not be construed as containing investment advice, investment recommendations, an offer of or solicitation for any transactions in financial instruments.


