

GBP/USD gathers strength to near 1.3555 in Monday’s early European session.
The positive view of the pair prevails above the key 100-day EMA with the bullish RSI indicator.
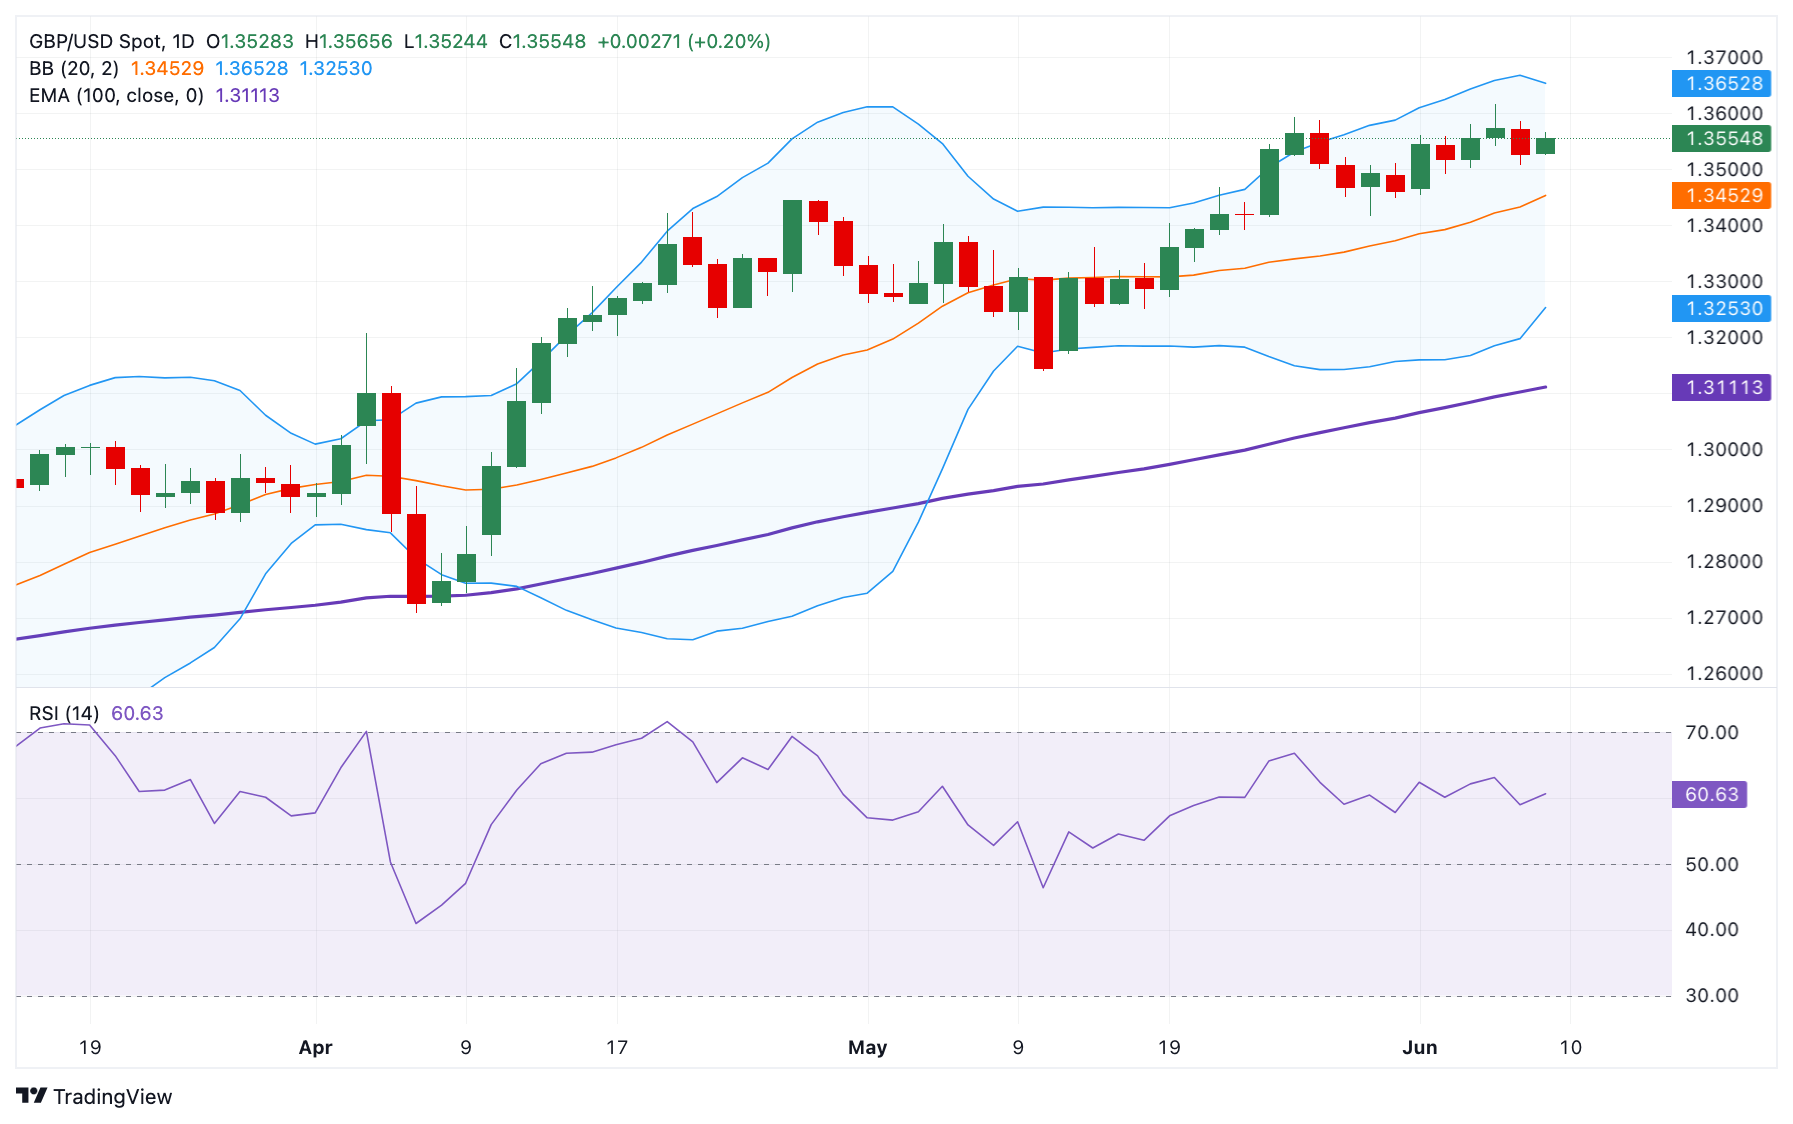
The immediate resistance level emerges at 1.3650; the first support level to watch is 1.3415.
The GBP/USD pair gains traction to around 1.3555 during the early European session on Monday, bolstered by a weaker US Dollar (USD). Trade uncertainty dampens sentiment among US businesses, prompting traders to reassess the Greenback's safe-haven status and act as a tailwind for the major pair. Traders await the UK employment data for fresh impetus, which is due later on Tuesday.
Technically, the constructive outlook of GBP/USD remains in place as the major pair is well-supported above the key 100-day Exponential Moving Average (EMA) on the daily chart. The upward momentum is reinforced by the Relative Strength Index (RSI), which stands above the midline near 60.50, displaying bullish momentum in the near term.
On the bright side, the first upside barrier emerges at 1.3650, the upper boundary of the Bollinger Band. A decisive break above this level could pick up more momentum and aim for 1.3748, the high of January 13, 2022. Further north, the next resistance level is seen at 1.3834, the high of October 20, 2021.
In the bearish case, the low of May 29 at 1.3415 acts as an initial support level for GBP/USD. A breach of this level could drag the major pair toward 1.3250, the lower limit of the Bollinger Band. The additional downside filter to watch is 1.3110, the 100-day EMA.
GBP/USD daily chart
* The content presented above, whether from a third party or not, is considered as general advice only. This article should not be construed as containing investment advice, investment recommendations, an offer of or solicitation for any transactions in financial instruments.


