

EUR/USD Price Forecast: Bearish outlook remains in play near 1.0550, eyes on ECB rate decision

- Gold Price Forecast: Gold Poised to Break $4,200 as Oil Price Slump Eases Inflation Fears
- Gold declines despite easing concerns over inflation, interest rate hikes
- Fed Decision Eve: 104 Economists Expect No Change; Why Is Citadel Securities Betting on a Surprise Hike?
- Gold Price Forecast: Can Gold Hold $4,020 as Fed Rate Hike Expectations Rise?
- Middle East War updates: US-Iran pause strikes as Trump weighs up diplomatic options
- WTI Oil flirts with the $80 level amid speculation about US-Iran peace talks
EUR/USD gains ground to near 1.0560 in Tuesday’s early European session.
The negative view of the pair prevails below the 100-day EMA with a bearish RSI indicator.
The first downside target to watch is 1.0480; the immediate resistance level emerges at 1.0623.
The EUR/USD pair trades in positive territory around 1.0560 during the early European session on Tuesday. However, the upside for the major pair seems limited amid the rising bets for additional reductions by the European Central Bank (ECB) on Thursday.
The ECB is widely expected to announce a 25-basis point (bps) rate cut at its December meeting on Thursday, though an unusual 50 bps reduction remains possible. Market players will monitor ECB President Christine Lagarde’s press conference after the monetary policy meeting as it might offer some hints about future policy direction and the potential timeline for additional rate cuts.
Technically, EUR/USD keeps the bearish vibe on the daily chart as the major pair remains capped below the key 100-day Exponential Moving Average (EMA). Additionally, the downward momentum is supported by the 14-day Relative Strength Index (RSI), which is located below the midline around 45.20, indicating that the path to the least resistance level is to the upside.
The initial support level for the major pair emerges at 1.0480, the low of December 3. Any follow-through selling below the mentioned level could expose the lower limit of the Bollinger Band at 1.0445. Extended losses could push prices lower toward 1.0332, the low of November 22.
On the upside, the first upside barrier is seen near the upper boundary of the Bollinger Band at 1.0623. Sustained bullish momentum could see a rally to 1.0787, the 100-day EMA. Further north, the next hurdle to watch is the 1.0800 psychological level.
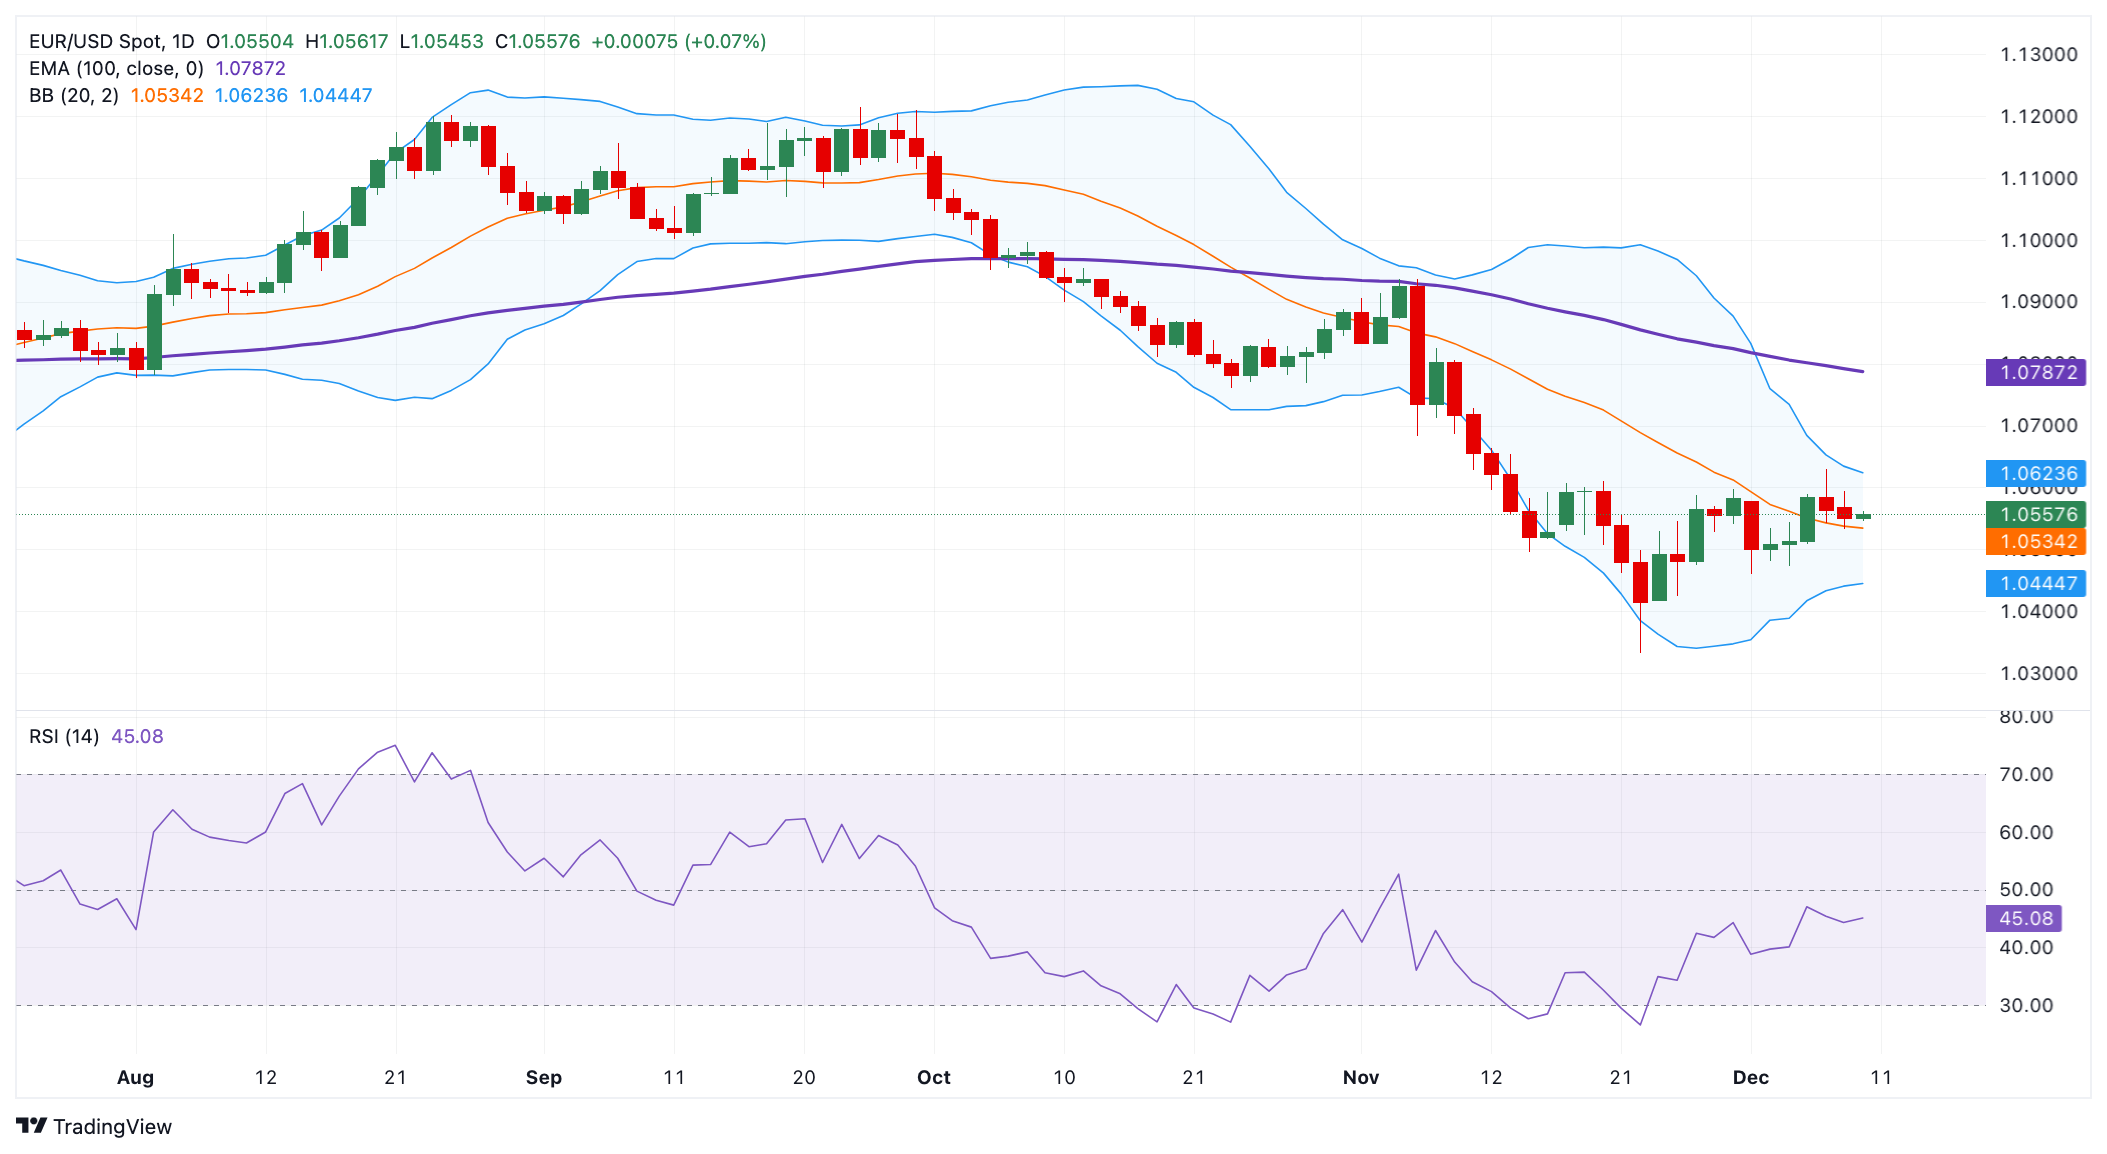
EUR/USD daily chart
Euro FAQs
The Euro is the currency for the 20 European Union countries that belong to the Eurozone. It is the second most heavily traded currency in the world behind the US Dollar. In 2022, it accounted for 31% of all foreign exchange transactions, with an average daily turnover of over $2.2 trillion a day, according to data from the Bank of International Settlements. EUR/USD is the most heavily traded currency pair in the world, accounting for an estimated 30% of all transactions, followed by EUR/JPY (4%), EUR/GBP (3%) and EUR/AUD (2%).
Read more
* The content presented above, whether from a third party or not, is considered as general advice only. This article should not be construed as containing investment advice, investment recommendations, an offer of or solicitation for any transactions in financial instruments.


