Bitcoin Facing Potential Capitulation Amid On-Chain Liquidity Squeeze, Analyst Says

Mitrade
coverImg
Source: Shutterstock

According to a crypto analyst, Bitcoin (BTC) may be heading towards a capitulation due to tightening on-chain liquidity. However, this capitulation could be followed by a “full bull” market.

Bitcoin Headed Lower Before Higher

In a detailed thread on X about BTC price analysis, crypto analyst Cole Garner stated that capitulation might be on the horizon for the leading digital asset. Garner attributes the potential downturn to tightening on-chain liquidity.

Tracking global liquidity from central banks worldwide, the analyst said he sees a “buy signal” for digital assets. However, more downsides for cryptocurrencies could come before liquidity-enhancing measures undertaken by central banks buoy them.

In his analysis, Garner stated that “if China doesn’t ring that bell, the Fed or Japan should do the job,” likely pointing toward the recent economic stimulus injected by the Chinese central bank in a bid to boost the country’s grim economic outlook. 

Garner referenced the recent economic stimulus from China’s central bank but noted that this week, the People’s Bank of China (PBoC) refrained from injecting additional liquidity, tempering expectations for risk-on assets like crypto.

Garner emphasized the low supply of stablecoins compared to the beginning of October 2024.

Analyzing the “Bitfinex grail,” which is essentially the total supply of two leading stablecoins on the exchange – USDT and USDC – Garner noted its quarterly rate of change is declining, potentially leading to lower prices for digital assets in the short term.
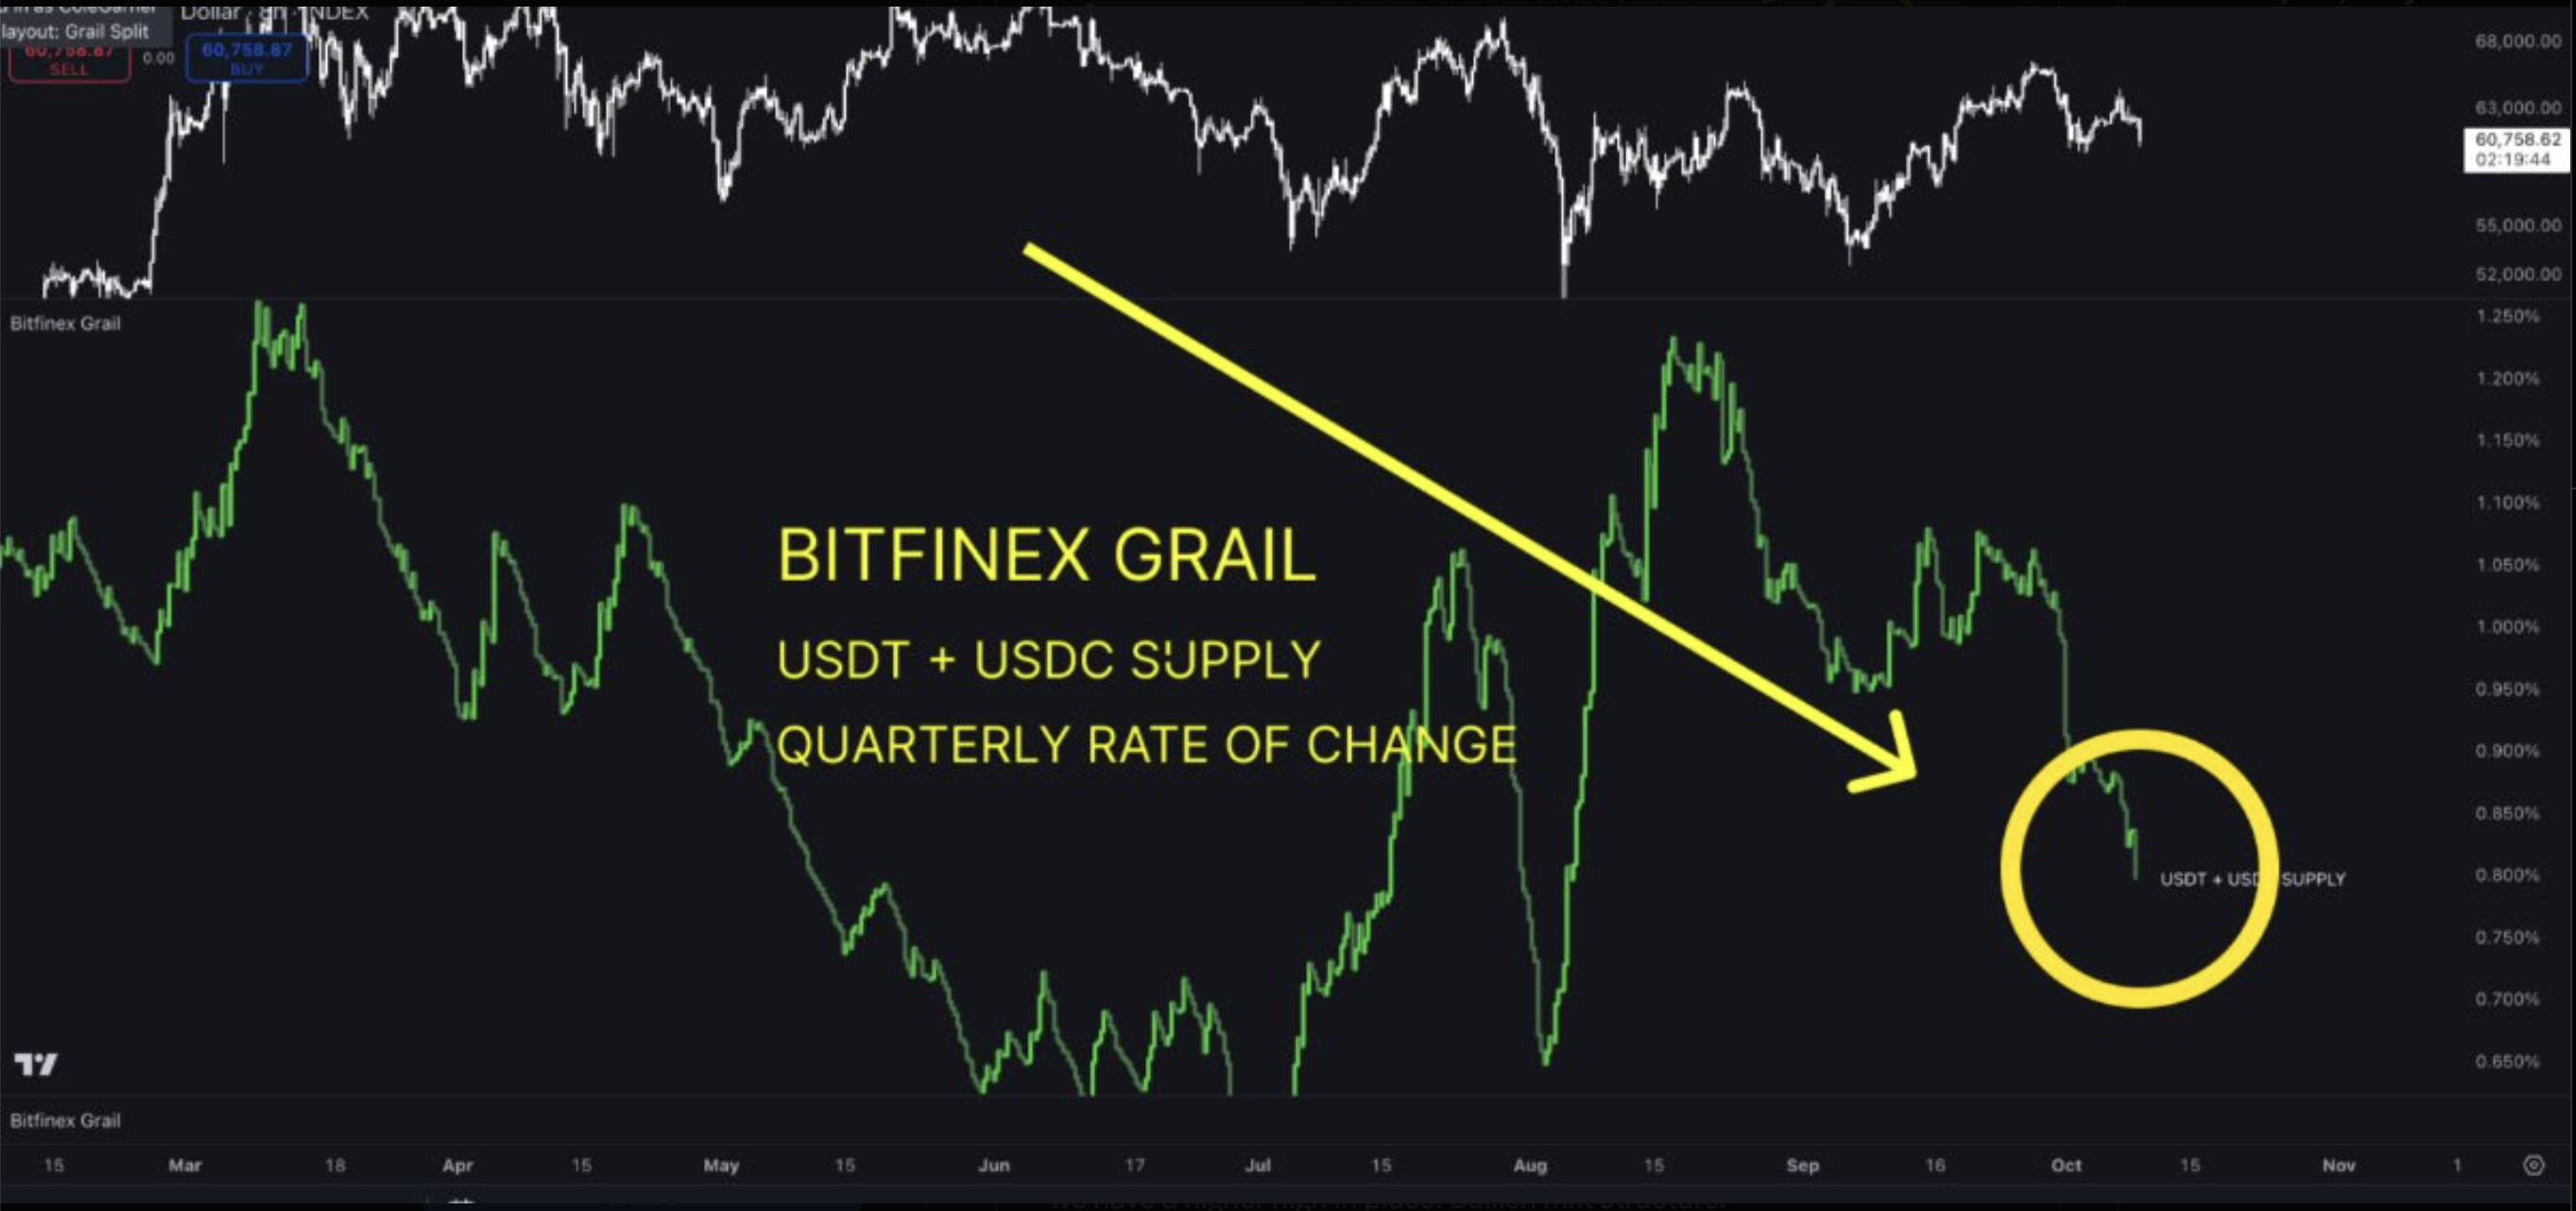
Bitfinex grail

Despite these concerns, Garner pointed out that Bitcoin has printed a higher high on the 8-hour chart, and the market structure remains bullish. Even if BTC dips to its range lows in the high $40k range, the overall price action is still considered positive.
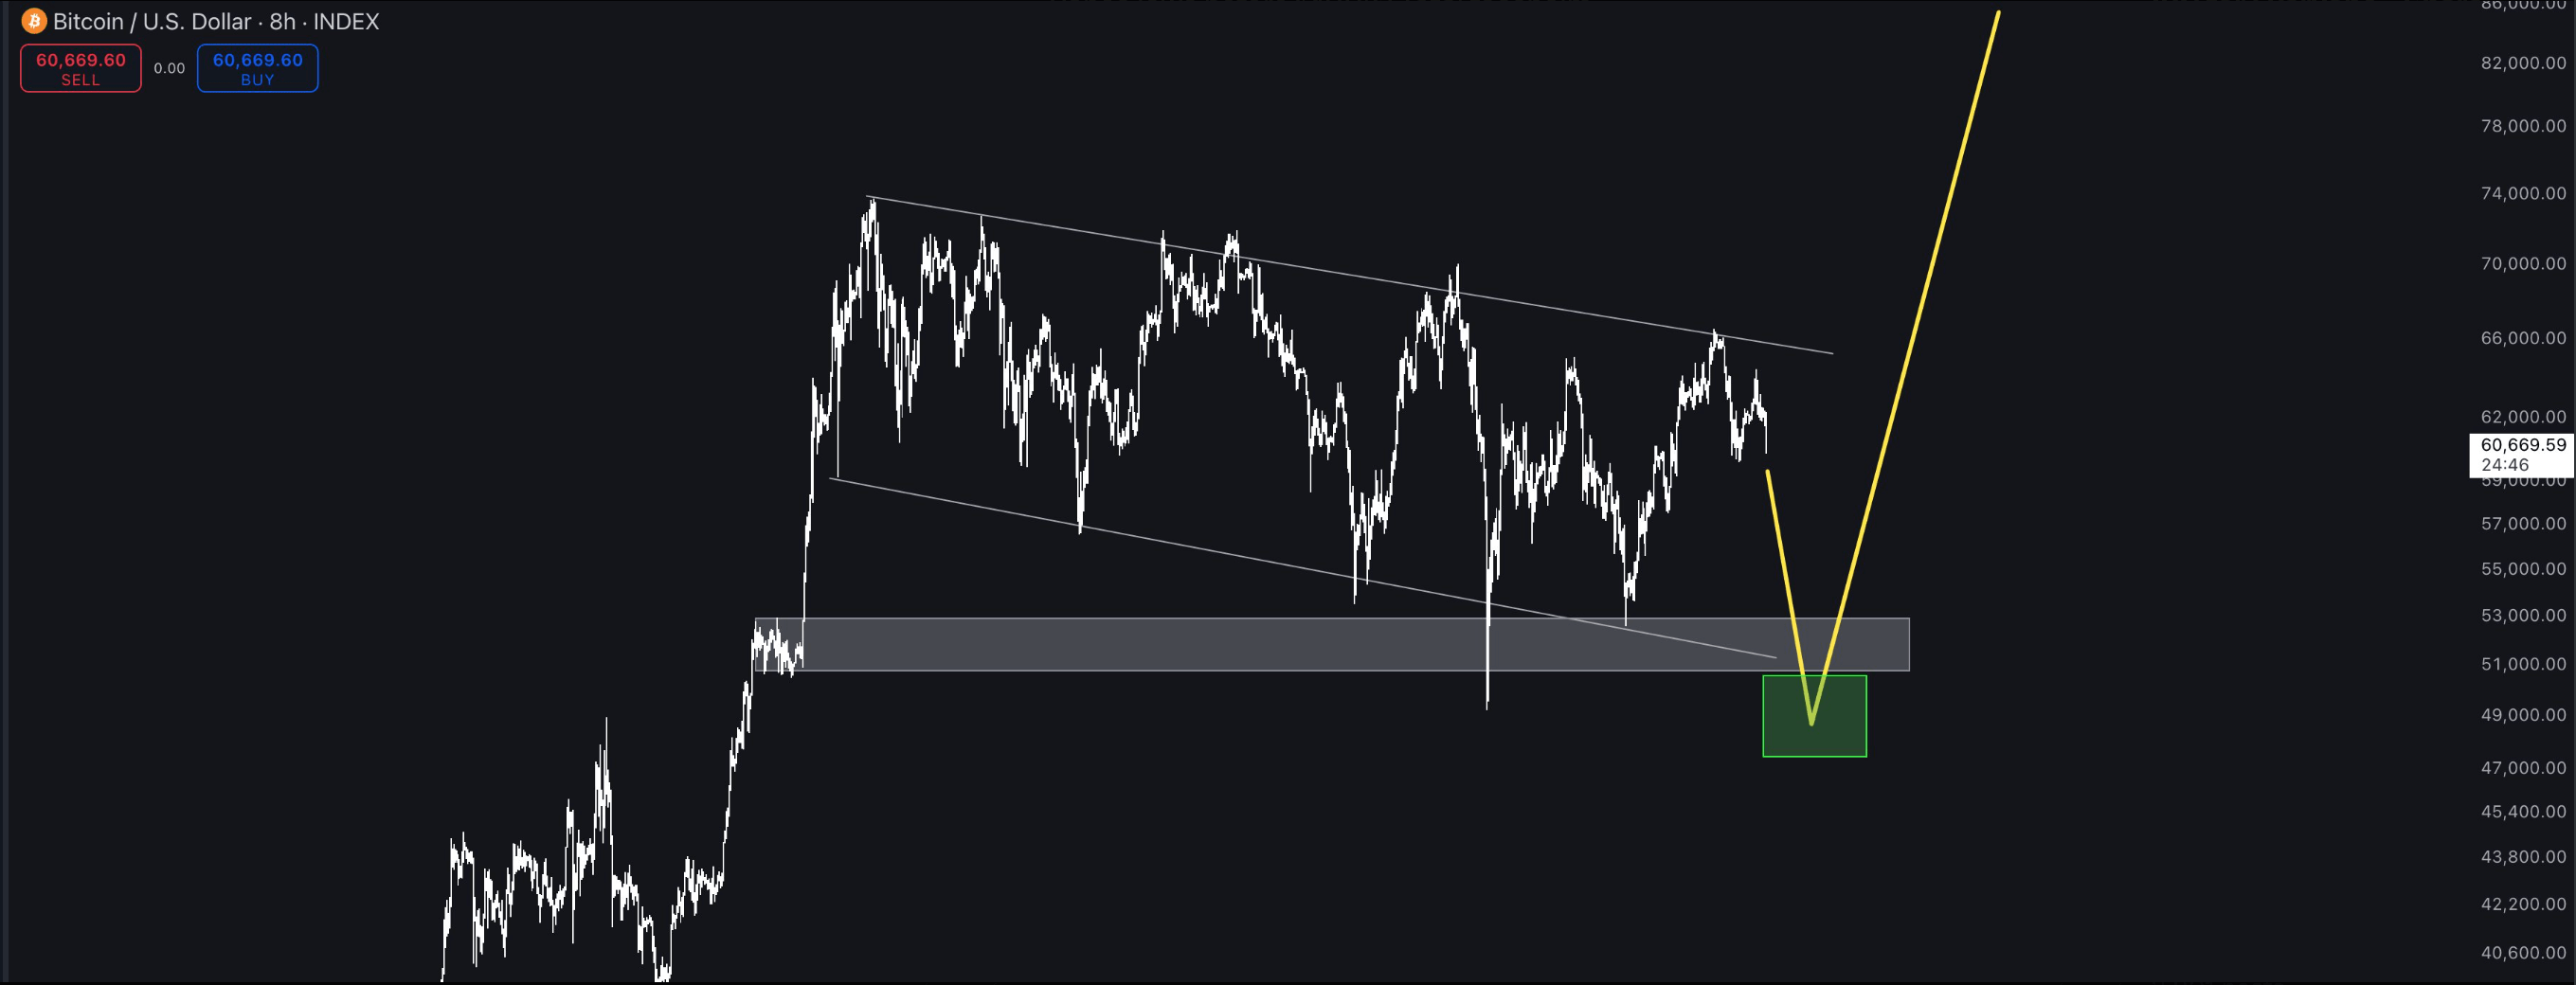
bitcoin price action

Garner suggested that should BTC hit its range of lows, traders and investors can consider buying at that price. Even if they are low on liquid cash, they must ensure they don’t get spooked by the market and panic-sell their current holdings.

Another crypto analyst, Ali, seemed to echo Garner’s outlook, stating that Bitcoin is stuck in a descending parallel channel and runs the risk of sliding to channel lows of around $52,000. The analyst stressed that BTC must overcome the $66,000 level for a bullish breakout.

Can Bitcoin Hit New All-Time Highs In 2024?

With the remainder of 2024 ahead, Bitcoin bulls anticipate interest rate cuts by the US Federal Reserve (Fed) to fuel a new rally. However, BTC must clear several hurdles to sustain its bullish momentum.

Crypto analyst Carl Runefelt recently noted that BTC must overcome the $64,000 resistance level to trigger a rally in Q4 2024. Failure to break through this price level could lead to further downside.

Further, Bitcoin’s price finally turned green in October, giving bulls hopes of another “uptober” for the asset, which was marked by significant price increases. BTC trades at $60,711 at press time, down 2.4% in the last 24 hours.
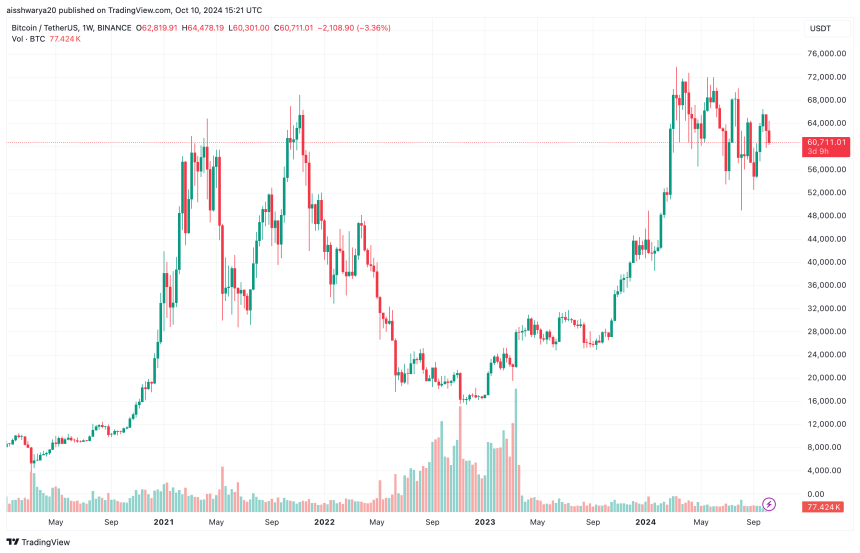
bitcoin

Read more

  • Gold Price Forecast: Gold Tumbles Below $3,900 as Trump Says No Need for Iran Deal; Can October PPI Spur a Rebound?
  • Today’s Market Recap: Nvidia Drops Over 4% After Jensen Huang Resigns, AMD and Broadcom Both Rise Over 5%
  • * The content presented above, whether from a third party or not, is considered as general advice only.  This article should not be construed as containing investment advice, investment recommendations, an offer of or solicitation for any transactions in financial instruments.

    goTop
    quote
    Related Articles
    placeholder
    Bitcoin lost its 200-day average — but the exit started three sessions before the CPIBitcoin fell 2.5% to about $73,400 on 11 November, an 11-week low, breaking its 200-day moving average near $73,100. The 24-hour liquidation tally reached $632 to $705 million, roughly 82% of it longs. But spot ETF outflows began three sessions earlier and USDT's market cap has shrunk $6.6 billion in 60 days — the leveraged length left before the inflation print did. A double top at 81,890 and 81,080 leaves a measured target of 69,366.
    Author  Suzie
    Nov 11, Wed
    Bitcoin fell 2.5% to about $73,400 on 11 November, an 11-week low, breaking its 200-day moving average near $73,100. The 24-hour liquidation tally reached $632 to $705 million, roughly 82% of it longs. But spot ETF outflows began three sessions earlier and USDT's market cap has shrunk $6.6 billion in 60 days — the leveraged length left before the inflation print did. A double top at 81,890 and 81,080 leaves a measured target of 69,366.
    placeholder
    Bitcoin ETFs sold $1.28 billion in a week — and BTC is still above 75,000US spot Bitcoin ETFs logged $1.28 billion of net outflows in the week to Nov 6, the largest since late June, with BlackRock's IBIT accounting for $1.21 billion. Yet BTC only fell from $80,405 to $74,940, a 6.8% move. The gap between the fund flow and the price is the story: leveraged longs were flushed, but spot holders did not follow the ETFs out — and $75,000 is the line that decides whether that reading holds.
    Author  Suzie
    Nov 09, Mon
    US spot Bitcoin ETFs logged $1.28 billion of net outflows in the week to Nov 6, the largest since late June, with BlackRock's IBIT accounting for $1.21 billion. Yet BTC only fell from $80,405 to $74,940, a 6.8% move. The gap between the fund flow and the price is the story: leveraged longs were flushed, but spot holders did not follow the ETFs out — and $75,000 is the line that decides whether that reading holds.
    placeholder
    Binance replaced 95% of a $6.3bn hole — Bitcoin is trading the plumbing, not the coinBinance resumed withdrawals on November 1 after a record $6.3bn theft. In the first 9.5 hours, users withdrew $4.64bn and deposited $1.01bn, a net outflow of $3.64bn, or 2.1% of assets. Bitcoin fell to 76,173 and is now 78,473. The market is pricing the exchange, not the supply.
    Author  Suzie
    Nov 02, Mon
    Binance resumed withdrawals on November 1 after a record $6.3bn theft. In the first 9.5 hours, users withdrew $4.64bn and deposited $1.01bn, a net outflow of $3.64bn, or 2.1% of assets. Bitcoin fell to 76,173 and is now 78,473. The market is pricing the exchange, not the supply.
    placeholder
    Bitcoin is back above $80,000 — but 75% of the bounce was shorts, not buyersBitcoin trades at $80,669, back above the $80,000 line after touching $79,145 on October 24. But 75.4% of the last 24 hours of futures liquidations were shorts, CME open interest fell 36,545 BTC in October, and spot ETFs lost $773.5 million on October 22-23. Price is up; positioning is down. Here is why the bounce is a squeeze, and the four things that would make it real.
    Author  Suzie
    Oct 28, Wed
    Bitcoin trades at $80,669, back above the $80,000 line after touching $79,145 on October 24. But 75.4% of the last 24 hours of futures liquidations were shorts, CME open interest fell 36,545 BTC in October, and spot ETFs lost $773.5 million on October 22-23. Price is up; positioning is down. Here is why the bounce is a squeeze, and the four things that would make it real.
    placeholder
    Bitcoin's double top at $88,000: why $78,000 is the line that decides the next moveBitcoin trades near $82,500 (+0.47%) after twice failing at the $88,000 area, forming a potential double top with a neckline at $78,000. A break below the neckline would project a measured target near $68,200; a close back above $88,000 would invalidate the pattern. Here are the structure, the levels and what would confirm either side.
    Author  Suzie
    Oct 19, Mon
    Bitcoin trades near $82,500 (+0.47%) after twice failing at the $88,000 area, forming a potential double top with a neckline at $78,000. A break below the neckline would project a measured target near $68,200; a close back above $88,000 would invalidate the pattern. Here are the structure, the levels and what would confirm either side.
    Live Quotes
    Name / SymbolChart% Change / Price
    BTCUSD
    BTCUSD
    0.00%0.00
    ETHUSD
    ETHUSD
    0.00%0.00
    DOGEUSD
    DOGEUSD
    0.00%0.00
    SOLUSD
    SOLUSD
    0.00%0.00
    BCHUSD
    BCHUSD
    0.00%0.00
    AAVEUSD
    AAVEUSD
    0.00%0.00

    Bitcoin Related Articles

    • Bitcoin Leverage And Margin Trading in 2026: The Ultimate Beginner's Guide
    • Gold vs Bitcoin 2026: Which Is the Better Investment?Best Hedge Asset Comparison
    • Best Strategies When BTC Price Drops: From Hedging to Accumulating
    • How to Day Trade Crypto? Simplest Day Trading Strategy Ever
    • Bitcoin Price Prediction 2026-2030: Long-Term Outlook Driven by Data & Macro Cycles
    • Bitcoin Mining Beginner Guide: What Is Bitcoin Mining and How to Mine Bitcoin?

    Click to view more