
Bitcoin Price Forecast: BTC holds just below $109,000 after record weekly close


Bitcoin price edges slightly below $109,000 on Monday after recording its highest weekly close in history.
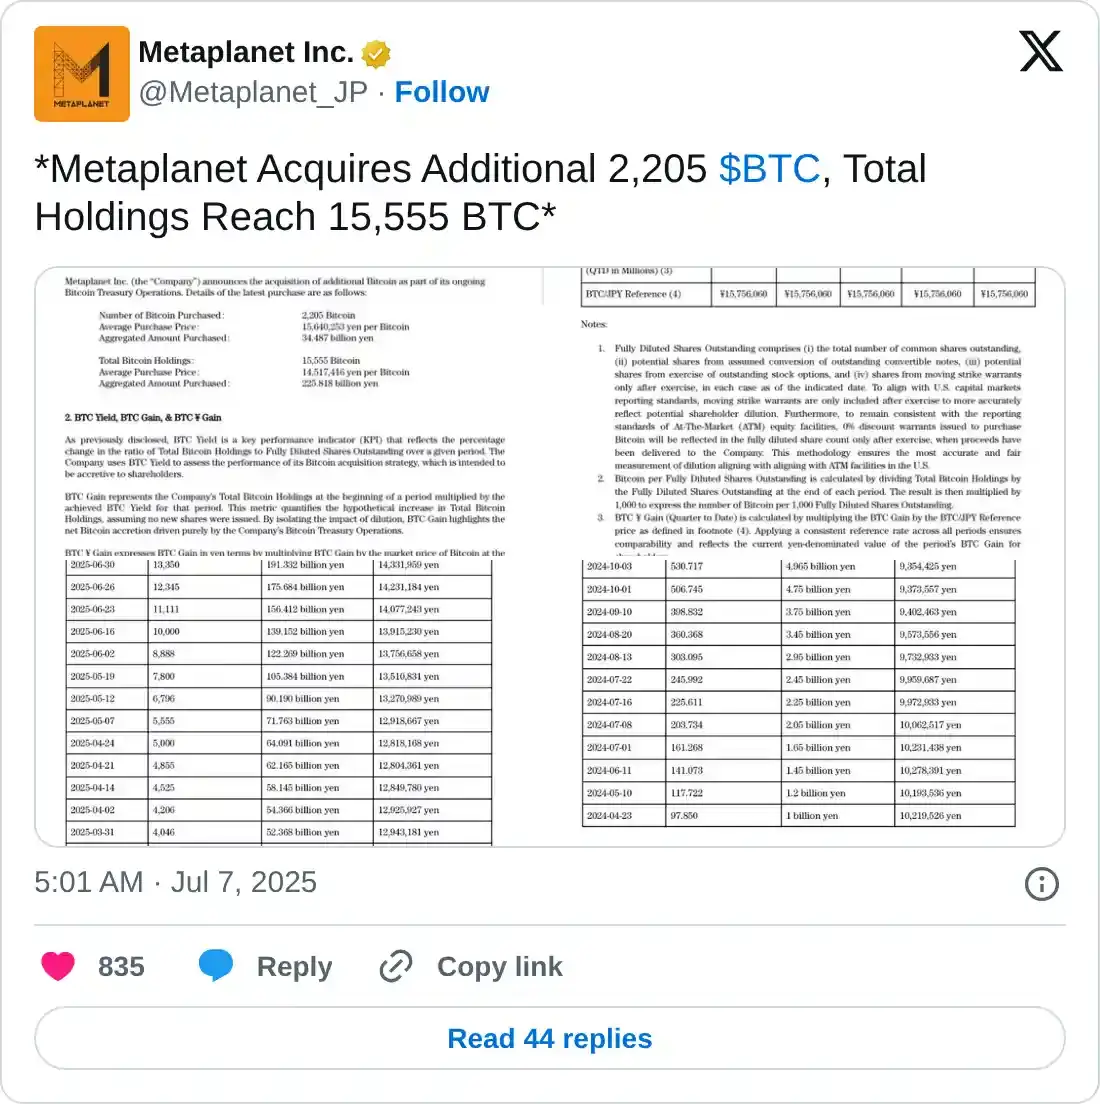
Corporate and institutional demand remains robust as Metaplanet adds 2,205 BTC, and spot Bitcoin ETFs recorded $769.60 million inflows last week.
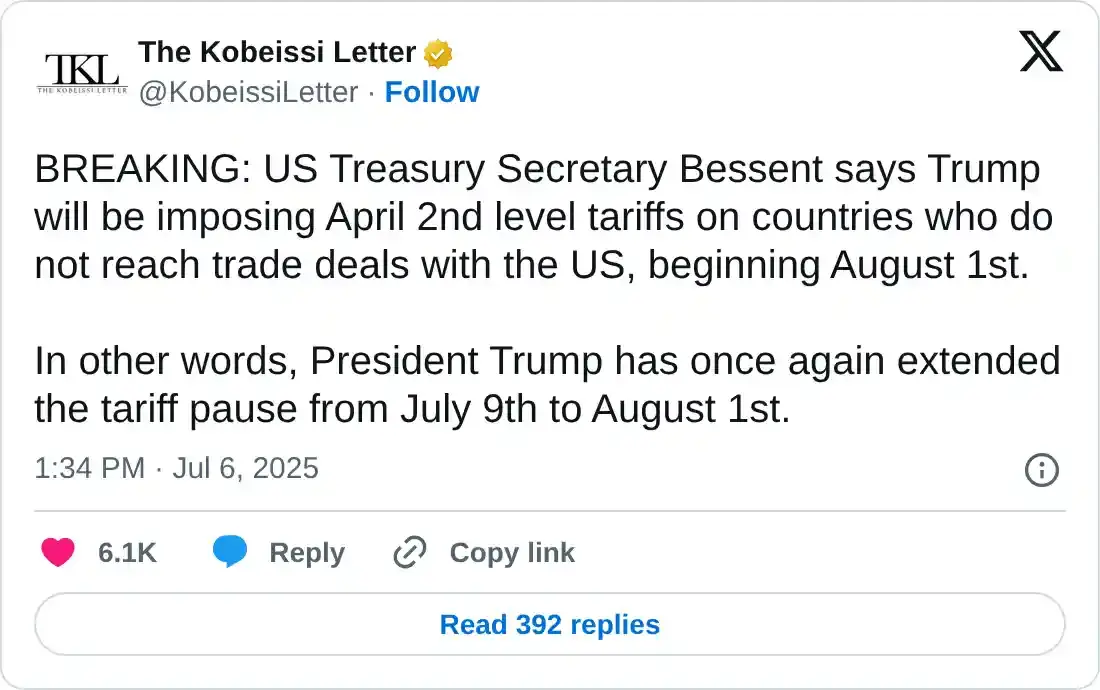
Markets will look at trade headlines this week, with reports indicating that the Trump administration could extend the tariff pause to August 1.
Bitcoin (BTC) edges slightly below $109,000 at the time of writing on Monday after registering its highest weekly close in history. Institutional and corporate demand remains a key driver, with Metaplanet adding 2,205 BTC on Monday and US-listed spot Bitcoin Exchange Traded Funds (ETFs) recording over $769 million in inflows last week.
As traders digest the latest bullish signals, attention now turns to macroeconomic developments, including fresh trade headlines and reports that the US President Donald Trump administration could extend the tariff pause to August 1.
Bitcoin institutional and corporate demand remains robust
Bitcoin recorded its highest weekly close in the first week of July, closing at 109,203 on Sunday. The rising institutional demand for BTC fueled this historical level. SoSoValue data show that spot Bitcoin ETFs recorded a total of $769.60 million in inflows last week, marking the fourth consecutive weekly increase since mid-June. If the inflow continues and intensifies this week, BTC could reach or even surpass its all-time highs.
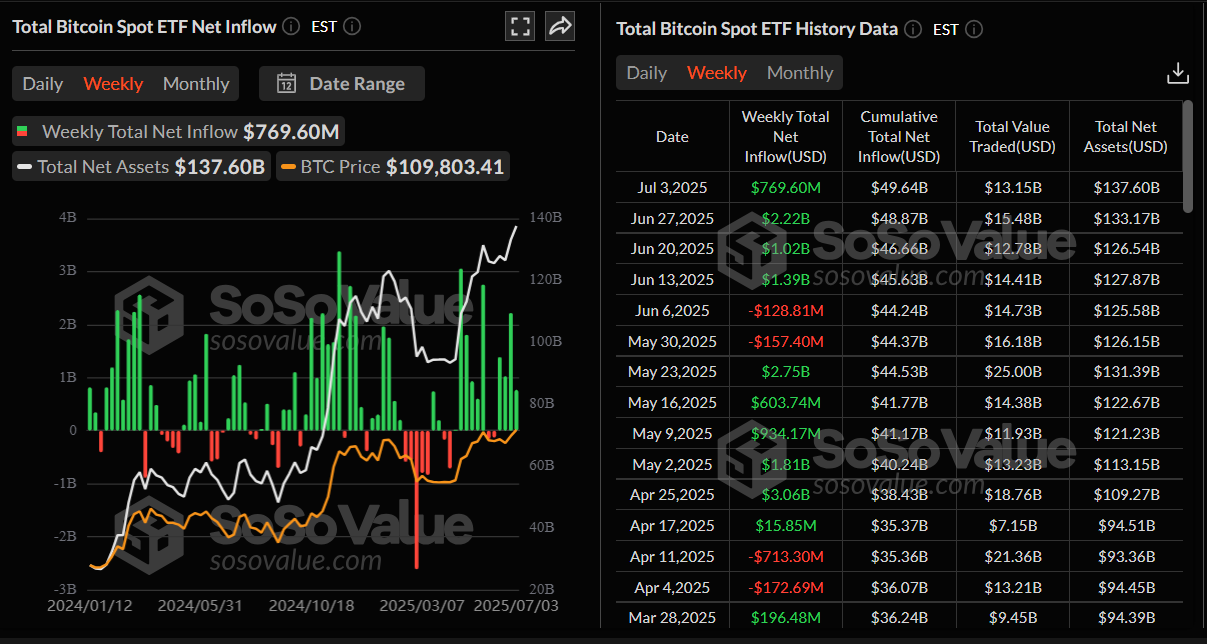
Total Bitcoin spot ETF net inflow weekly chart. Source: SoSoValue
Apart from continuous demand from institutional investors, the corporate company demand for BTC also remains robust. Japanese investment firm Metaplanet announced on Monday that it has purchased an additional 2,205 BTC, bringing the total holding to 15,555 BTC. On the same day, the Blockchain Group confirmed the acquisition of 116 BTC, bringing its total holdings to 1,904 BTC.
The Trump administration could extend the tariff pause to August 1
Markets turn risk-averse at the beginning of the week as investors assess the latest headlines surrounding the US tariff regime.
The Kobeissi Letter reported on Sunday that US Treasury Secretary Scott Bessent stated that President Trump will impose April 2 level tariffs on countries that do not reach trade deals with the US, beginning August 1. Simply put, Trump could extend the tariff pause from July 9 to August 1.
This news could offer a mixed bag for riskier assets such as Bitcoin. The extension of the tariff deadline is likely to postpone the immediate downside risk, but it will also prolong uncertainty.
Moreover, last week’s US macroeconomic data showed that the Nonfarm Payrolls rose by 147,000 in June, against expectations of a 110,000 increase and the 144,000 seen in May. The Unemployment Rate also unexpectedly dropped to 4.1% last month, compared to the expected 4.3% and May’s 4.2%. This data, as of now, has squashed hopes for aggressive Federal Reserve (Fed) easing and a cautious stance for an interest rate cut.
Meanwhile, traders remain expectant of the Minutes of the Fed’s June meeting, set to be released on Wednesday, for more clarity on the timing of the next interest rate cut.
Elon Musk’s America Party embraces Bitcoin
Elon Musk has announced that his new political group, called the America Party, will support Bitcoin. When asked on the social media platform X if the American Party will embrace Bitcoin, Musk replied, “Fiat is hopeless, so yes.”

Bitcoin Price Forecast: Will BTC refresh its record highs?
Bitcoin price rebounded on Sunday after retesting the upper boundary of a previously broken consolidation zone at $108,355. At the time of writing on Monday, BTC hovers at around $109,000.
If BTC continues its upward momentum, it could extend the rally toward the May 22 all-time high at $111,980.
The Relative Strength Index (RSI) on the daily chart reads 57, above its neutral level of 50, indicating bullish momentum. The Moving Average Convergence Divergence (MACD) on the daily chart displayed a bullish crossover. It also shows rising green histogram bars above its neutral level, suggesting bullish momentum and indicating an upward trend.
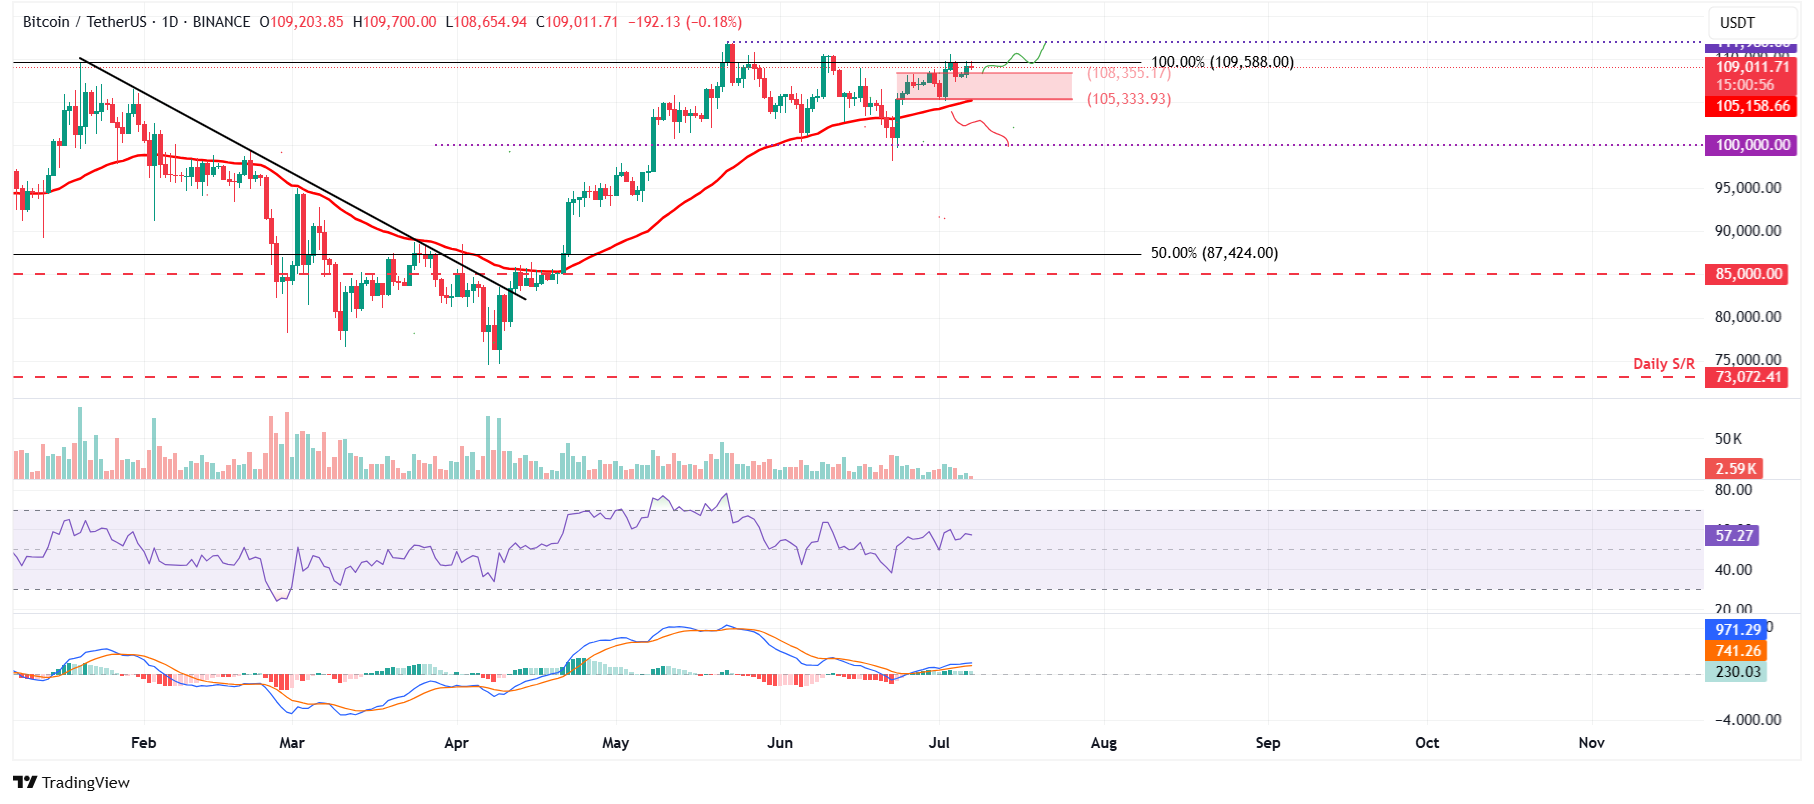
BTC/USDT daily chart
However, if BTC faces a correction and closes below its support at $108,355, it could extend the decline to retest the lower boundary of the consolidation zone at $105,333, which roughly coincides with with the 50-day Exponential Moving Average (EMA) at $105,158, making this a key support zone for BTC.
* The content presented above, whether from a third party or not, is considered as general advice only. This article should not be construed as containing investment advice, investment recommendations, an offer of or solicitation for any transactions in financial instruments.


