


Berkshire Hathaway Shares Just Rallied to Their Highest Level Since Warren Buffett Announced He Would Step Down as CEO, Closing Within 1.5% of Their All-Time High. Does That Rally Validate His Succession Plan?
Key Points
Berkshire Hathaway fell after Warren Buffett announced he would be stepping down as CEO.
Warren Buffett has fully stepped away from Berkshire Hathaway, and the stock is now back near all-time highs.
- Motley Fool Issues Rare "Total Conviction" Buy Alert ›
Warren Buffett essentially built Berkshire Hathaway (NYSE: BRKA)(NYSE: BRKB) into the company it is today, transforming it from a struggling shirt maker into a massive and highly successful conglomerate. But one of the biggest changes in the company's history took place at the end of 2025, when Buffett handed over the CEO position to hand-picked successor Greg Abel.
Wall Street's perception of the stock has changed over the roughly 10 months since that leadership transition, and it looks like investors think the business is more important than who runs it. Here's why the stock, after an initial pullback, is back near all-time highs.
Missed AI’s "Act 1"? Act 2 Could Be 15x Bigger. Most investors think they missed the AI boat because they didn't buy Nvidia in 2005. But according to our analysts, we’re only at the end of "Act 1"—the R&D phase. "Act 2" is the global rollout. Continue »
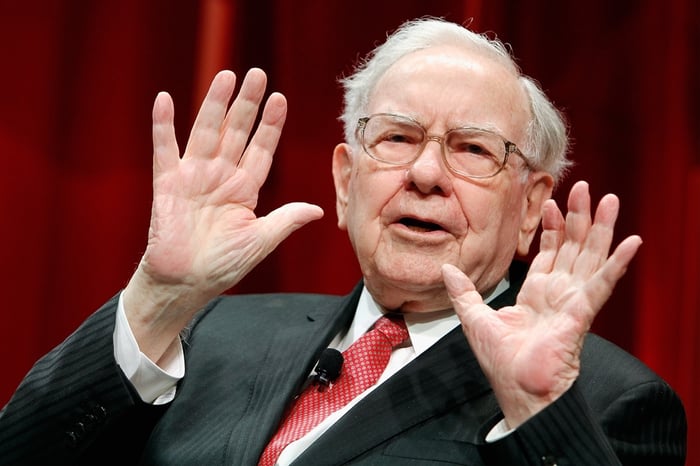
Image source: Getty Images.
The Buffett premium wasn't as large as expected
Given Warren Buffett's incredible investment success, many on Wall Street believed Berkshire Hathaway was awarded a premium price just because he was CEO. When he announced his retirement, the stock sold off. But the drop was fairly modest. In fact, over the past year, the 52-week low was less than 10% below the 52-week high.
The simple takeaway from this, with the stock now back within two percentage points of its 52-week and all-time highs, is that Buffett's succession plan has worked out as hoped. But the truth is, Greg Abel really hasn't had enough time at the helm to prove that. To be fair, he's made business decisions that suggest he's likely to fare well at the helm of Berkshire Hathaway, such as investing opportunistically in the struggling housing sector. But 10 months or so isn't really a particularly long time.
What's more likely behind the stock's recovery toward all-time highs is that Abel has proven he is unlikely to destroy what Buffett built. And that means that the business's fundamentals can shine through. Right now, as investors grow increasingly worried about the artificial intelligence bubble bursting, Berkshire Hathaway's diversified collection of fairly mundane, reliable, cash-flow-generating businesses looks pretty attractive. Insurance, utilities, energy, transportation, housing, retail, and manufacturing are just some of the sectors in which the company operates.
There's a safety valve that looks increasingly important, too
But there's another aspect of Berkshire Hathaway that is likely to be attracting investors as well: cash. At the end of the second quarter, the company had more than $350 billion in cash on its balance sheet. If there's a bear market, that cash will act as a buffer. And it will allow Abel to step in and buy while others sell, just as his predecessor liked to do.
While Berkshire Hathaway's recovery toward all-time highs is nice to see, it probably isn't a statement about the leadership transition. It is more likely a reflection of the market recognizing the value of the company's reliable, diversified business and its cash position amid rising investor concern about the broader market. It will be a few years before the success of the CEO transition can really be judged.
Should you buy stock in Berkshire Hathaway right now?
Before you buy stock in Berkshire Hathaway, consider this:
The Motley Fool Stock Advisor analyst team just identified what they believe are the 10 best stocks for investors to buy now… and Berkshire Hathaway wasn’t one of them. The 10 stocks that made the cut could produce monster returns in the coming years.
Consider when Netflix made this list on December 17, 2004... if you invested $1,000 at the time of our recommendation, you’d have $334,793!* Or when Nvidia made this list on April 15, 2005... if you invested $1,000 at the time of our recommendation, you’d have $1,257,420!*
Now, it’s worth noting Stock Advisor’s total average return is 874% — a market-crushing outperformance compared to 209% for the S&P 500. Don't miss the latest top 10 list, available with Stock Advisor, and join an investing community built by individual investors for individual investors.
See the 10 stocks »
*Stock Advisor returns as of October 31, 2026.
Reuben Gregg Brewer has no position in any of the stocks mentioned. The Motley Fool has positions in and recommends Berkshire Hathaway. The Motley Fool has a disclosure policy.
Recommended Articles


