


History Says Energy Beat Every Sector in the Last Bear Market. Here's the Catch if Another One Is Coming.
Key Points
During the last bear market in 2022, the S&P 500 index fell nearly 25%.
In 2022, the average energy stock rose 55%.
Here's why history isn't likely to repeat this time around if there's a new bear market.
- 10 stocks we like better than Vanguard World Fund - Vanguard Energy ETF ›
Most investors know that past performance doesn't guarantee future results. After all, that's what every financial services company has to put in their advertisements. But the past is all we have to go on, so it is still important to look at past performance. If you are worried about a bear market, the last example was in 2022. Don't get too enamored with the energy sector, which was a massive standout in that downturn.
Here's why the energy sector outperformed in 2022 and why it may not do that again if there's a bear market in 2026 or 2027. The real story boils down to what was happening in the energy sector before that last bear market. As you look at the sector today, as the bull market continues in 2026, things are very different.
Missed AI’s "Act 1"? Act 2 Could Be 15x Bigger. Most investors think they missed the AI boat because they didn't buy Nvidia in 2005. But according to our analysts, we’re only at the end of "Act 1"—the R&D phase. "Act 2" is the global rollout. Continue »

Image source: Getty Images.
What happened last time?
During the 2022 bear market, Vanguard S&P 500 ETF (NYSEMKT: VOO) fell by as much as 24% at one point. It ended the year down roughly 19%. It was not a good year. By contrast, Vanguard Energy ETF (NYSEMKT: VDE) rose 55% for the year, hitting a high point of nearly 70%. If you based the future on that past, you'd run out and buy Vanguard Energy ETF if you were worried about a bear market.
There are some caveats here, however. First, if you look closely at the graph below, you'll see that Vanguard Energy ETF had a sizable dip during the year. It recovered from that drop, but the decline was actually more than 25%. That means if you had bought and sold at the wrong times during the year, perhaps driven by the powerful emotions a bear market can evoke, owning Vanguard Energy ETF could have been a worse decision than owning an exchange-traded fund that tracks the S&P 500 index.
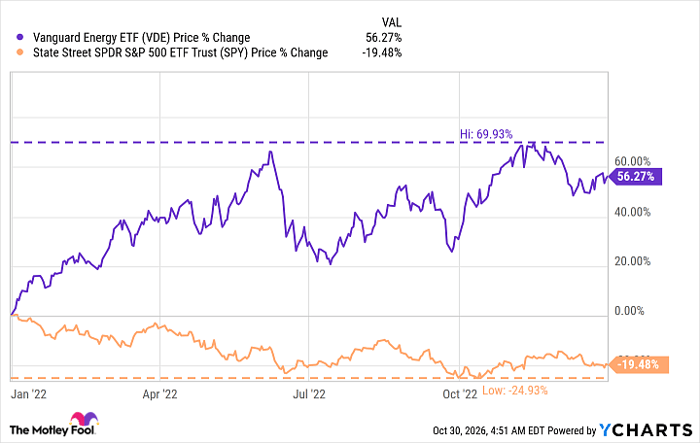
VDE data by YCharts
The bigger problem was the lead-up to 2022
The real risk you face in buying into the energy sector today, however, is where it is in the energy cycle. Oil prices are known for being highly volatile, swinging from low to high levels in dramatic, sometimes rapid, fashion. Before the sector's strong performance in 2022, energy had been mired in a multi-year downturn and was still recovering from that drop. The nadir of that decline came during the coronavirus pandemic, when oil prices fell drastically amid global economic shutdowns.
So, when the 2022 bear market began, the energy sector was still recovering from prior declines. That simply isn't the case right now, with oil prices at lofty levels thanks to the geopolitical conflict still raging in the Middle East. So the energy sector today is trading at a high point, just like the broader market. That's not a good place to start if investors sell stocks indiscriminately in a bear market.
Context matters, and this time around could be very different
When you add context to the energy sector's outperformance during the last bear market, the entire story changes. And when you compare that bear market to the situation today, you may actually decide that you want to avoid the energy sector. The sector's roughly 25% temporary drop in 2022, despite the strong full-year performance, is a warning sign of what could happen if a bear market drives oil prices lower from their currently elevated levels.
All of that said, energy is an important sector, given that oil is vital to the functioning of the global economy. Most investors should have some exposure. But it probably isn't a great idea to think of the energy sector as a safe haven if there's a bear market on the near-term horizon.
Should you buy stock in Vanguard World Fund - Vanguard Energy ETF right now?
Before you buy stock in Vanguard World Fund - Vanguard Energy ETF, consider this:
The Motley Fool Stock Advisor analyst team just identified what they believe are the 10 best stocks for investors to buy now… and Vanguard World Fund - Vanguard Energy ETF wasn’t one of them. The 10 stocks that made the cut could produce monster returns in the coming years.
Consider when Netflix made this list on December 17, 2004... if you invested $1,000 at the time of our recommendation, you’d have $334,793!* Or when Nvidia made this list on April 15, 2005... if you invested $1,000 at the time of our recommendation, you’d have $1,257,420!*
Now, it’s worth noting Stock Advisor’s total average return is 874% — a market-crushing outperformance compared to 209% for the S&P 500. Don't miss the latest top 10 list, available with Stock Advisor, and join an investing community built by individual investors for individual investors.
See the 10 stocks »
*Stock Advisor returns as of October 31, 2026.
Reuben Gregg Brewer has no position in any of the stocks mentioned. The Motley Fool has positions in and recommends Vanguard S&P 500 ETF. The Motley Fool has a disclosure policy.
Recommended Articles


