

Bitcoin (BTCUSD) Suddenly Goes down 1.09% on Oct 30: What's Driving This

Source Tradingkey

Bitcoin (BTCUSD) is down 1.09% at Oct 30 20:00(ET), now at $77961.89, with a 7-day down of 4.19%.
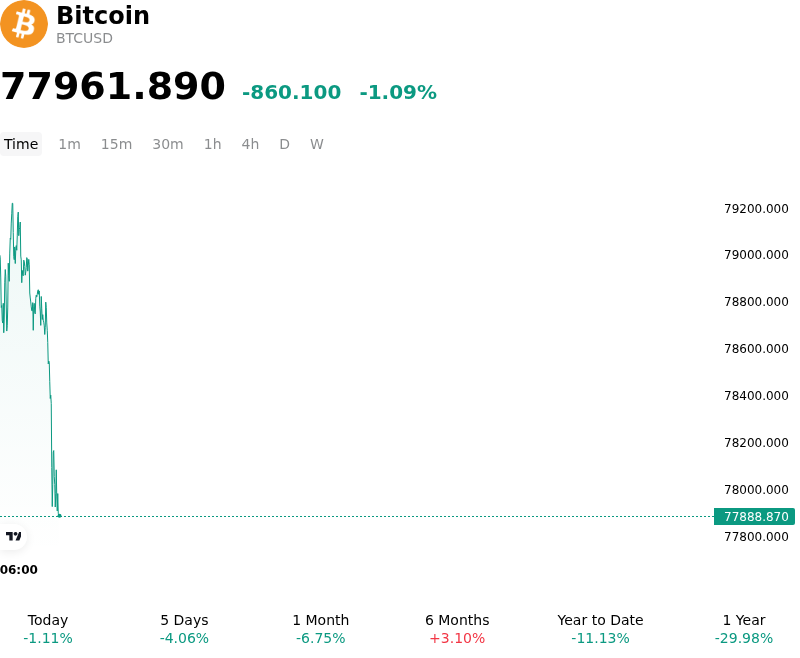
SummaryOverview

What is driving Bitcoin (BTCUSD)’s stock price down today?

Bitcoin experienced downside pressure as restrictive macroeconomic conditions and derivative positioning converged to weigh on institutional risk appetite. A primary headwind stems from the broader monetary environment, where elevated long-term US Treasury yields continue to tighten global liquidity and increase real borrowing costs. The Federal Reserve's cautious policy stance, highlighted by a hawkish interest rate pause with internal dissents favoring further tightening, reinforced expectations that real interest rates will remain restrictive for an extended period. This macroeconomic backdrop elevates the opportunity cost of holding non-yielding speculative assets, dampening capital deployment across digital asset markets.

From a market structure perspective, short-term liquidity dynamics were heavily influenced by the end-of-month options expiry on major derivatives exchanges. Substantial options contract settlements forced market makers to adjust delta-hedging exposures in the spot market, exerting downward pressure as prices gravitated toward key derivative concentration levels. The clustering of open interest around lower max-pain strikes encouraged tactical de-risking among leveraged traders and market participants heading into the settlement window.

Underlying spot demand and institutional capital flows also demonstrated persistent weakness, limiting upside momentum. On-chain metrics reveal subdued spot demand alongside a negative Coinbase Premium, signaling a noticeable pullback in buying interest from US institutional investors relative to offshore venues. While spot Bitcoin ETFs recorded modest net inflows following earlier redemptions, overall institutional participation remains cautious rather than expansionary. Investors continue to monitor incoming economic data and monetary policy expectations, keeping risk sentiment restrained across the digital asset ecosystem.

Technical Analysis of Bitcoin (BTCUSD)

Technically, Bitcoin (BTCUSD) shows a MACD (12,26,9) value of -839.555, indicating a sell signal. The RSI at 36.404 suggests neutral condition and the Williams %R at 99.139 suggests oversold condition. Please monitor closely.
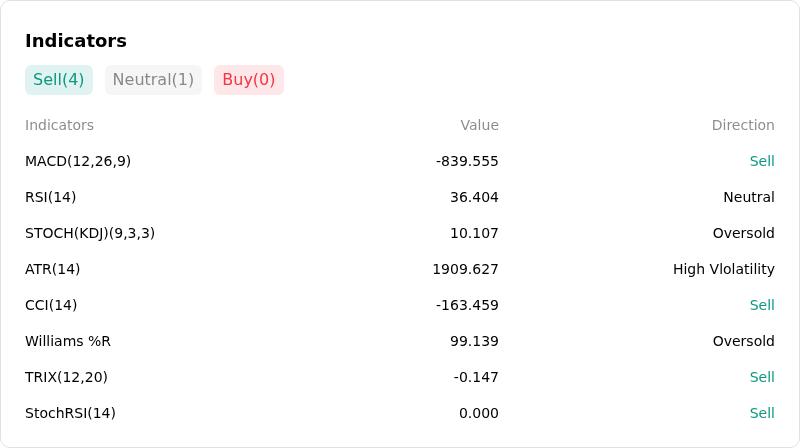
IndicatorAnalysis

More details about Bitcoin (BTCUSD)

Recent Events and Risks:

  • Massive Leveraged Long Liquidations and Fragile Open Interest: Over $300 million to $400 million in leveraged long positions were forcibly liquidated across cryptocurrency exchanges as Bitcoin breached local support levels, while elevated futures open interest creates a high-risk setup for automated liquidation cascades if selling pressure resumes.
  • Heavy Spot ETF Outflows and Reduced Institutional Buying: U.S. spot Bitcoin ETFs recorded a steep reversal with net single-day outflows exceeding $635 million—led by heavy redemptions in BlackRock's IBIT and Fidelity's FBTC—signaling that institutional market participants are de-risking rather than absorbing spot liquidity.
  • Macroeconomic Headwinds and Pre-Fed Risk Off Sentiment: Persistent inflation concerns, volatile bond yields, and caution surrounding upcoming Federal Reserve monetary policy announcements are triggering cross-asset risk reduction, leading traditional macro traders to scale back digital asset exposure.
  • Bearish Derivatives Skew and Put Option Volatility Demand: Short-term derivatives indicators reveal a pronounced downside bias, with the 25-delta options skew reflecting significantly higher implied volatility for put options relative to calls, demonstrating aggressive hedging against further downside breakdown.
Disclaimer: For information purposes only. Past performance is not indicative of future results.
placeholder
Tesla jumps 5% as Barclays puts a $450 target on the SpaceX merger — the chart was already pointing to 431Tesla closed at $391.62 on October 26, up 5.21%, after Barclays upgraded the stock to Overweight and lifted its target to $450 from $370, citing a sharp inflection in Robotaxi miles and a potential SpaceX merger. The move also completed a double bottom at $345.88 and $349.33, with a neckline at $388.56 and a measured target of $431.24. Here is what the upgrade actually says, why the chart and the analyst now point the same way, and what would break the target.
Author  Irene Q.
Oct 27, Tue
Tesla closed at $391.62 on October 26, up 5.21%, after Barclays upgraded the stock to Overweight and lifted its target to $450 from $370, citing a sharp inflection in Robotaxi miles and a potential SpaceX merger. The move also completed a double bottom at $345.88 and $349.33, with a neckline at $388.56 and a measured target of $431.24. Here is what the upgrade actually says, why the chart and the analyst now point the same way, and what would break the target.
placeholder
Anthropic files for a $2 trillion IPO — the $80.7 billion loss is the decoy, the $450 billion compute bill is the riskAnthropic publicly filed its S-1 on October 26, revealing $16.29 billion of first-half revenue (+1,304% year over year) and a $80.7 billion net loss — of which $72.4 billion is a non-cash convertible-note charge. The real number is the $450 billion of signed, mostly non-cancelable compute commitments. Here is what the filing says, why NVDA, ARM and MU are the tradeable read-through, and the conditions that decide whether the AI trade passes its first public valuation test.
Author  Irene Q.
Oct 27, Tue
Anthropic publicly filed its S-1 on October 26, revealing $16.29 billion of first-half revenue (+1,304% year over year) and a $80.7 billion net loss — of which $72.4 billion is a non-cash convertible-note charge. The real number is the $450 billion of signed, mostly non-cancelable compute commitments. Here is what the filing says, why NVDA, ARM and MU are the tradeable read-through, and the conditions that decide whether the AI trade passes its first public valuation test.
placeholder
Brent's $115 front month sits $4.6 above January — the $14 spread to WTI is the supply-risk premiumDecember Brent trades at $115.29 while January is $110.71, a $4.58 backwardation. The December Brent-WTI spread is $14.2, versus a $3-5 normal. That gap, not the headline, is where the Middle East supply risk is priced. Here is what the curve says, why the December contract's expiry on October 30 will mechanically cut the headline by $4.6, and the 108.81 neckline that decides the next move.
Author  Irene Q.
Oct 28, Wed
December Brent trades at $115.29 while January is $110.71, a $4.58 backwardation. The December Brent-WTI spread is $14.2, versus a $3-5 normal. That gap, not the headline, is where the Middle East supply risk is priced. Here is what the curve says, why the December contract's expiry on October 30 will mechanically cut the headline by $4.6, and the 108.81 neckline that decides the next move.
placeholder
Gold Price Analysis Today | Forex Gold Analysis | XAU/USD Analysis - October 29, 2026Get the latest gold price analysis, forex gold insights, and XAU/USD analysis for October 29, 2026. Read on for the details.
Author  Mitrade
Yesterday 02: 06
Get the latest gold price analysis, forex gold insights, and XAU/USD analysis for October 29, 2026. Read on for the details.
placeholder
Gold Price Analysis Today | Forex Gold Analysis | XAU/USD Analysis - October 30, 2026Get the latest gold price analysis, forex gold insights, and XAU/USD analysis for October 30, 2026. Read on for the details.
Author  Mitrade
10 hours ago
Get the latest gold price analysis, forex gold insights, and XAU/USD analysis for October 30, 2026. Read on for the details.
goTop
quote