




Goldman Sachs Stock Forecast: Record Q2 Sets a High Bar Before October 13 Earnings
TradingKey - Goldman Sachs (GS) has its core businesses operating at a strong level heading into the weekend, but a less favorable backdrop for the quarter due to higher Treasury yields and a slowing deal environment. GS closed on October 8 at $882.59, a 0.52% decline from its previous close, and continues to trade below its 2026 highs after the August sell-off in bank stocks.
The major event next week for GS is the release of Q3 2026 results on October 13. Results will be released at 7:30 a.m. ET and the earnings call will follow at 9:30 a.m. ET what is notable for this report is that it seems that investors are not building in expectations for a 'bad' report. Q2 was a historically strong quarter for GS, but that may lead to a 'judgmental' comparison for Q3.
Record Q2 Sets an Exceptionally High Benchmark
The key recent operating update came from CEO David Solomon on September 16. Solomon noted Goldman’s equities business was very strong in Q3, while Fixed Income, Currencies and Commodities (FICC) was somewhat softer compared to the exceptionally strong Q2.
This is important because Q2 was an outlier. Equities revenue surged 72% year-over-year to $7.42 billion, and FICC revenue increased 32% to $4.59 billion. Investment banking fees also increased 55% to $3.40 billion, driven by strong equity and leveraged financing as well as M&A activity.
For Tuesday's report, I will focus more on how much the business normalized rather than whether it was still exceptionally strong. Investors will also be looking to see if the firm outperformed the Street in normalized Q3 equities and FICC trading.
Higher Treasury Yields Complicate the Q3 Backdrop
Macro conditions became more challenging during the quarter. The U.S. Treasury yield curve steepened while the KBW Bank Index fell about 13% from its August levels and about 6% during Q3.
The steepening yield curve presented both challenges and opportunities. The challenges were more broadly felt and concerned the cost of financing. According to Reuters, investment banking activity, after a very active second quarter, slowed and made the commentary on management’s pipeline particularly relevant.
Solomon’s September comments suggested that the fixed income, currencies and commodities (FICC) business slowed. So, the market is likely to focus on whether Goldman is still bullish on the backlog of announced and potential deals.
Asset and Wealth Management Is Becoming More Important
With a modest increase in the S&P 500 during the third quarter, we think the importance of wealth management was reinforced in the minds of the investors.
Goldman is working to lessen its reliance on high-volume trading and dealmaking by diversifying its revenue stream. Goldman’s Asset & Wealth Management segment brought in $4.60 billion in revenue for the quarter, up 20% from last year. The segment also had a record $4.04 trillion in assets under supervision.
Q2 also brought in $91 billion of long-term net inflows, which will also aid in creating a more resilient revenue stream through cyclical Capital Markets. Management fees are a recurring contributor to Goldman’s revenue alongside underwriting and trading.
Goldman has also been acquiring other firms. In August, Goldman announced an agreement to acquire NEOS Investments, an ETF firm that manages $30 billion in 19 options-based ETFs. The proposed acquisition expands Goldman’s presence in the ETF market. Just a few days later, Goldman announced an agreement to acquire LCN Capital Partners, a real estate investment manager with $3 billion focused on sale-leasebacks, build-to-suits, and triple-net leases.
These proposed acquisitions are part of the same overall strategy. Goldman is aiming to build a larger recurring revenue stream through management fees to mitigate the volatility of trading and advisory income.
Capital Returns Remain Strong
Goldman returned a total of $5.36 billion to common shareholders during Q2, comprised of $4.00 billion in share repurchases and $1.36 billion in common dividends. The dividend was increased to $5.00 per share, from the prior $4.50.
The stress capital buffer remains at 3.4% through September 30, 2027, and its standardized CET1 requirement remains at 11.4%.
This capital position enables management to continue returning capital to common shareholders while also funding potential acquisitions. From a shareholder perspective, the strongest version of the thesis remains one where management is able to continue returning capital while also funding potential acquisitions, without sacrificing balance-sheet flexibility.
Leadership Is Also Back in Focus
Goldman’s succession planning has again come into focus. Per Reuters, the board has begun deliberating potential succession planning for President and COO John Waldron to succeed David Solomon.
While no specific succession plan has been announced, it is positive that Solomon remains the CEO, and no transition timetable has been set.
Additionally, as part of their performance based incentives, it was reported that approximately 20 Goldman executives, including Solomon and Waldron, among others, could receive equity awards worth more than $500 million in total. Solomon could reportedly receive more than $100 million.
Neither of these reports alters Tuesday’s earnings, however, the reports strengthen the longer-term governance conversations around executive retention and management succession.
October 13 Earnings Will Test Whether Q2 Momentum Can Last
For Q3, I would concentrate on FICC revenues, investment banking fees, the advisory backlog, Asset and Wealth Management inflows, expense control and management’s outlook on deal activity.
Goldman’s fundamentals remain sound. Q2 revenues grew 39% and investment banking fees grew 55%, while equity revenues surged 72%. Goldman’s assets under supervision crossed $4 trillion and the firm’s ROE was 23.5%.
The challenge is that Q2 established a very high benchmark. The current macro environment is also less supportive as higher interest rates and bond yields tend to curtail leveraged transactions and make the capital markets more selective.
Currently, Goldman trades at 13.7x trailing earnings and 13.6x forward earnings, at $882.59. Earnings need to remain elevated to justify the valuation. However, the level of optimism is built on the assumption that Q2 was not a one-off exceptional and very strong quarter.
What most strengthens my view is if the equities business stayed strong while the investment banking backlog grew, alongside further increases in firm’s assets under supervision and management. What is most concerning is a slowdown in FICC and advisory revenues, and a material increase in expenses.
Goldman Sachs Technical Analysis: GS Tests $882 Support as Oversold RSI Signals Rebound Potential
Goldman Sachs (GS) has had a tough couple of months and ended October 8 at $882.59. From there, GS has had a steady decline from its July highs at around $1,142.07. The current GS trends have broken down from a rising channel and both moving averages and created lower highs and lows. Currently, the price is trading around the important demand zone at $875 and $890. This demand zone should provide some support for the price and a possible trend reversal.
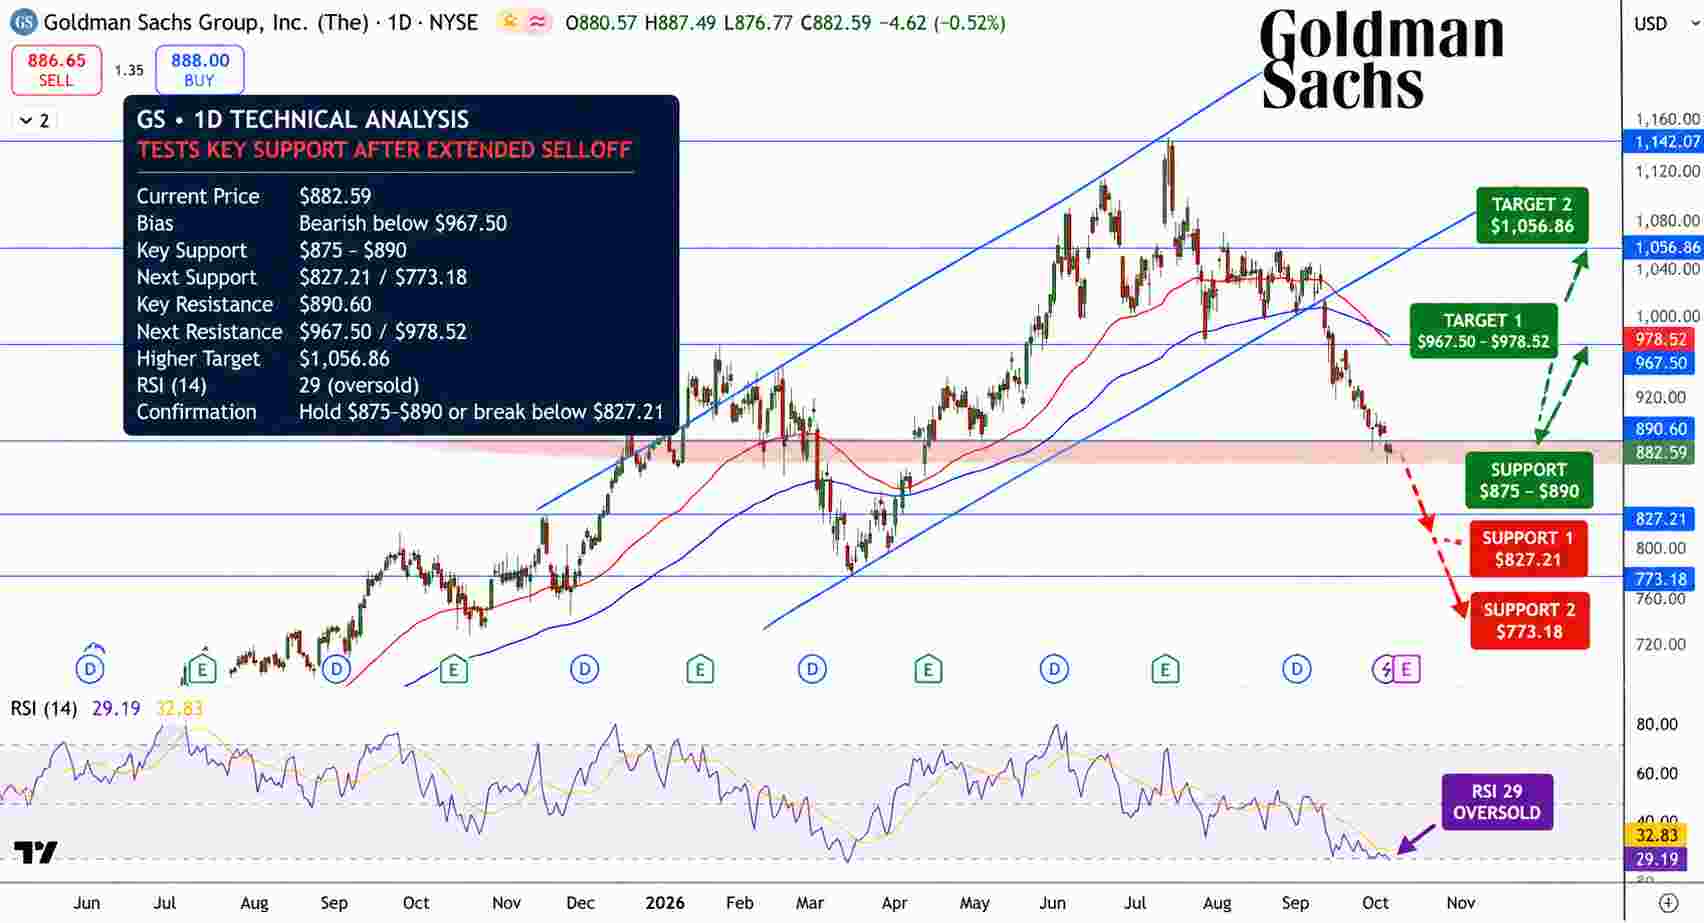
Goldman Sachs Stock Price Chart - Source: Tradingview
RSI is currently at around 29, below the signal line at 33 and is in oversold territory. This confirms that there is still selling pressure but creates a possible upside price rebound.
Current resistance is seen at $890.60 and the stronger resistance levels are seen between $967.50 and $978.52 where the moving averages meet the previous support. A close above this area strengthens the bullish case and brings the next target at $1,056.86 into focus.
There is obvious support at the previous demand zone at $875, then at $827.21 and lower at $773.18. A close below $827.21 would confirm the bearish case and extend the decline.
My base case is for GS to trade lower, but a short-term bounce is possible due to the oversold conditions of RSI.
Why is Goldman Sachs stock in focus this weekend?
GS is getting a close look because it is due to report Q3 results on October 13 after what is possibly the most impressive quarter ever for the firm. Investors want to see if the record breaking Q2 trading and investment banking results can continue as the back end of the yield curve is steepening and overall deal making is likely to slow.
What level confirms a stronger GS recovery?
The bulls would like to see a move above the 200 EMA and the $978.52 resistance level, which would also improve the overall technical outlook and bring the $1056.86 area into play. A break below the $875 demand area would negatively impact the technical outlook and bring the $827.21 area into play.
Bottom Line
GS has a more diverse and stronger business than it did a few years back, especially after the expansion of its own Asset & Wealth Management business. Q2 was a record breaking quarter, and it will be difficult to top those results, especially with the back end of the curve steepening and M&A activity slowing. Technically, GS is bearish below 967.50-978.52, but with the RSI having just been in oversold territory, a retest of support would not be unexpected. Fundamentally, if GS can continue to post strong results like Q2, it could disprove the bear case.
Recommended Articles


