




Climb Global's 2026 Outlook: Scaling High-Touch Distribution to Expand Global Footprint
Key Points
The company scaled revenue 40% in 2025 through acquisitions and vendor recruitment.
Margin compression and heavy customer concentration pose significant risks to long-term profitability.
A debt-free balance sheet supports ongoing investment in automated fulfillment and cloud services.
- 10 stocks we like better than Climb Global Solutions ›
Picture a business that acts as the essential intermediary, enabling access to the software and hardware that keep cybersecurity and cloud networks running. Climb Global Solutions (NASDAQ:CLMB) sits at this critical junction, serving as a value-added distributor that helps vendors move technology products into corporate, reseller, and systems-integrator channels. With its roots in the early 1980s, the company has evolved from a traditional distribution house into a leaner, automated operation. As of Aug. 7, 2026, the stock trades at $27.81, down marginally over the past year despite a significant expansion of its European footprint.
Our proprietary Hidden Gems scoring system assigns Climb Global Solutions an overall Superscore of 77 out of 100, placing it in the Strong category. The Superscore is an AI-powered score that evaluates a company's overall strength by combining financial performance, product-market position, technological capabilities, leadership quality, and relative valuation. It represents the unification of all our scores into a single score for public companies, with five rating bands: Exceptional (90-100), Strong (75-89), Above Average (60-74), Average (40-59), and Cautious (0-39). With a score of 77, the company ranks in the top 13% of our universe. The Superscore is just one data-driven signal worth investigating. This analysis examines both the factors driving the high score and what is holding it back, giving you a balanced view before you decide whether to dig deeper.

Image source: Getty Images.
Why CLMB Has a 77 Superscore
- Exceptional revenue scaling: The company achieved 40% year-over-year revenue growth in 2025, a significant surge that substantially outperformed its historical four-year revenue CAGR of 23%.
- High-touch distribution model: By acting as a specialized conduit for emerging technology vendors rather than a broad-line commodity provider, it has built real switching costs for vendors that rely on its bespoke support services.
- Disciplined asset utilization: Inventory turnover improved from 117x in 2021 to 219x in 2025, proving that the company's drop-shipping and electronic data interchange strategy keeps its physical asset requirements remarkably low.
- Strategic inorganic growth: Successful integration of international acquisitions, such as Douglas Stewart Software (DSS) and Interworks, has enabled it to expand into new geographic markets without the massive overhead of building sales teams from scratch.
- Operational transparency: Management uses the earnings call to provide granular data on gross billings and effective margins, leaving little ambiguity regarding how specific operational costs impact the bottom line.
Why Is CLMB's Superscore Not Higher?
- Significant margin compression: Gross profit margins slipped from 16% to 15% during 2025, revealing that the company is currently sacrificing profitability to maintain its aggressive top-line growth in a competitive environment.
- Elevated valuation multiple: The stock trades at a trailing P/E of 25.0. That leaves little room for error if the deal pipeline cools or if the recent integration costs become structural.
- Material customer concentration: The top-three customers accounted for 48% of net sales as of Q2 2026, meaning the loss of a single major vendor or reseller relationship would deal a massive blow to the company's revenue.
- Operational cash volatility: Operating cash flow declined by 51% in 2025 as the company navigated increased working capital intensity, indicating that its rapid expansion is putting temporary strain on its cash conversion efficiency.
A business that earns a large profit on a small base of hard tangible assets—as indicated by its top-tier return on net tangible assets—tends to convert each point of revenue growth into outsize returns. While the risks of margin compression and vendor concentration remain, the market often pays a premium for this type of capital efficiency because it allows the company to scale without needing constant, massive capital injections.
Table 1: Hidden Gems Database Scores for Climb Global Solutions (CLMB)
| Score | Score (out of 100) | Rank | Supporting Data Point |
|---|---|---|---|
| Product (1Y) | 66 | Top ~40% | Margins compressed due to aggressive pricing and integration costs. |
| Product (5Y) | 75 | Top ~18% | High-touch service model creates lasting vendor relationships. |
| Financial (1Y) | 76 | Top ~18% | Revenue grew 40% in 2025, but cash flow volatility persists. |
| Financial (5Y) | 80 | Top ~8% | Debt-to-equity ratio remains consistently below 0.1. |
| Leaders | 77 | Top ~33% | Management emphasizes operational leverage and vendor optimization. |
| Tech | 69 | Top ~50% | Automated EDI systems drive efficiency in a high-volume model. |
| Valuation Risk | 69 | Top ~18% | The trailing P/E of 25 reflects strong growth prospects. |
Is CLMB Right For Your Portfolio?
This stock warrants a closer look if...
- You seek a company with a strong track record of identifying the best small-cap tech stocks and scaling them through a high-touch distribution network.
- You value a debt-free balance sheet that prioritizes reinvesting cash into M&A over paying dividends.
You may want to keep researching before buying if...
- You are uncomfortable with a business model that relies on a small number of customers for nearly half of its total revenue.
- You worry that recent margin compression indicates a long-term erosion of pricing power in a crowded distribution sector.
The Superscore is one data-driven signal worth investigating, not a standalone buy recommendation; always weigh it against your own research, financial goals, and risk tolerance before acting.
My 5-year prediction for CLMB stock
Climb Global is in the perfect place to grow, thanks to the exploding demand for artificial intelligence (AI) and cybersecurity solutions. The IT distributor is not your conventional distributor; it’s a high-value, specialized tech intermediary that serves as the key connection between technology vendors and the end customers who deploy these technologies.
Often, the success of new technologies depends on how effectively specialized intermediaries, through their high-touch distribution model, enable their channel partners to support and train end users. Climb Global is deeply embedded in the technology solutions ecosystem, which means it has specialized knowledge, trained personnel, vendor relationships, and — most importantly — reseller relationships that can’t be easily replicated by another distributor.
Over the past year, gross profit growth, one of the most important metrics for a distributor, has been stabilizing. Gross profit essentially is what the company keeps after selling its vendors’ technologies to resellers and end customers. However, that hasn’t significantly affected its gross margin, which is still in the mid-teens, implying that Climb Global’s valuable vendor and reseller relationships can’t be easily replicated, which is hugely positive.
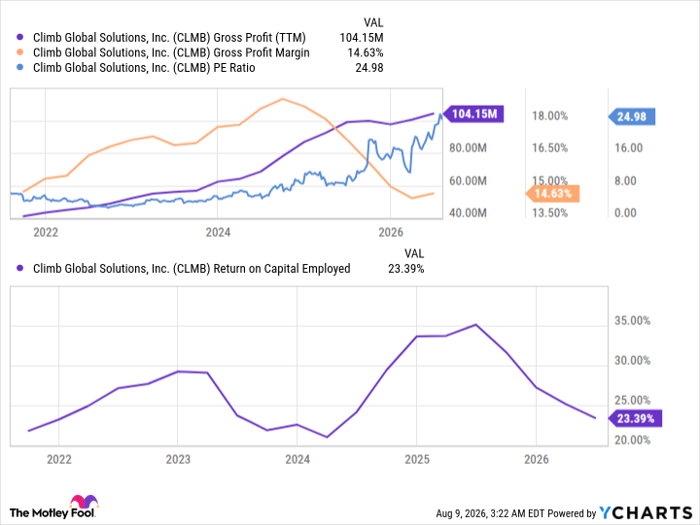
CLMB Gross Profit (TTM) data by YCharts.
One of the main reasons for the lower gross profit growth is increased competition, despite enabling higher sales. But here’s where I’m betting on better days ahead. Climb Global is still a small distributor that is looking out for emerging technology vendors. For emerging vendors, niche distributors like Climb are better suited to understand newer, specialized requirements and, hence, provide better conduits for these technologies to resellers and end customers.
The structural integrity of this business model is reflected in the solid returns on capital employed (ROCE) over the past five years and virtually no debt on its balance sheet. Additionally, the market is pricing the stock at 25 times trailing 12-month earnings, which implies solid growth prospects ahead. On a conservative basis, even if the P/E ratio falls to 20 times trailing earnings, and using the past five-year average EPS growth rate of 22%, the stock could more than double by 2031.
The Hidden Gems Superscore reflects The Motley Fool's proprietary AI-driven evaluation of a company across product, financial, leadership, and valuation pillars as of the article date and may change over time. Performance figures are point-in-time. Past performance does not guarantee future results.
Should you buy stock in Climb Global Solutions right now?
Before you buy stock in Climb Global Solutions, consider this:
The Motley Fool Stock Advisor analyst team just identified what they believe are the 10 best stocks for investors to buy now… and Climb Global Solutions wasn’t one of them. The 10 stocks that made the cut could produce monster returns in the coming years.
Consider when Netflix made this list on December 17, 2004... if you invested $1,000 at the time of our recommendation, you’d have $399,724!* Or when Nvidia made this list on April 15, 2005... if you invested $1,000 at the time of our recommendation, you’d have $1,374,595!*
Now, it’s worth noting Stock Advisor’s total average return is 967% — a market-crushing outperformance compared to 215% for the S&P 500. Don't miss the latest top 10 list, available with Stock Advisor, and join an investing community built by individual investors for individual investors.
See the 10 stocks »
*Stock Advisor returns as of August 9, 2026.
Isac Simon has no position in any of the stocks mentioned. The Motley Fool has no position in any of the stocks mentioned. The Motley Fool has a disclosure policy.
Recommended Articles


