


Solana Price Drops 3% but Longs Keep Piling In: 17 Million SOL Explain Why

Solana (SOL) price trades at $82.20 on April 9, down 3% in 24 hours and 34% year-to-date. Yet leveraged traders are betting heavily on a bounce.
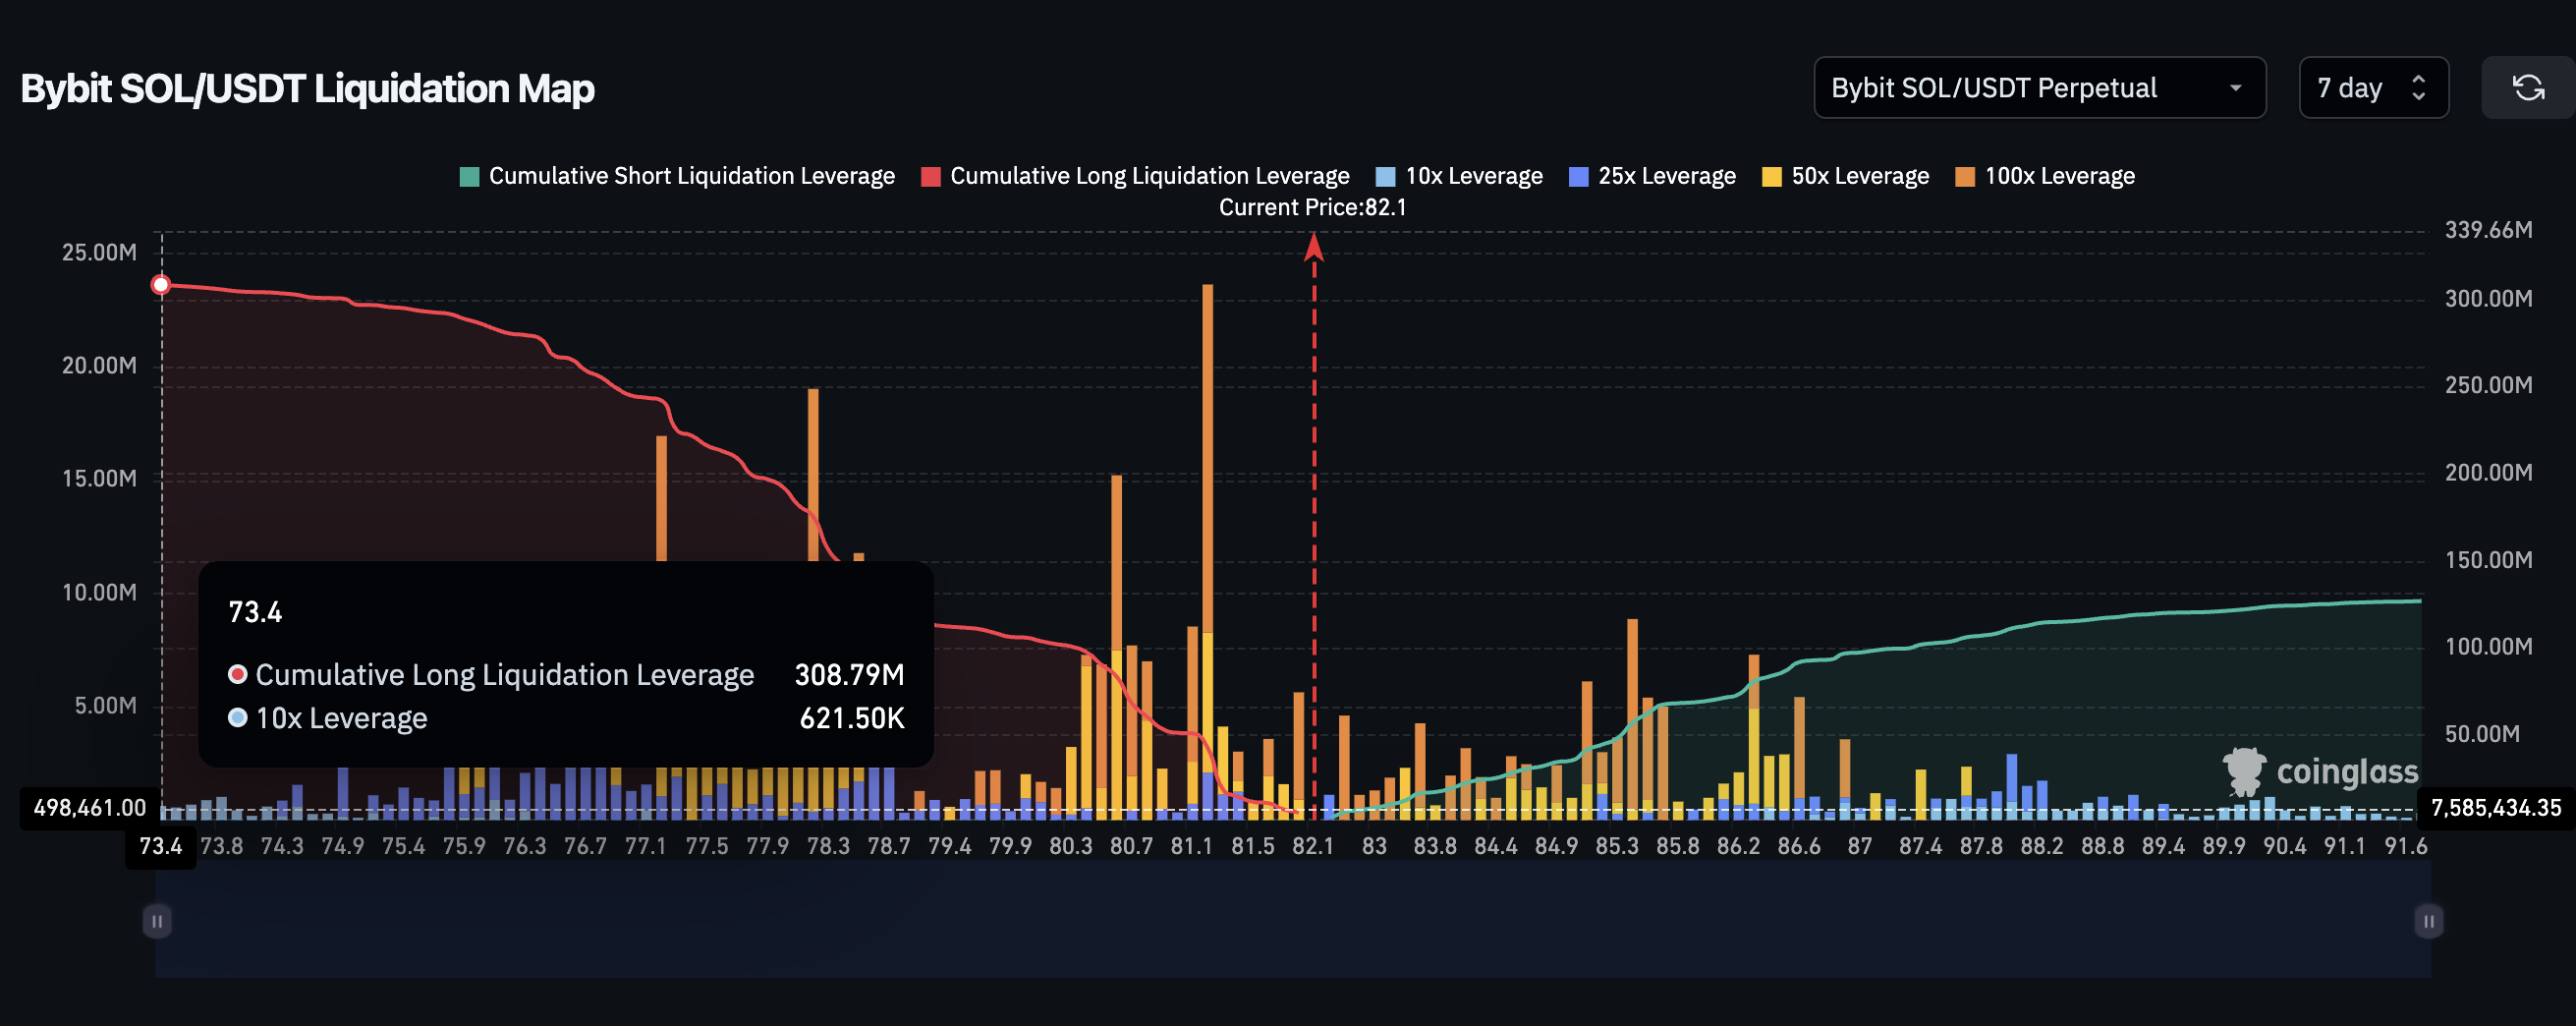
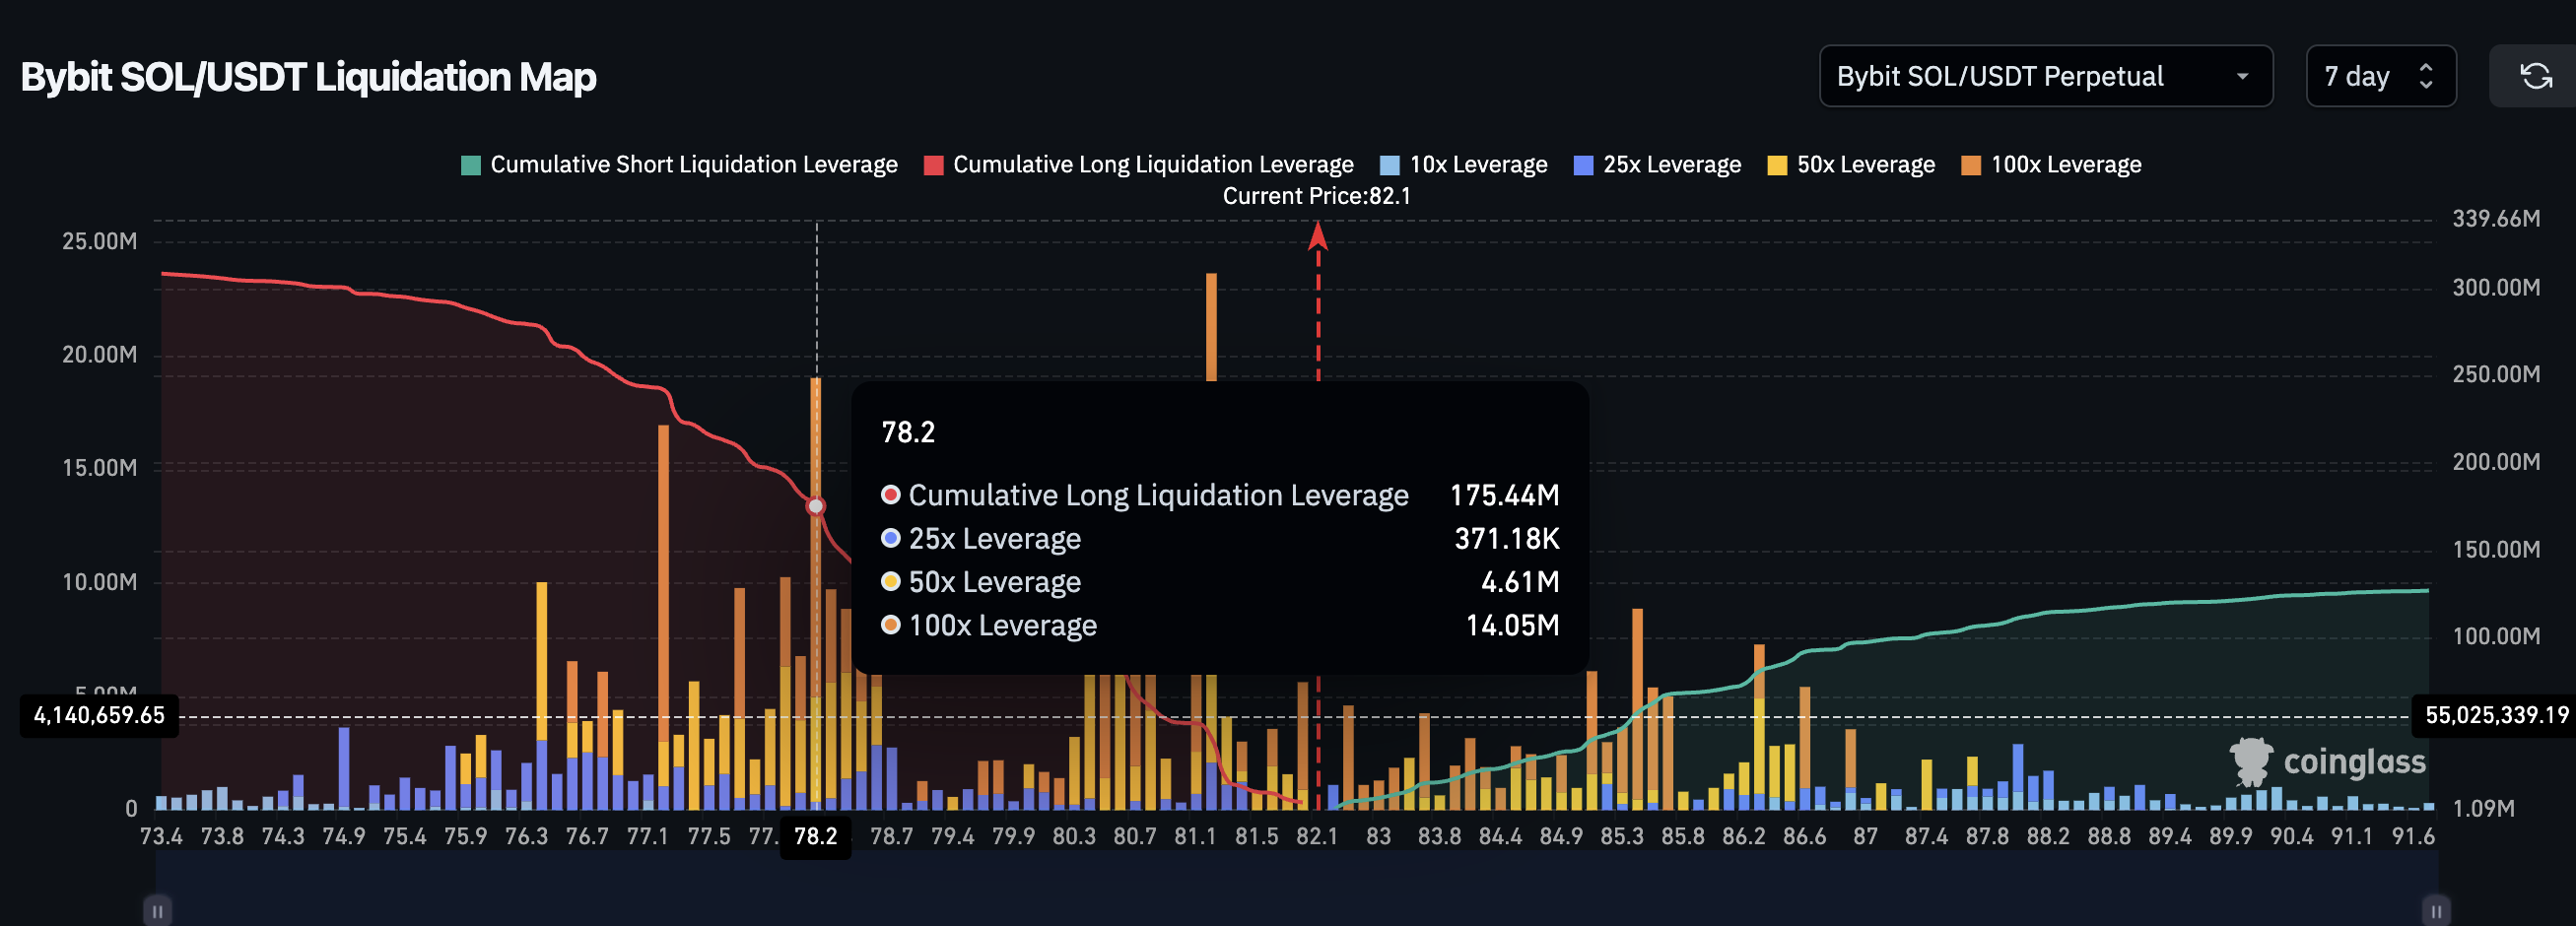
The seven-day liquidation map on Bybit shows $309 million in cumulative long leverage against just $127 million in shorts, a 2.4x mismatch that defies the price weakness. A bullish reversal pattern on the 12-hour chart and an on-chain supply wall may explain why the crowd refuses to turn bearish on Solana price despite the sustained bleed.
Price Weakness Meets a 2.4x Long Bias as a Reversal Pattern Takes Shape
Solana price has dropped almost 5% over the past 30 days while the broader market digested ceasefire uncertainty and capital rotation into equities. The 34% year-to-date decline makes SOL one of the weaker performers among top tokens.
The leverage picture tells a completely different story. On Bybit’s SOL/USDT perpetual market, cumulative long liquidation leverage stands at $308.79 million. Short liquidation leverage sits at $127.02 million. Longs outweigh shorts by roughly 2.4 to 1.
Want more token insights like this? Sign up for Editor Harsh Notariya’s Daily Crypto Newsletter here.
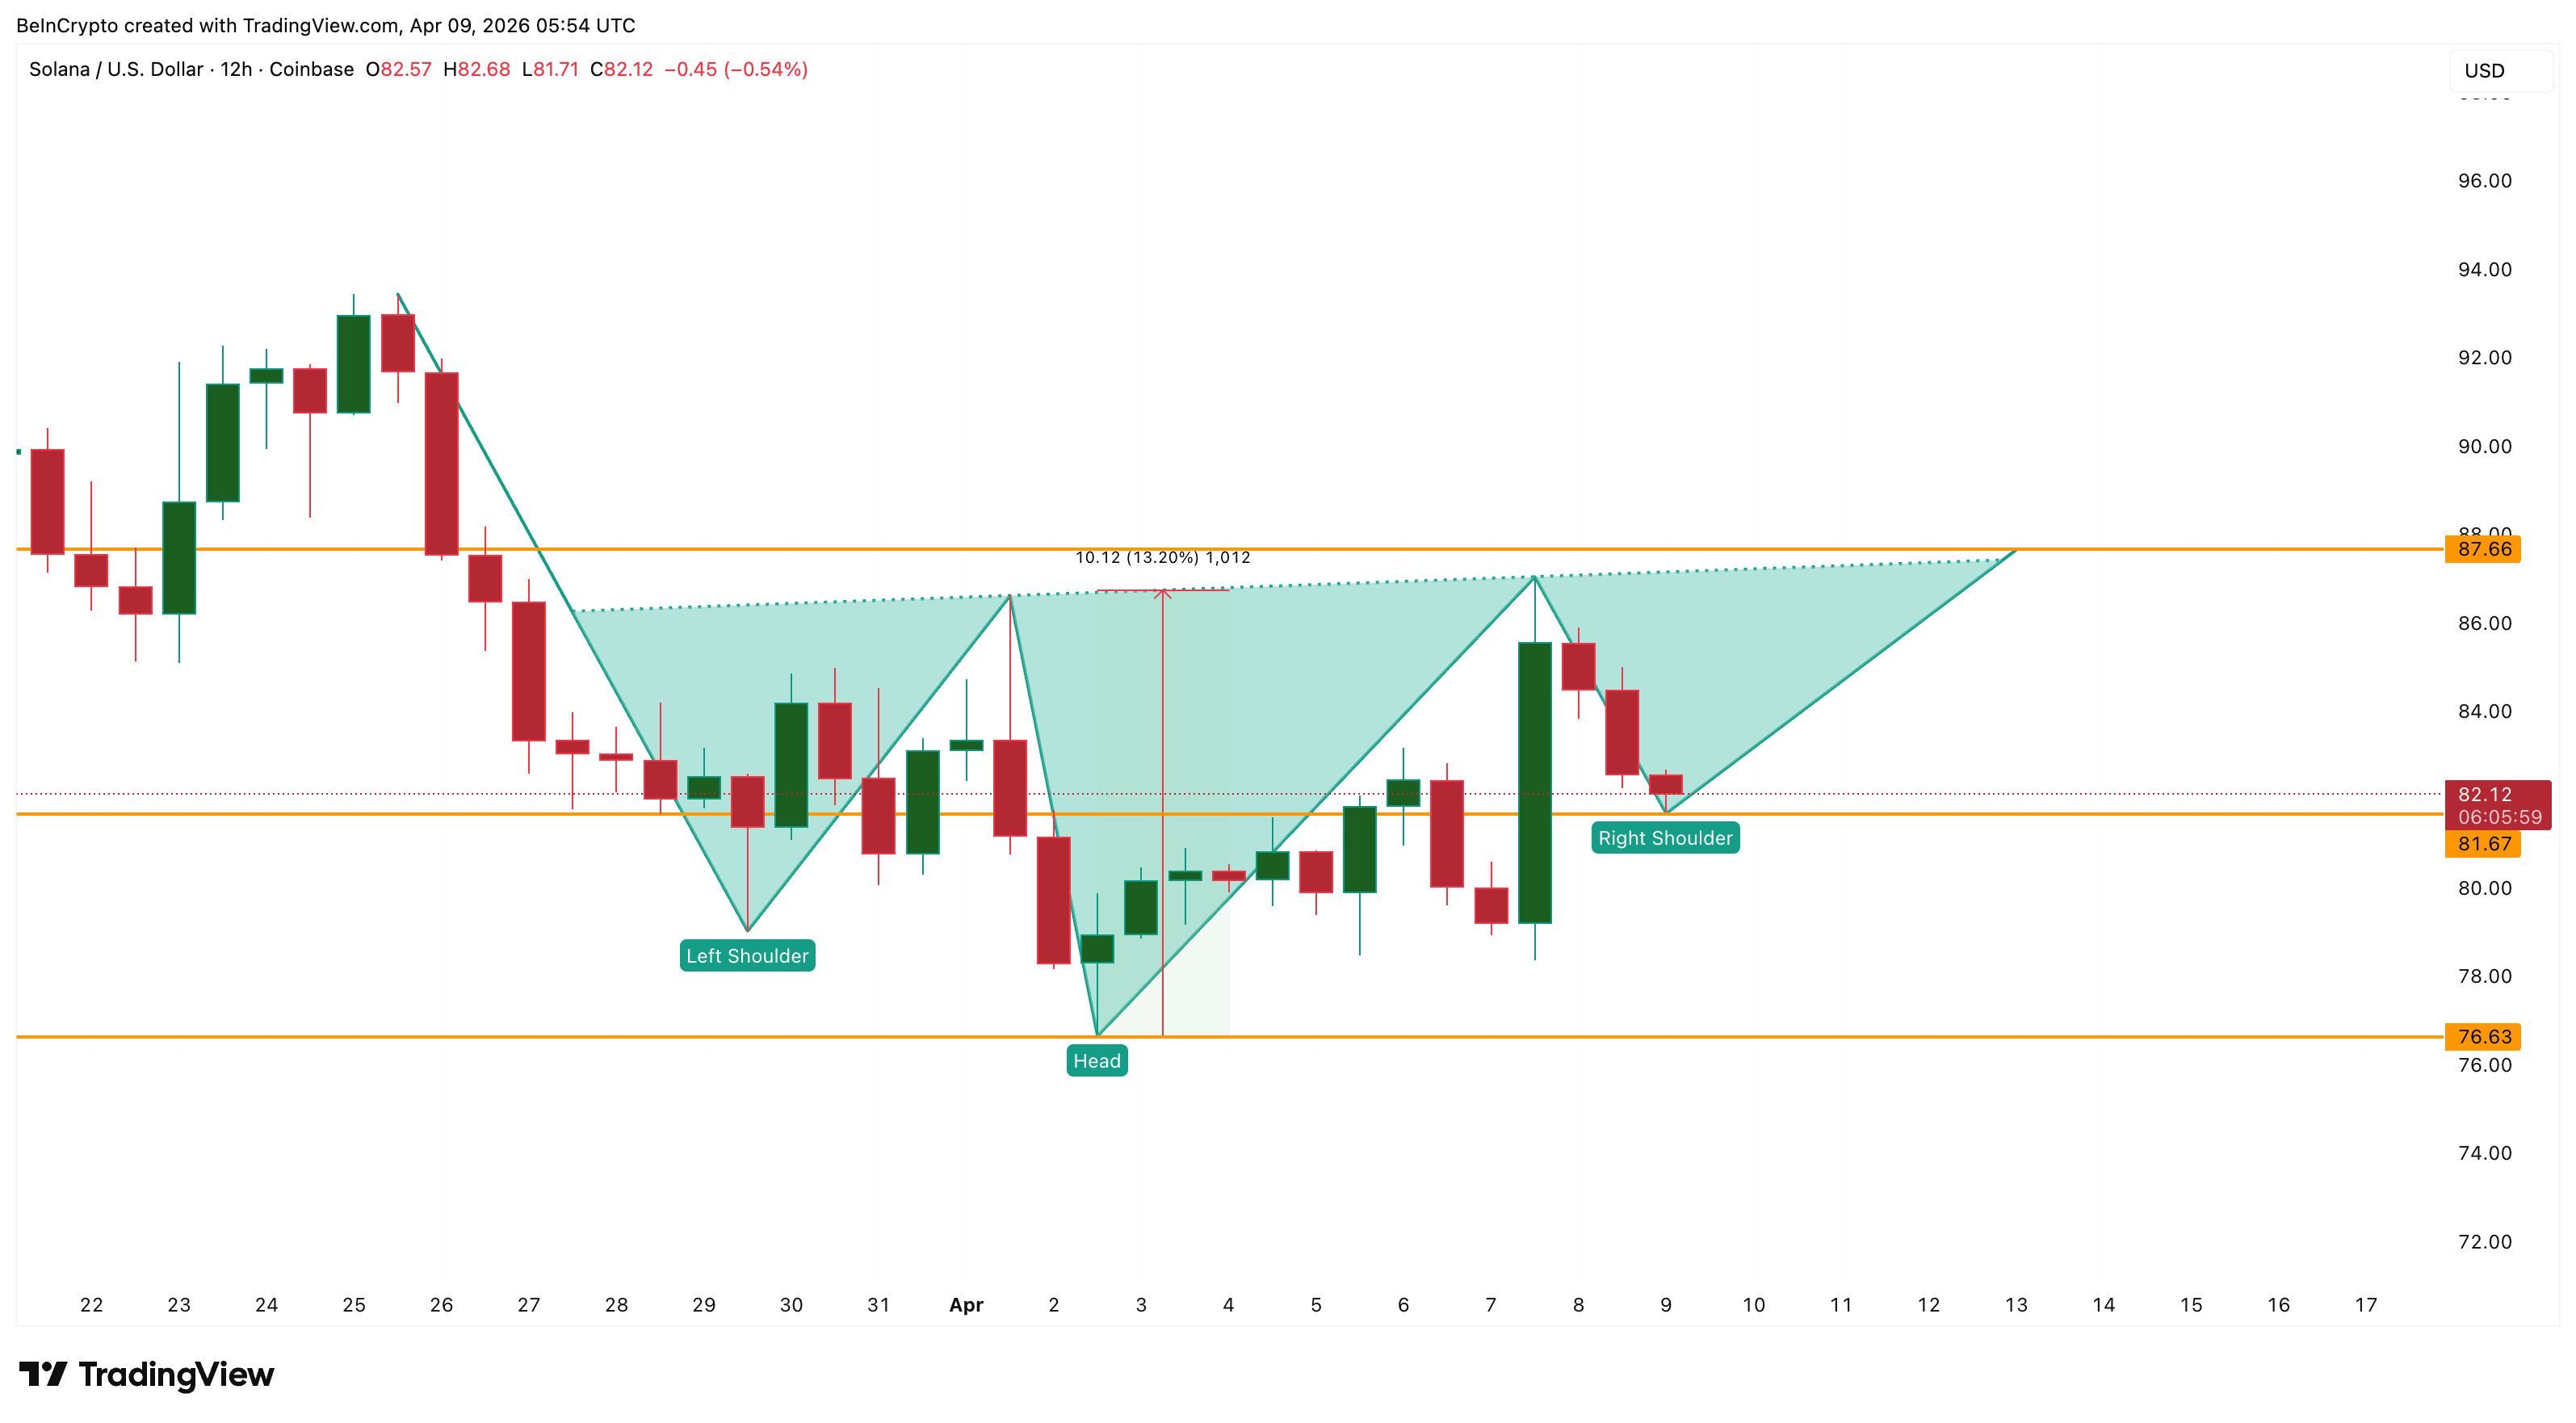
The mismatch becomes less puzzling when the 12-hour chart is considered. SOL is forming an inverse head and shoulders, a bullish reversal pattern. The right shoulder is currently taking shape, and the price is sitting near its base. As long as the pattern remains valid (SOL stays above $76.63), the leveraged crowd appears to be betting that the current dip is the final leg of the right shoulder before a breakout.
However, a pattern alone does not justify $309 million in directional bets. The on-chain picture reveals where that conviction is coming from.
17.5 Million SOL Accumulated at the Exact Level Where the Right Shoulder Sits
The cost basis distribution heatmap from Glassnode shows the densest supply cluster sitting between $81.16 and $81.98. Approximately 17.47 million SOL has been accumulated at this range, making it the strongest holder concentration zone on the chart.
The right shoulder’s lowest wick sits at $81.67, directly inside this cluster. The alignment is not a coincidence. Traders and holders who bought between $81.16 and $81.98 are defending their cost basis. Every dip into this zone gets absorbed because selling here would mean realizing losses for a large portion of the supply.
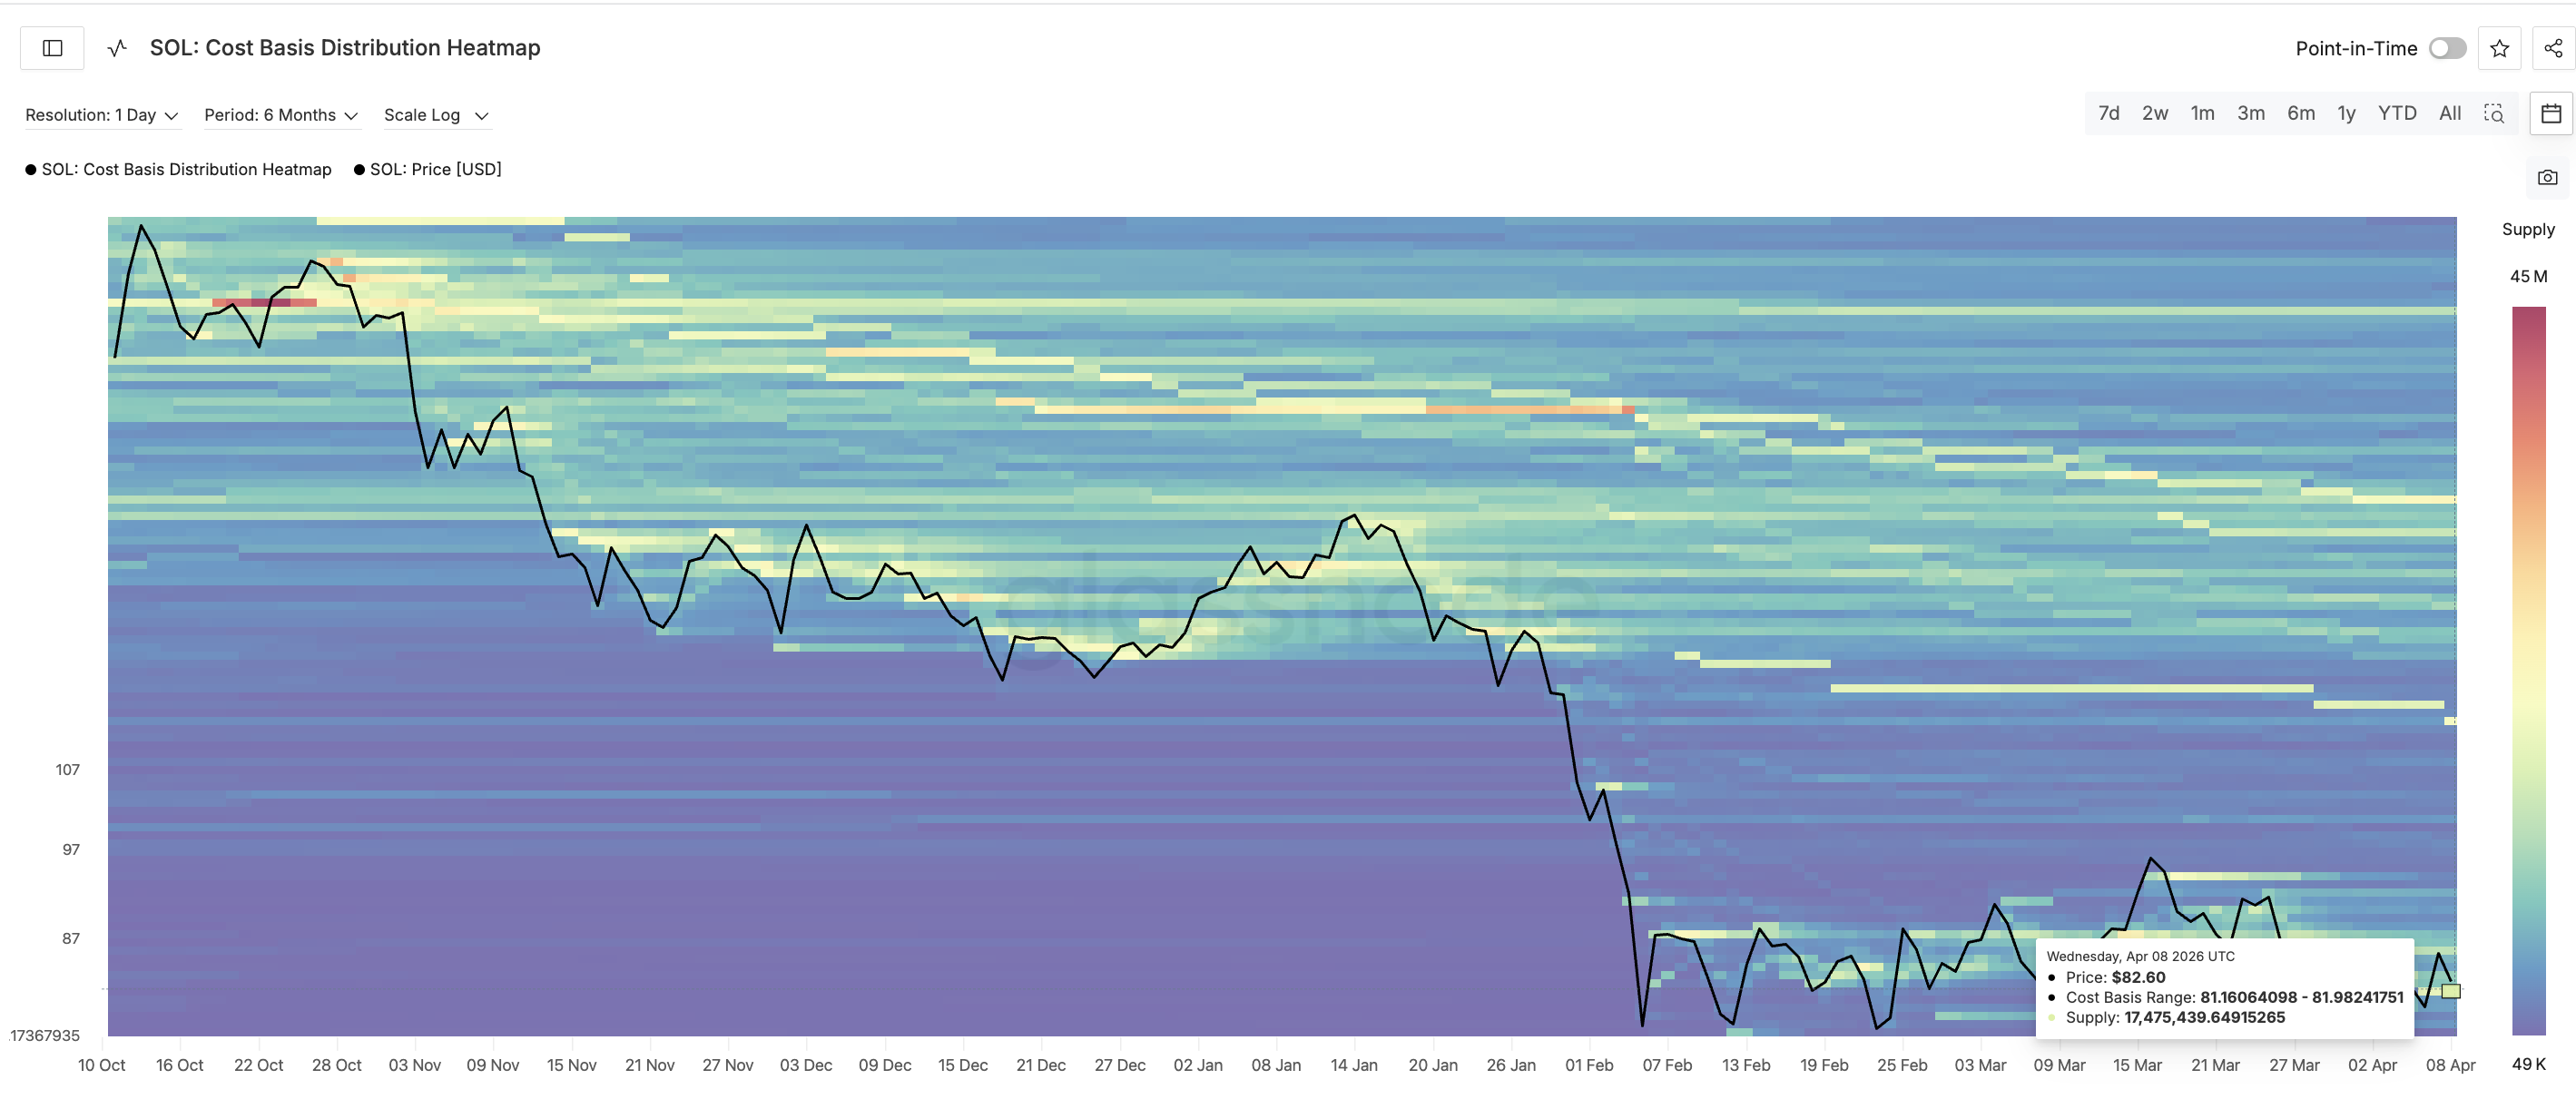
This on-chain wall gives the inverse head and shoulders its structural credibility. The pattern is holding because a real supply base supports it, not just speculative leverage. The longs on Bybit appear to be reading the same signal and positioning accordingly.
However, a $175 million long liquidation cluster sits around $78. If the cost basis wall fails and Solana price drops through $78, the resulting cascade could wipe out the bullish thesis rather quickly.
The SOL price levels now determine which outcome plays out.
Solana Price Levels That Decide if the Longs Are Right
SOL trades at $82.20. The first hurdle sits at $84.12 at the 0.236 Fibonacci level. A 12-hour close above $84.12 would suggest the right shoulder was completed earlier and buyers are now pushing toward the neckline.
The neckline zone sits between $86.86 at the 0.5 level and $88.09 at the 0.618 level. A daily close above $88.09 would confirm the breakout and activate the 13.2% measured move projection from the neckline. That targets $98.47-$98.80, per target projection.
On the downside, $81.67 is the right shoulder floor and almost the base of the 17.5 million SOL supply wall. A 12-hour close below $81.67 would deepen the right shoulder and raise questions about the pattern’s validity.
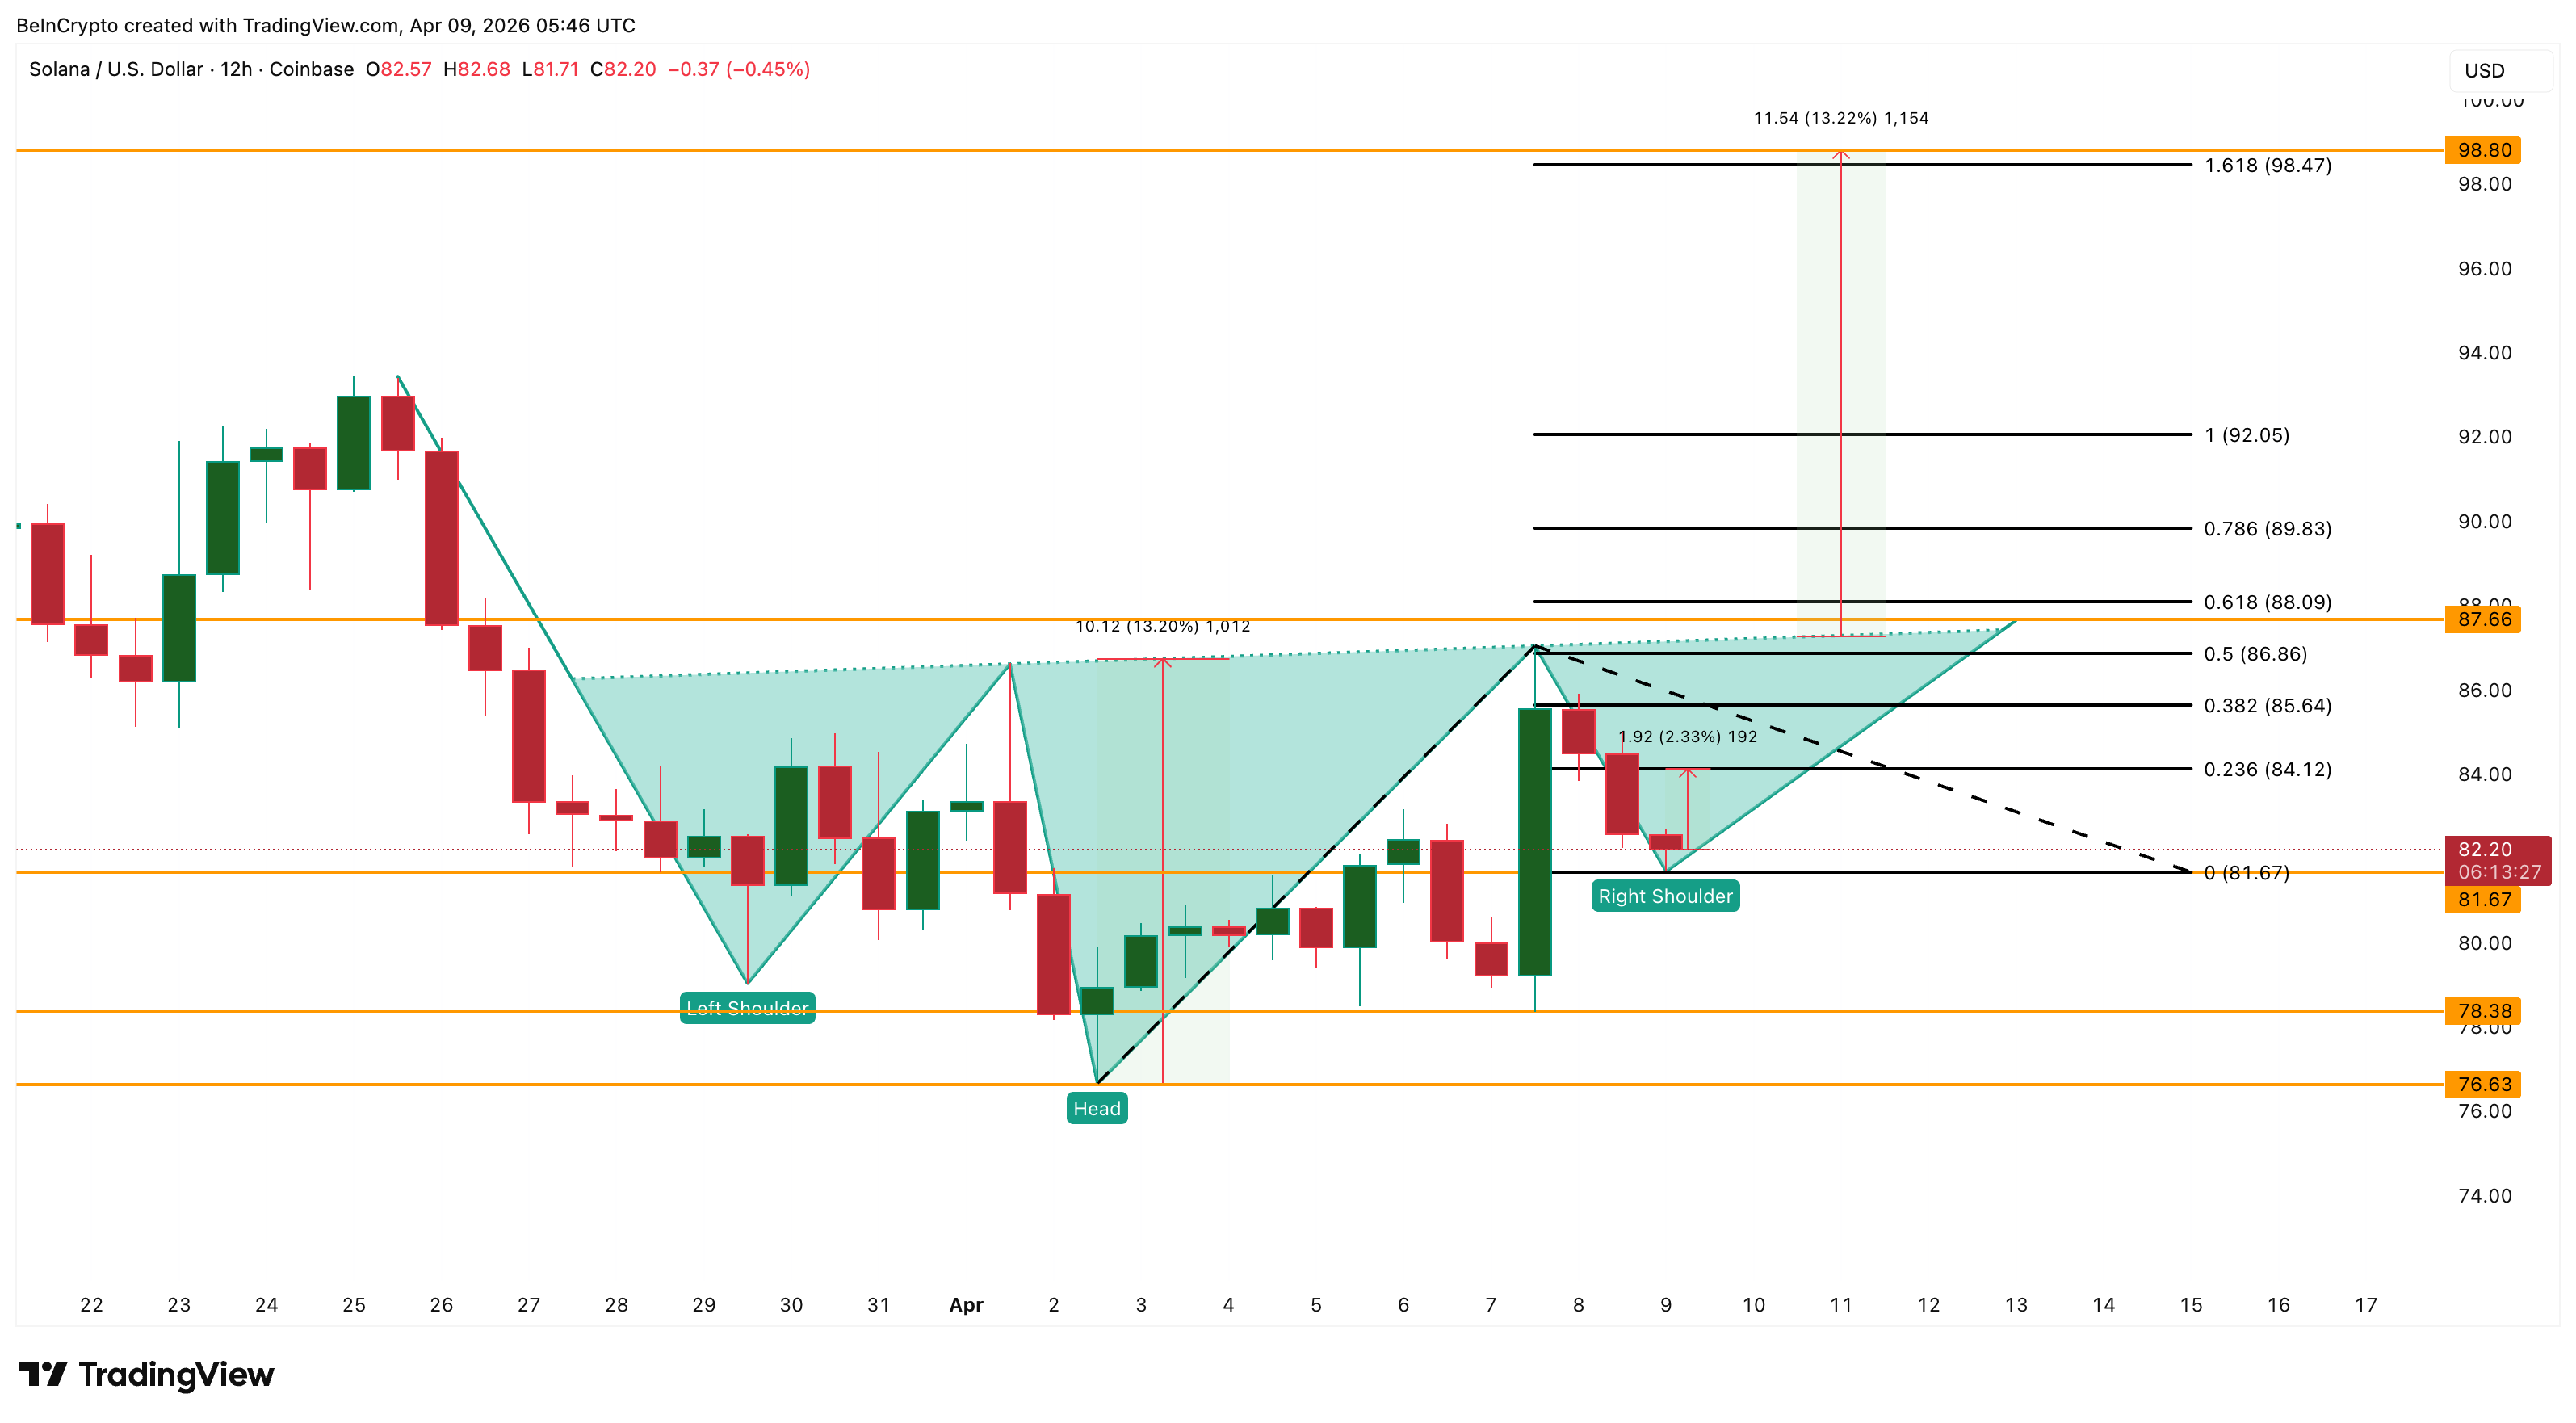
Below that, $78.38 offers the next technical support. However, the $78 zone is where roughly $175 million in long liquidations are clustered. If SOL reaches that level, forced selling from liquidated positions would likely accelerate the decline and damage the pattern significantly. A break below $76.63 at the head invalidates the inverse head and shoulders entirely.
For now, $88.09 separates a confirmed breakout toward $98.80 from a failed right shoulder that risks triggering $175 million in long liquidations below $78.
* The content presented above, whether from a third party or not, is considered as general advice only. This article should not be construed as containing investment advice, investment recommendations, an offer of or solicitation for any transactions in financial instruments.


