




Tariff Fears Are Rattling the Market. Here's What 100 Years of Data Says About What Happens Next.
Key Points
Tariff refunds are rolling out, and it's raising concerns among some investors.
A long-term outlook is more important than ever to protect your portfolio.
- 10 stocks we like better than S&P 500 Index ›
Tariffs have been a hot-button topic for both businesses and consumers over the last year. Now that tariff refunds are starting to roll out for importers, some investors are concerned that the U.S. could end up paying more for the refunds than it collects in tariff revenue -- potentially complicating economic growth.
Regardless of how the tariff situation unfolds, confusion and uncertainty aren't generally great for investor optimism. Here's what history says about what might be coming next.
Will AI create the world's first trillionaire? Our team just released a report on the one little-known company, called an "Indispensable Monopoly" providing the critical technology Nvidia and Intel both need. Continue »
Image source: Getty Images.
Is a recession coming in 2026?
Nobody can say exactly what the market or economy will do in the coming months, especially when new government policies could change that trajectory on a dime. That said, even if the U.S. does enter a recession in the coming year or so, history has promising news for investors.
Over the past century, the stock market has faced severe recessions, bear markets, crashes, and corrections, yet it's thrived despite them all.
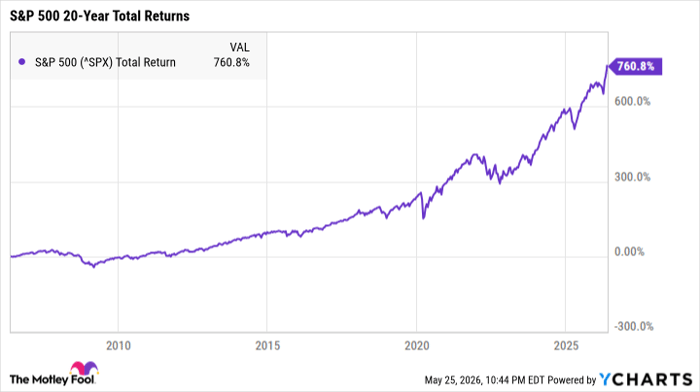
The past two decades have been particularly volatile for the market, with major indexes experiencing multiple record-breaking downturns. Despite all the turbulence, the S&P 500 (SNPINDEX: ^GSPC) has delivered total returns of more than 760% over the past 20 years.
^SPX data by YCharts
Historically, most downturns have also been shorter than many investors expect. In fact, the average S&P 500 bear market since 1929 has lasted only around nine months, research from Bespoke Investment Group found. While there will always be outliers, generally speaking, bull markets have historically lasted far longer than bear markets.
What investors can do right now
If history shows us anything, it's that staying invested through all the market's rough patches is key. The market can be incredibly unpredictable, and trying to time your sell-off perfectly can be risky -- especially with factors like tariffs, inflation, and wars complicating the market's future.
No matter what's on the horizon, investing in strong stocks and holding them for at least a few years is one of the best ways to protect your portfolio against volatility.
Should you buy stock in S&P 500 Index right now?
Before you buy stock in S&P 500 Index, consider this:
The Motley Fool Stock Advisor analyst team just identified what they believe are the 10 best stocks for investors to buy now… and S&P 500 Index wasn’t one of them. The 10 stocks that made the cut could produce monster returns in the coming years.
Consider when Netflix made this list on December 17, 2004... if you invested $1,000 at the time of our recommendation, you’d have $472,852!* Or when Nvidia made this list on April 15, 2005... if you invested $1,000 at the time of our recommendation, you’d have $1,317,207!*
Now, it’s worth noting Stock Advisor’s total average return is 984% — a market-crushing outperformance compared to 210% for the S&P 500. Don't miss the latest top 10 list, available with Stock Advisor, and join an investing community built by individual investors for individual investors.
See the 10 stocks »
*Stock Advisor returns as of May 28, 2026.
Katie Brockman has no position in any of the stocks mentioned. The Motley Fool has no position in any of the stocks mentioned. The Motley Fool has a disclosure policy.
Recommended Articles


