


The Stock and Bond Markets Are Flashing a Warning That Preceded Every Recession Since 1970
Key Points
The yield curve for U.S. Treasury bonds shows the relationship between interest rates and bond maturities.
The Treasuries' yield curve is returning to normalcy after being inverted as the Fed took on inflation in 2022.
"Un-inversions" of the yield curve for U.S. Treasury bonds have usually not been a good sign for the economy.
- These 10 stocks could mint the next wave of millionaires ›
The stock market has never been very predictable. If it were, a lot more people would make a lot more money or lose a lot less. However, some indicators have historically been more reliable than others. And although the stock market and the economy aren't directly tied together, some market signals have hinted at what's to come for the economy.
The current signal the stock market is giving off is in relation to the bond market. Nothing is ever guaranteed in the stock market or economy, but the current U.S. Treasury bonds' yield curve is flashing a warning that has preceded every recession since 1970. That alone makes it well worth paying attention to now.
Will AI create the world's first trillionaire? Our team just released a report on the one little-known company, called an "Indispensable Monopoly" providing the critical technology Nvidia and Intel both need. Continue »

Image source: Getty Images.
Looking at the U.S. Treasury yield curve
U.S. Treasury bonds are considered the safest investment someone could make because they're backed by the full faith and credit of the U.S. government. The yield curve shows the relationship between the interest rate these bonds pay and time.
Normally, the yield curve slopes upward because interest rates are higher for longer-term bonds than for shorter-term ones. Think about it: There isn't much incentive to buy longer-term bonds if you can receive more in interest and have your money tied up for a shorter period.
However, sometimes the script does flip, and shorter-term bonds begin to pay more than longer-term ones because people are concerned about the near-term state of the economy. This is called an inversion, and it's been the case since mid-2022, when the Federal Reserve raised interest rates to fight inflation.
What warning sign is the current yield curve showing?
The warning sign the stock and bond markets are currently flashing is an "un-inversion," which occurs when short-term interest rates begin to fall, and the curve returns to its normal upward slope. As of early April, the spread between the interest rates on 10-year and 2-year bonds is 0.52 percentage points (with the 10-year rate higher).
And although this return to "normalcy" may seem ideal, it has historically been followed by a not-so-ideal economy.
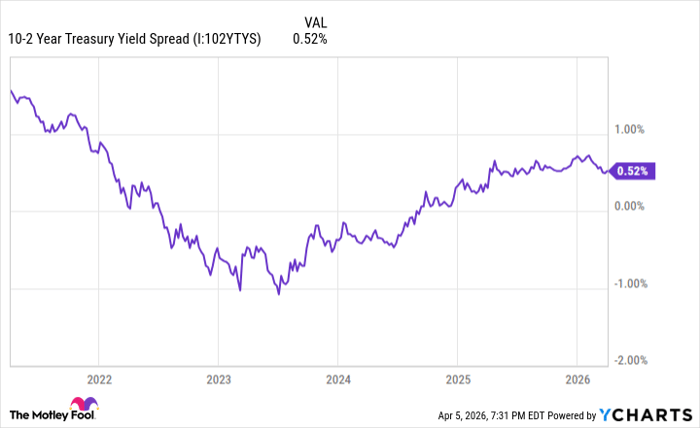
10-year to 2-Year Treasury Yield spread; data by YCharts.
You can look at the past four recessions and see how the un-inversions have timed up with them.
The COVID pandemic caused the 2020 recession, but the un-inversion began in mid-2019; an un-inversion began in early 2007, leading up to the Great Recession; the spread turned positive in the few months leading up to the dot-com bubble in 2001; and it turned positive in late 1989, going into the 1990 recession.
You shouldn't take the current correlation as a sign of doomsday, but rather as a warning sign to prepare accordingly. It's always better to be overprepared than underprepared.
Where to invest $1,000 right now
When our analyst team has a stock tip, it can pay to listen. After all, Stock Advisor’s total average return is 968%* — a market-crushing outperformance compared to 191% for the S&P 500.
They just revealed what they believe are the 10 best stocks for investors to buy right now, available when you join Stock Advisor.
See the stocks »
*Stock Advisor returns as of April 14, 2026.
The Motley Fool has a disclosure policy.
Recommended Articles


