




US Dollar Index Price Forecast: DXY hits fresh yearly high after bullish flag breakout
- US Dollar Index hits a fresh yearly high as hot US inflation and hawkish Fed remarks fuel rate-hike bets.
- DXY breaks above a bullish flag pattern, with the RSI at 63 signaling positive momentum.
- A sustained break above 103.00 could open the door toward 104.00, while 102.20 offers initial support.
The US Dollar Index (DXY) rises for a second straight day on Wednesday, hitting a fresh year-to-date high as hotter-than-expected US consumer inflation and calls from Federal Reserve (Fed) officials for further tightening fuel bets on more aggressive rate hikes.
At the time of writing, the DXY, which tracks the Greenback against a basket of six major currencies, trades around 102.96, surpassing the previous yearly peak of 102.94 set in October.
Data released on Tuesday showed that the US Consumer Price Index (CPI) rose 0.4% MoM in October, above the 0.3% forecast but down from 0.6% in September. Core CPI, which excludes food and energy, rose 0.3% MoM, matching September’s pace and beating the 0.2% forecast. Traders now fully price in a December rate hike, with an 87.1% chance of a 25-basis-point (bps) increase and a 12.9% chance of a larger 50 bps move, according to the CME FedWatch Tool.
Dollar strength underpinned as Fed hawkishness and curve flattening support DXY
Analysts at ING highlight that the latest US inflation surprise and policy rhetoric have materially shifted rate expectations, noting that the Fed’s Chris Waller “tossed a hawkish grenade into money markets early yesterday with his threat to vote for a 50bp rate hike at the 9 December FOMC meeting.” They add that this stance was “conditioned…on the October CPI data coming in hot for the third month in a row, which it subsequently did.”
Against this backdrop, ING argues that the rates backdrop is constructive for the Dollar, stressing that “bearish flattening of the US yield curve as the Fed takes rates into restrictive territory is normally good for the dollar against activity currencies.” With “what could be an accelerating US labour market, core inflation well above target and a Fed ready to pull the trigger again,” the bank says it “expect[s] the dollar to stay strong and explore the top end of trading ranges over the coming weeks.” In index terms, ING concludes that “DXY should remain near recent highs and could be retesting big resistance at 102.85/103.00 sooner rather than later.”
Technical analysis
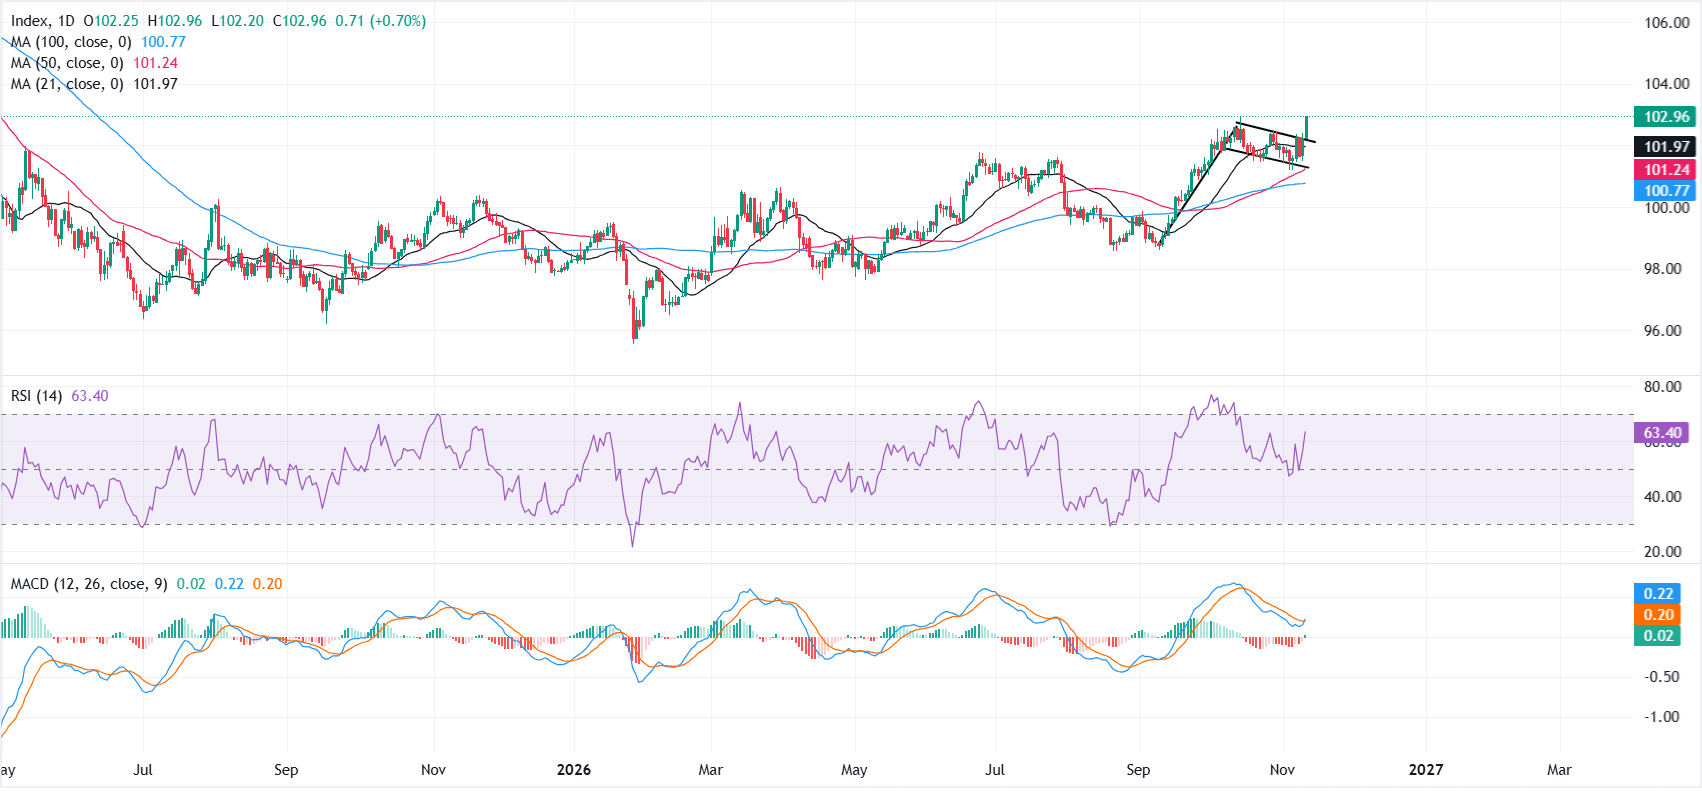
On the daily chart, the latest leg higher confirms a breakout above the upper boundary of the bullish flag pattern. The index also trades above its 21-, 50- and 100-day Simple Moving Averages (SMAs). Together, these signals suggest the bulls hold the upper hand.
The Relative Strength Index (RSI) at 63 sits in positive territory without yet being overbought, while the Moving Average Convergence Divergence (MACD) has turned marginally positive, hinting that upside momentum is stabilizing after the recent consolidation.
On the upside, immediate resistance is at 103. A daily close above that level could open the way toward 104, followed by 105. On the downside, initial support comes in near 102.20 at the former upper boundary of the bullish flag.
Below that, the 102 round level is reinforced by the 21-day SMA at 101.97. A deeper pullback would expose the 50-day SMA at 101.24, near the lower boundary of the bullish flag, followed by the 100-day SMA at 100.77.
(The technical analysis of this story was written with the help of an AI tool. Know more.)
US Dollar Price Today
The table below shows the percentage change of US Dollar (USD) against listed major currencies today. US Dollar was the strongest against the Swiss Franc.
| USD | EUR | GBP | JPY | CAD | AUD | NZD | CHF | |
|---|---|---|---|---|---|---|---|---|
| USD | 0.67% | 0.53% | 0.69% | 0.41% | 0.21% | 0.71% | 0.99% | |
| EUR | -0.67% | -0.14% | 0.04% | -0.26% | -0.47% | 0.03% | 0.32% | |
| GBP | -0.53% | 0.14% | 0.17% | -0.12% | -0.33% | 0.17% | 0.46% | |
| JPY | -0.69% | -0.04% | -0.17% | -0.28% | -0.48% | 0.00% | 0.30% | |
| CAD | -0.41% | 0.26% | 0.12% | 0.28% | -0.19% | 0.29% | 0.58% | |
| AUD | -0.21% | 0.47% | 0.33% | 0.48% | 0.19% | 0.50% | 0.78% | |
| NZD | -0.71% | -0.03% | -0.17% | -0.01% | -0.29% | -0.50% | 0.30% | |
| CHF | -0.99% | -0.32% | -0.46% | -0.30% | -0.58% | -0.78% | -0.30% |
The heat map shows percentage changes of major currencies against each other. The base currency is picked from the left column, while the quote currency is picked from the top row. For example, if you pick the US Dollar from the left column and move along the horizontal line to the Japanese Yen, the percentage change displayed in the box will represent USD (base)/JPY (quote).
Recommended Articles


