


Dow Jones Industrial Average drops as Powell signs off: is $650B in AI capex the next risk?
- Dow Jones Industrial Average can't get back above 48,900 as Oil rallies and Iran tensions stay live.
- Federal Reserve splits 8-4 in Powell's last meeting as chair, the most dissents since 1992.
- Four hyperscalers report in 80 seconds, but the real story is that AI capex commitments keep climbing.
- Meta's $10 billion capex hike pushes the four-company 2026 bill close to $650 billion.
Wednesday's session had every excuse to rally. The Federal Reserve (Fed) decision was telegraphed. Big Tech earnings were teed up. The Dow Jones Industrial Average (DJIA) had reclaimed 49,000 just two days earlier. Instead, the index drifted lower from the open, sold off through the afternoon, and closed near 48,900 with the 30-stock benchmark down close to 0.6%. That's a fifth straight loss, and the second time this week that buyers have failed to get the index back above 48,900 line they keep treating like a ceiling. The S&P 500 closed flat, the Nasdaq Composite squeezed out a tiny gain, and the 10-year US Treasury yield pushed above 4.4%. None of that looks like a market that thinks the next move is up.
It started with a 4 a.m. message
Donald Trump posted an AI-generated image of himself holding a rifle on Truth Social shortly after 08:00 GMT, captioned "No More Mr. Nice Guy" and accusing Iran of dragging its feet on a nuclear deal. Brent crude moved through $110 and West Texas Intermediate (WTI) reclaimed $100, levels that all but guarantee an inflation print problem in the months to come. Then The Wall Street Journal reported that Trump had told aides to prepare for an extended blockade of Iranian ports, and the Strait of Hormuz story shifted from a tail risk to the dominant macro headline of the day. By the cash open in New York, traders were not buying dips. They were marking time until the Federal Open Market Committee (FOMC).
Then Powell's farewell got messy
The 18:00 GMT FOMC release should have been the easy part. Markets had priced a 100% probability of no change to the 3.5% to 3.75% federal funds rate target range, and they got it. What they didn't expect was the most divided vote since 1992. Three officials dissented because they wanted the easing-bias language stripped out of the statement, while Stephen Miran went the other way and pushed for a cut. "Chair Powell concludes his term with 4 dissents," noted Brent Schutte, chief investment officer at Northwestern Mutual, a quiet line that lands harder when you remember Powell ran the FOMC on consensus for years. Jeff Kilburg of KKM Financial put it more bluntly on CNBC, framing the dissents as a warning to Trump nominee Kevin Warsh that the rest of the committee "are not going to let you lead us here." Powell himself said the war in Iran is making the path of policy hard to map and confirmed he will stay on the Board of Governors past his May 15 chair-term expiry. The 10-year yield ripped on the hawkish tone, and the Dow extended losses into the bell.
Eighty seconds, four mega-caps, one uncomfortable theme
The 20:00 GMT close kicked off a rapid-fire earnings sequence. Microsoft (MSFT), Alphabet (GOOGL), Amazon (AMZN), and Meta (META) all crossed the wires within minutes of one another, with Qualcomm (QCOM) reporting just ahead. The headlines looked like a full house. Microsoft's Azure grew 40% YoY, well ahead of its own 37% to 38% guide. Alphabet's Google Cloud put up 63% growth, almost outdoing last quarter's already blockbuster 48%. Amazon Web Services (AWS) ran at 28%, its fastest pace in three years. Qualcomm jumped more than 13% on a Q2 fiscal 2026 print at the top of guidance, with Automotive revenue up 38% YoY to a record level. Walk away after reading those headlines and Wednesday looked like a strong night for tech. Look two layers down and the picture changed.
The figure that's gotten too big to wave away
Microsoft's Cloud gross margin slipped to 66%, with the company explicitly naming AI infrastructure investment as the drag. Amazon beat on the top and bottom line and still fell more than 3% in extended trade. And Meta, which actually came in below estimates on its Q1 capex spend, took 2026 capex guidance up to a $125 billion to $145 billion range, $10 billion higher at both ends than the prior $115 billion to $135 billion guide. Stack that against Alphabet's $175 billion to $185 billion plan and Amazon's roughly $200 billion target, and the four-company 2026 capex bill is now close to $650 billion. That number did not exist on Wall Street's screens 18 months ago, and it is increasingly the figure traders point to when they ask whether AI revenue can keep pace with AI infrastructure costs. Meta blamed component pricing and extra data center costs. Microsoft pointed at the same dynamic. Amazon's post-print fade said the same thing without anybody having to say it. The story is no longer that one or two hyperscalers are spending heavily on AI. It is that all of them are, and the bar keeps moving higher.
The data that could turn dissenters into a majority
Whether this week's hawkish split fades into a footnote or becomes a turning point depends on what the next 48 hours show. At 12:30 GMT on Thursday, the Q1 advance Gross Domestic Product (GDP) print drops alongside the March Personal Consumption Expenditures Price Index (PCE), with consensus pointing to GDP at 2.3% annualized versus a prior 0.5%, headline PCE at 3.5% YoY, and core PCE at 3.2% YoY, both up on prior. Initial Jobless Claims and the Q1 Employment Cost Index land in the same window, with Chicago Purchasing Managers Index (PMI) at 13:45 GMT. Friday brings the Institute for Supply Management Manufacturing PMI (ISM Manufacturing PMI) at 14:00 GMT, with the Prices Paid sub-index penciled at 80, a print that would keep the inflation question very much alive. An upside surprise on PCE or ISM Prices Paid, and the three officials who wanted the easing bias gone start to look less like outliers and more like the new center of gravity. Add another Trump Truth Social post on Iran, and the question of whether the Dow can crack 48,900 from above starts to look like the wrong question entirely.
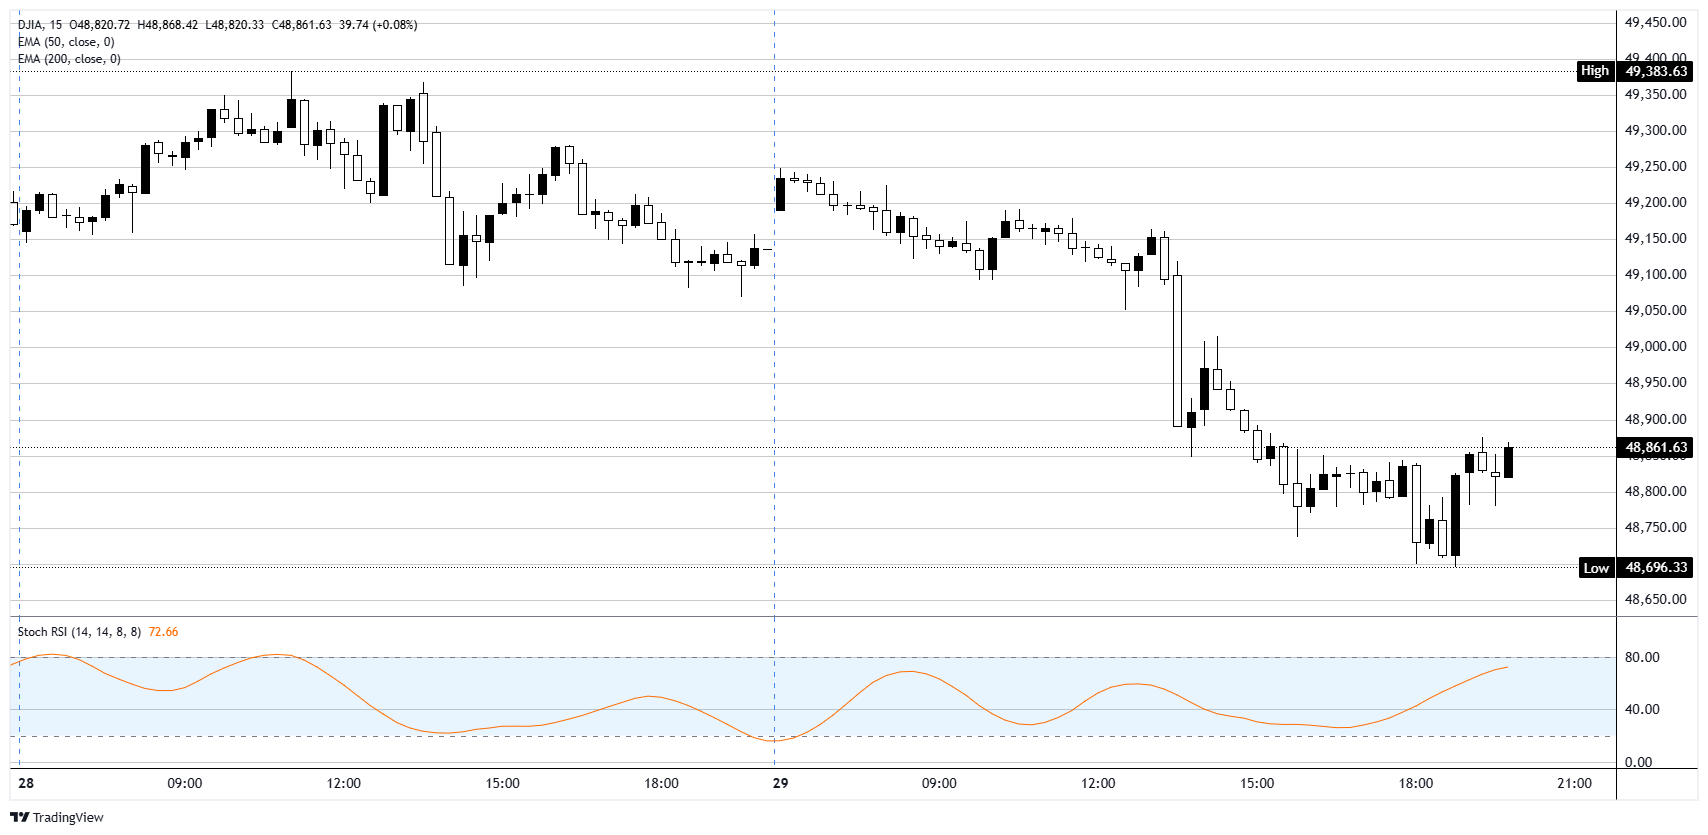
Dow Jones 15-minute chart
Dow Jones FAQs
The Dow Jones Industrial Average, one of the oldest stock market indices in the world, is compiled of the 30 most traded stocks in the US. The index is price-weighted rather than weighted by capitalization. It is calculated by summing the prices of the constituent stocks and dividing them by a factor, currently 0.152. The index was founded by Charles Dow, who also founded the Wall Street Journal. In later years it has been criticized for not being broadly representative enough because it only tracks 30 conglomerates, unlike broader indices such as the S&P 500.
Many different factors drive the Dow Jones Industrial Average (DJIA). The aggregate performance of the component companies revealed in quarterly company earnings reports is the main one. US and global macroeconomic data also contributes as it impacts on investor sentiment. The level of interest rates, set by the Federal Reserve (Fed), also influences the DJIA as it affects the cost of credit, on which many corporations are heavily reliant. Therefore, inflation can be a major driver as well as other metrics which impact the Fed decisions.
Dow Theory is a method for identifying the primary trend of the stock market developed by Charles Dow. A key step is to compare the direction of the Dow Jones Industrial Average (DJIA) and the Dow Jones Transportation Average (DJTA) and only follow trends where both are moving in the same direction. Volume is a confirmatory criteria. The theory uses elements of peak and trough analysis. Dow’s theory posits three trend phases: accumulation, when smart money starts buying or selling; public participation, when the wider public joins in; and distribution, when the smart money exits.
There are a number of ways to trade the DJIA. One is to use ETFs which allow investors to trade the DJIA as a single security, rather than having to buy shares in all 30 constituent companies. A leading example is the SPDR Dow Jones Industrial Average ETF (DIA). DJIA futures contracts enable traders to speculate on the future value of the index and Options provide the right, but not the obligation, to buy or sell the index at a predetermined price in the future. Mutual funds enable investors to buy a share of a diversified portfolio of DJIA stocks thus providing exposure to the overall index.
Recommended Articles


