



Starknet Price Forecast: STRK rally tests key breakout amid proposed Layer-1 transition

Source Fxstreet
  • Starknet is up 16% so far on Friday, advancing the 13% rally from the previous day.
  • Eli Ben-Sasson, CEO of StarkWare, proposed transitioning Starknet to Layer-1 to achieve quantum security by 2027.
  • The technical outlook for STRK is bullish, with bulls focused on breaking above the eight-month-long resistance level near $0.05940.

Starknet (STRK) is up 16% so far on Friday, advancing its steady recovery of nearly 200% since mid-August. The rally aligns with the rising demand for financial anonymity in the cryptocurrency market and the CEO of StarkWare, Eli Ben-Sasson’s proposed transition of Starknet to Layer-1 to achieve quantum security by 2027. The technical outlook for STRK is bullish, suggesting upside potential toward the $0.1000 psychological milestone. 

Starknet poised for Layer-1 transition to achieve quantum safety

Eli Ben-Sasson, CEO of StarkWare, the parent company of the decentralized layer-2 protocol Starknet, proposed a potential upgrade to the Layer-1 network in a social media post on Thursday. This upgrade will transition Starknet from Ethereum’s network to its own and focus on achieving security from quantum-computing and AI-related threats.
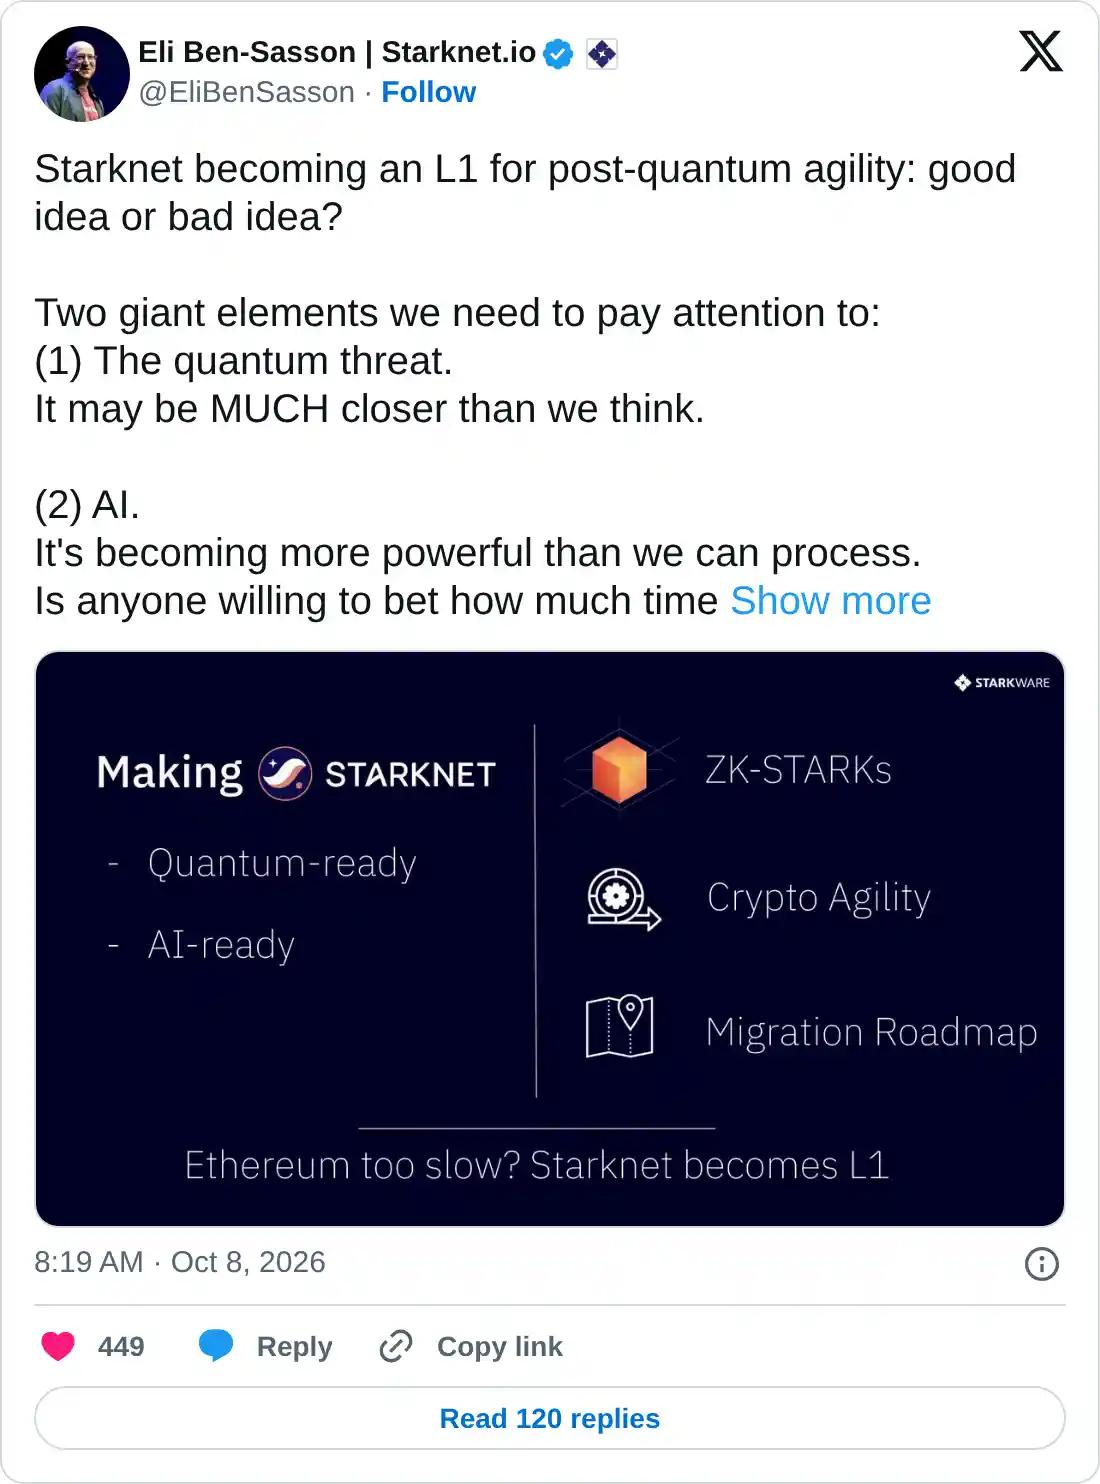
https://x.com/EliBenSasson/status/2108110129572741426

Technical outlook: Starknet rally eyes $0.10 as bullish pressure mounts

Starknet trades at an eight-month high above $0.06400 at press time on Friday, extending a strong bullish phase from the August 18 low of $0.02222. The STRK token price holds well above the 50-, 100-, and 200-day Exponential Moving Averages (EMAs) at $0.03945, $0.03604, and $0.04127, respectively, hinting at a constructive underlying trend.

From a technical perspective, STRK's rally tests the bullish breakout above the February 3 high of $0.05970, which previously capped gains at the May 7 high of around $0.05944. A Fibonacci retracement from the May 7 high at $0.05944 to the August 22 low at $0.02222 highlights the 127.2% and 161.8% extension levels at $0.07768 and $0.10918, respectively, if price secures a bullish close above $0.06000.

Momentum on the daily chart warns of an overstretched rally, with the Relative Strength Index (RSI) around 72 in overbought territory, while the Moving Average Convergence Divergence (MACD) remains positive, holding above its signal line, suggesting firm bullish momentum.

Chart Analysis STRK/USDT (Binance)
STRK/USDT daily price chart.

On the downside, initial support is seen at the former swing area around the $0.05000 psychological threshold, reinforced by Wednesday's low around $0.04825. Any deeper pullback could expose the 200-day EMA at $0.04127.

(The technical analysis of this story was written with the help of an AI tool. Know more.)

Disclaimer: For information purposes only. Past performance is not indicative of future results.
placeholder
1 in 5 US Tax Dollars Are Now Funding Interest and Yields Keep RisingMore than 1 in 5 US tax dollars now goes to interest on the national debt, while the 10-year Treasury yield sits near a 24-year high. That surge has yet to fully reach the federal budget.The Congressi
Author  Beincrypto
16 hours ago
More than 1 in 5 US tax dollars now goes to interest on the national debt, while the 10-year Treasury yield sits near a 24-year high. That surge has yet to fully reach the federal budget.The Congressi
placeholder
Current S&P 500 Bull Market Turns 4 Monday and History Suggests More to ComeThe S&P 500 bull market turns 4 on Monday, up 119% to a record from its October 2022 low. Six past runs kept going after turning 4, though four bear markets later pushed the index below its birthday l
Author  Beincrypto
16 hours ago
The S&P 500 bull market turns 4 on Monday, up 119% to a record from its October 2022 low. Six past runs kept going after turning 4, though four bear markets later pushed the index below its birthday l
placeholder
Bitcoin Price Flashes a Hidden Uptrend Signal Amid One 96% ProblemBitcoin (BTC) price trades near $82,300, still up about 28% over three months after this week’s drop.A hidden momentum signal on the daily chart suggests the uptrend can survive. The catch is that buy
Author  Beincrypto
16 hours ago
Bitcoin (BTC) price trades near $82,300, still up about 28% over three months after this week’s drop.A hidden momentum signal on the daily chart suggests the uptrend can survive. The catch is that buy
placeholder
Bitcoin Returns to ETF Holders’ Breakeven Price, and $729 Million Heads for the ExitUS spot Bitcoin (BTC) exchange-traded fund (ETF) investors pulled $729 million over two sessions this week. The selling hit just as BTC returned to the funds’ estimated average entry price, suggesting
Author  Beincrypto
16 hours ago
US spot Bitcoin (BTC) exchange-traded fund (ETF) investors pulled $729 million over two sessions this week. The selling hit just as BTC returned to the funds’ estimated average entry price, suggesting
placeholder
JPMorgan Favors 2 Stocks Amid Rising US Interest RatesJPMorgan has a warning for anyone holding smaller company stocks. Government debt is driving long-term bond yields higher, and smaller stocks could pay the price.The bank put a number on it. Only 9% o
Author  Beincrypto
Yesterday 01: 40
JPMorgan has a warning for anyone holding smaller company stocks. Government debt is driving long-term bond yields higher, and smaller stocks could pay the price.The bank put a number on it. Only 9% o
goTop
quote