




Cardano Price Forecast: ADA tumbles below $0.25 as retail participation dips
- Cardano logs three straight days of declines, with the price sliding below $0.2500 on Thursday.
- Weakening demand for ADA derivatives drives perpetual futures Open Interest and trading volume down.
- Technically, Cardano is supported by major moving averages, but downtrending momentum indicators cap recovery potential.
Cardano's (ADA) technical structure is shifting on Thursday, resulting in sustained losses for three straight days. The token remains below the pivotal $0.2500 level after a sharp decline of more than 10%, and trades below $0.2300 at the time of writing, weighed down by softening momentum indicators. Meanwhile, near-term support remains structurally solid, reinforced by major moving averages.
Cardano derivatives face outflows
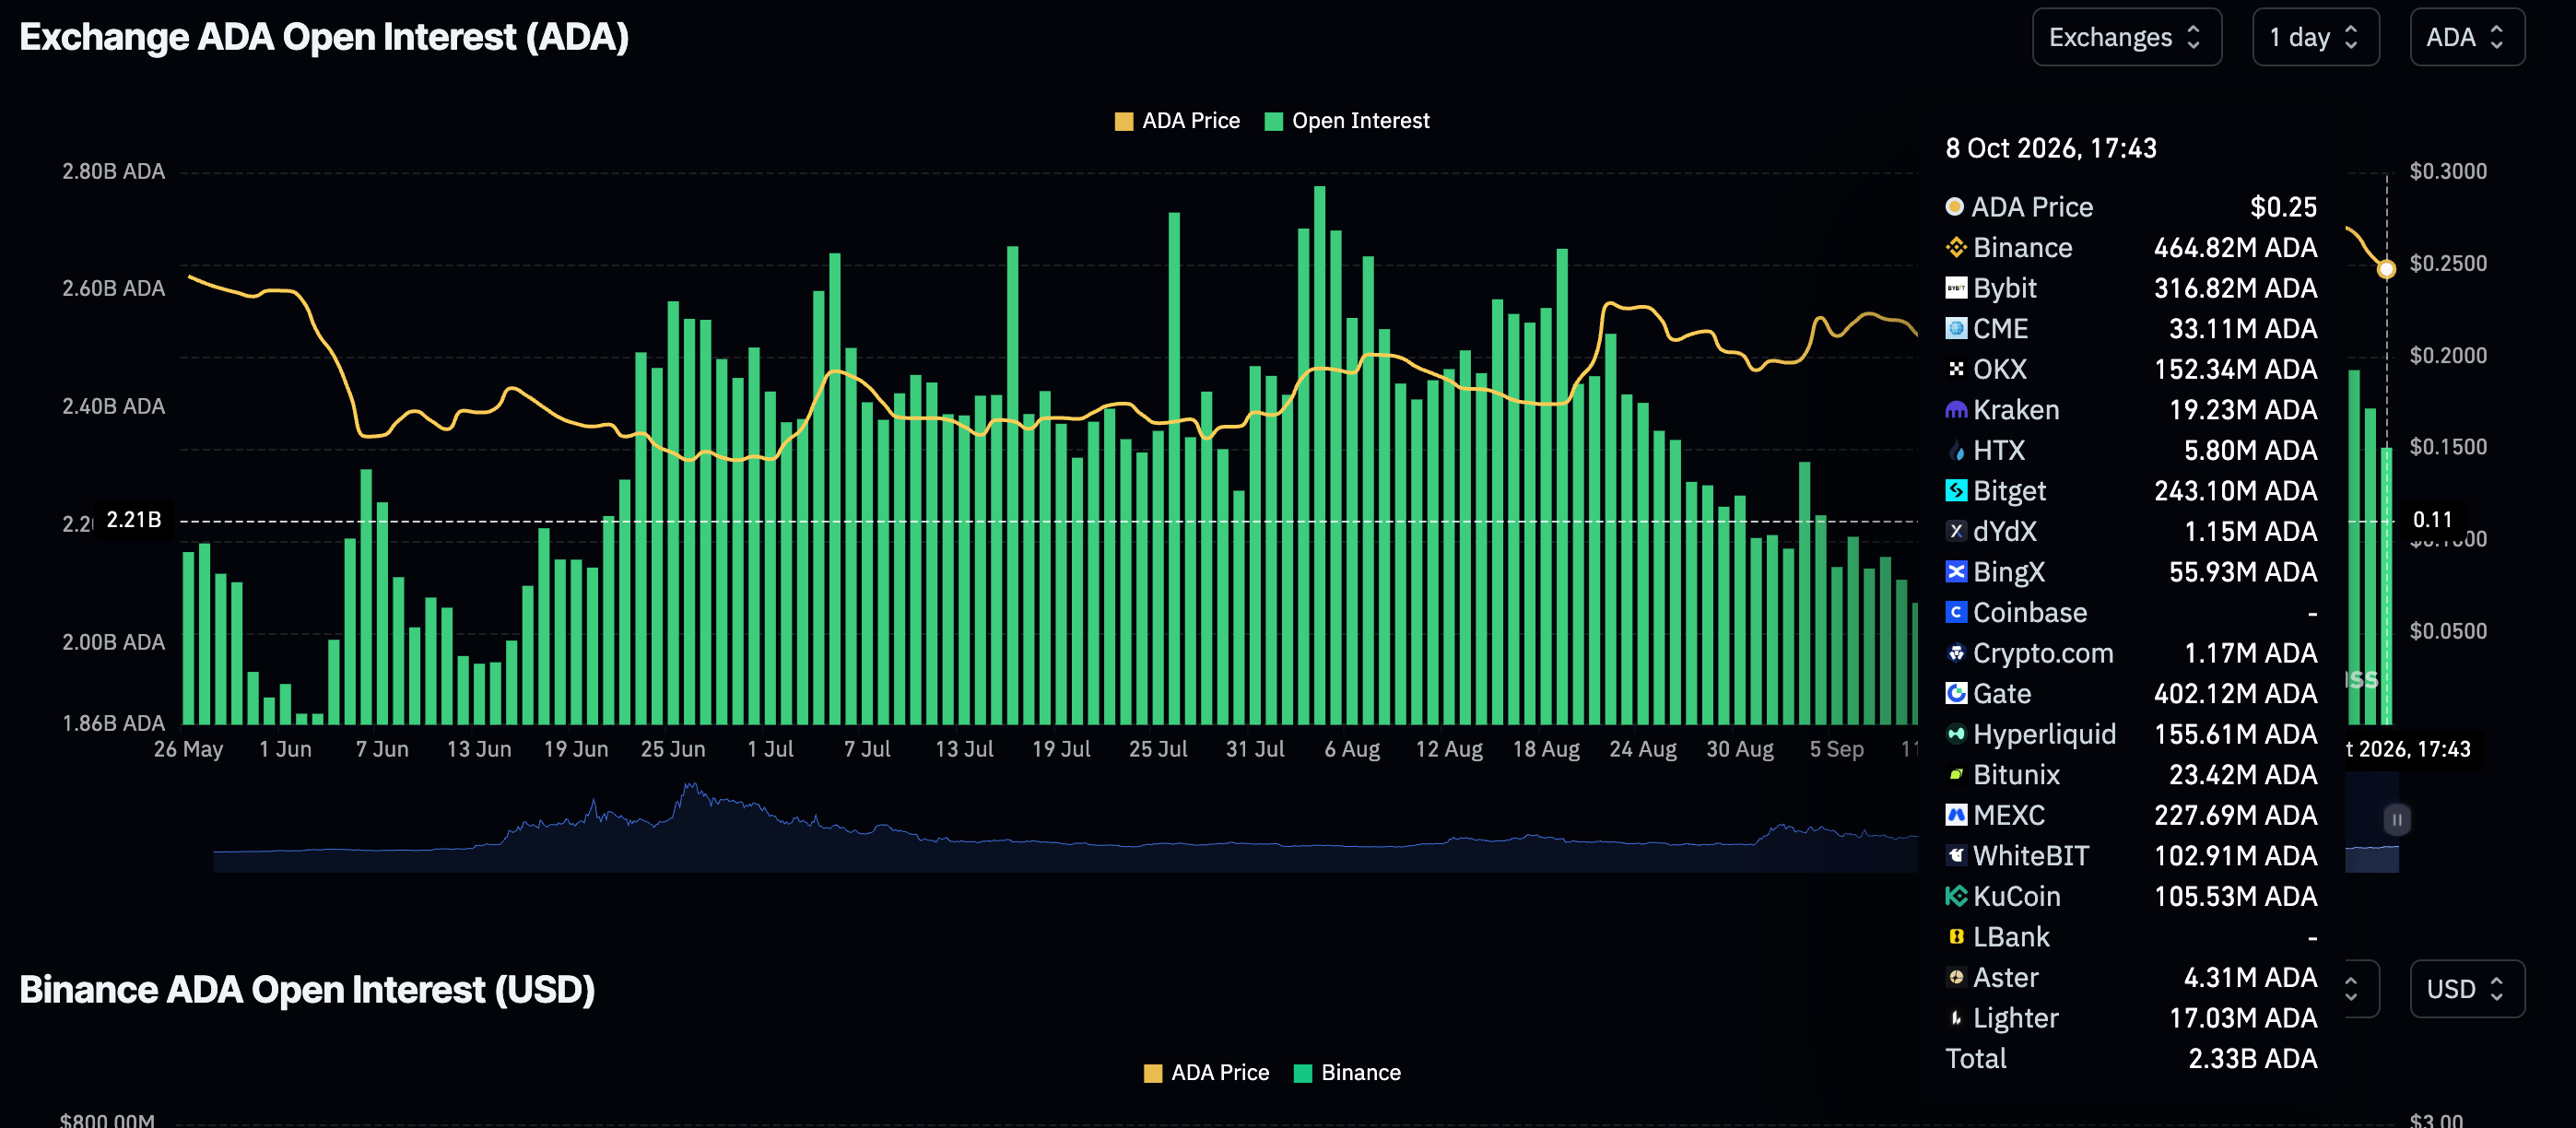
The Cardano derivatives market signals a fading outlook, as perpetual futures Open Interest (OI) fell to 2.3 billion ADA on Thursday, down from 2.5 billion ADA the previous day. This cool-down aligns with broad sell-side pressure witnessed in the spot market and dims Cardano’s recovery potential, especially if it is sustained.
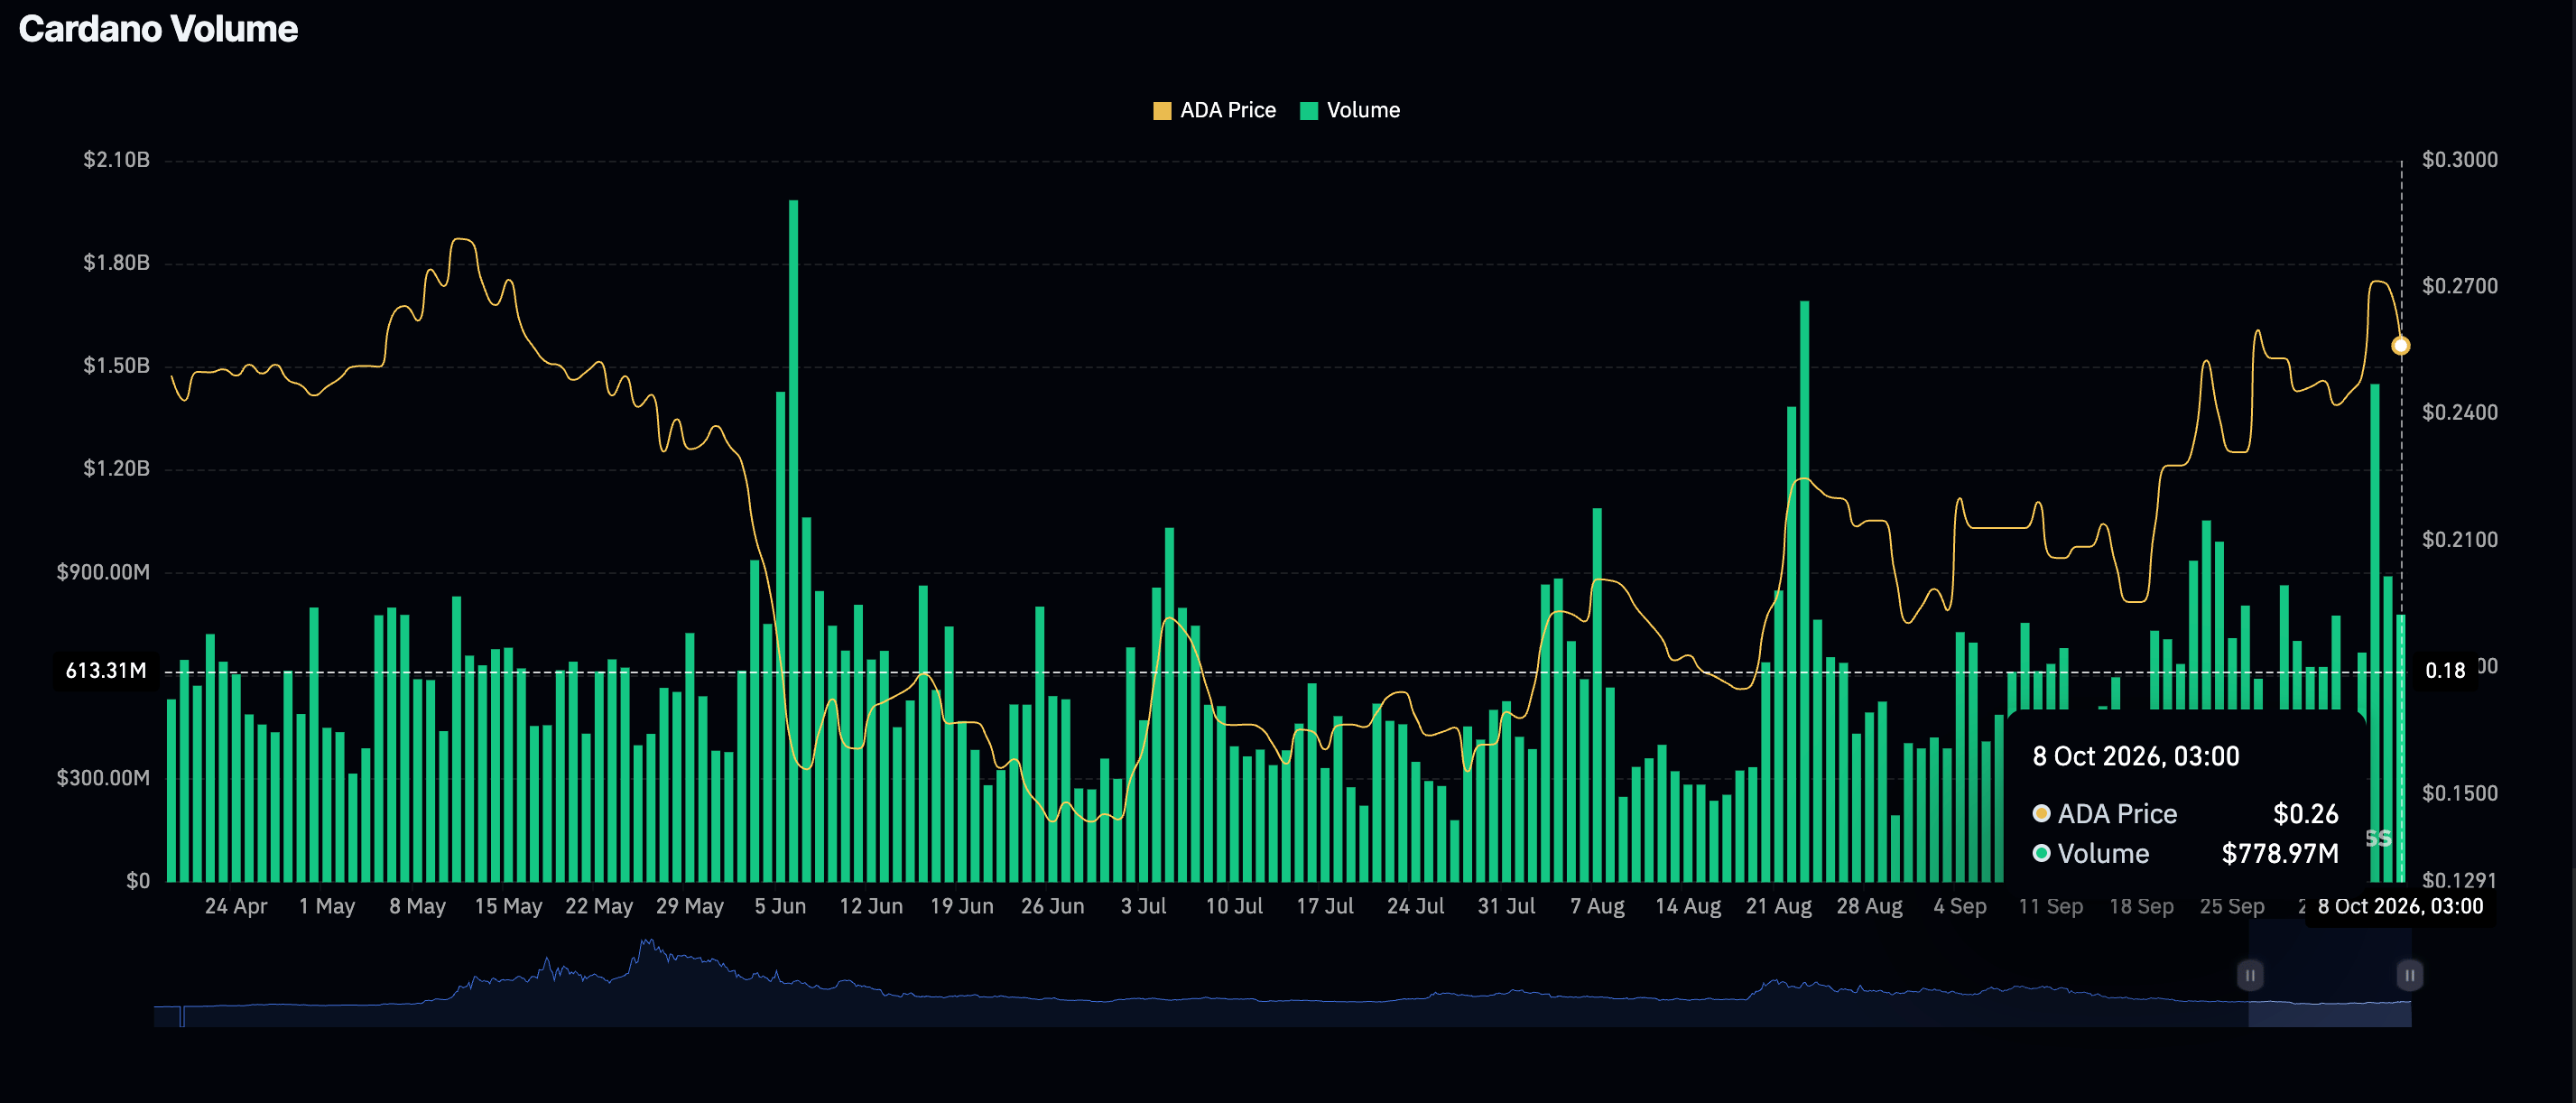
A notable drop in trading volume reinforces the notion of shrinking retail participation. Volume, according to CoinGlass data, stands at $779 million on Thursday, down from $890 million the day before and $1.45 billion on Tuesday.
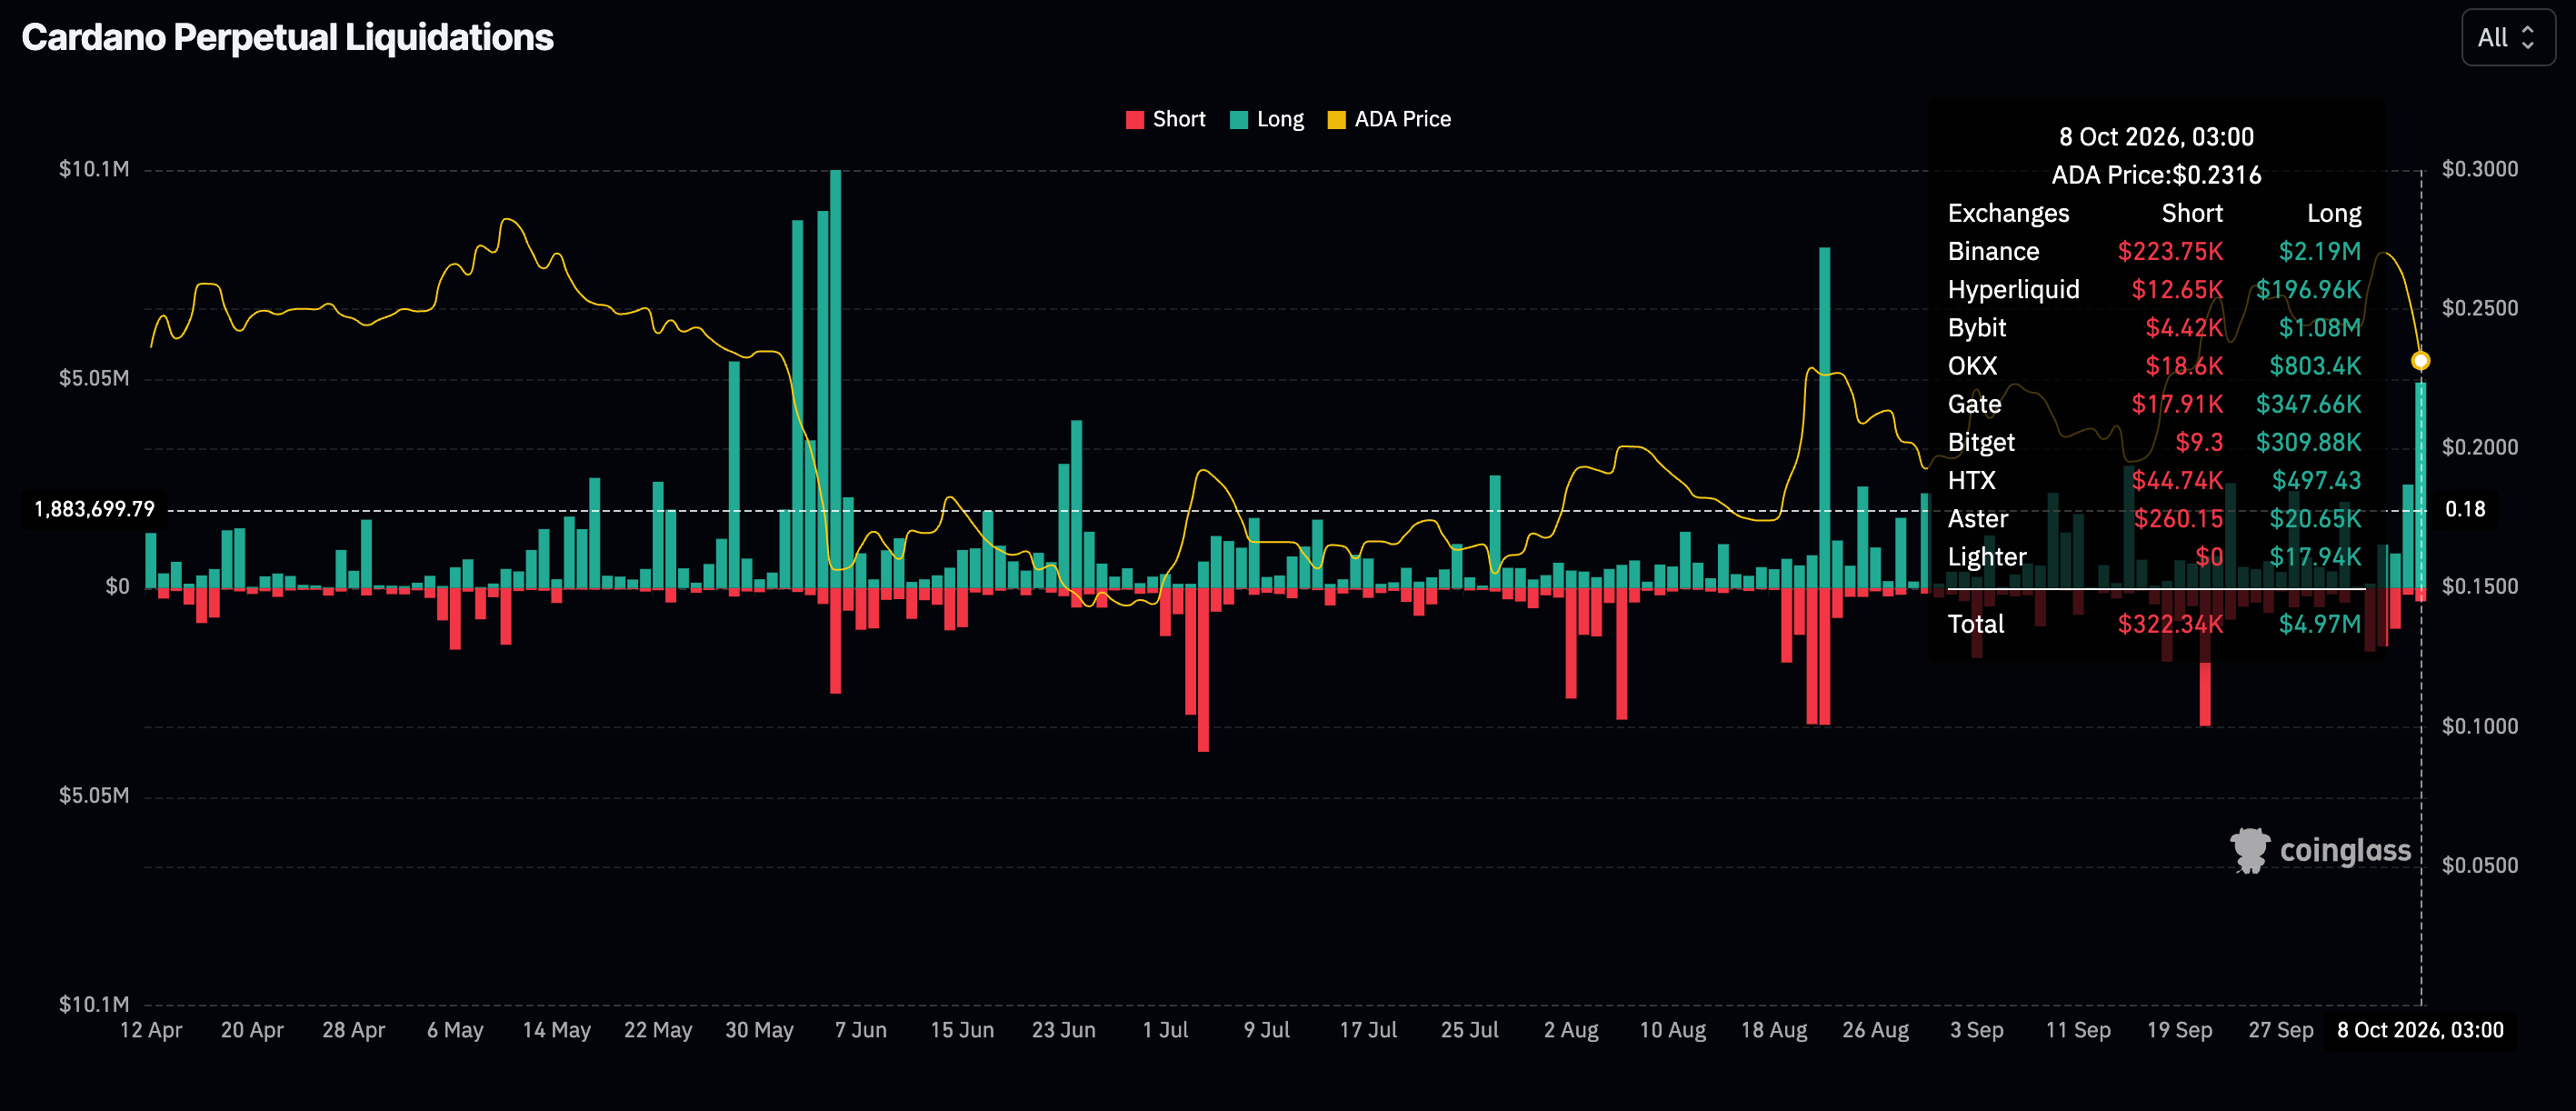
The sticky sell-side pressure this week has left many traders coating losses, including roughly $5 million in liquidated long positions compared to only $322,000 in short positions. An extended decline may continue to push more long traders to the edge and into deeper losses through forced selling.
Technical analysis: ADA headwinds put recovery at risk
Cardano falls for the third straight day and trades below $0.2300, aligning with broader crypto market headwinds this week. Still, the pair holds above a dense bullish structure, with price above the 50-day, 100-day, and 200-day Exponential Moving Averages (EMAs), while the SuperTrend line at $0.2243 reinforces the underlying demand area.
The Relative Strength Index (RSI) at 44 leans bearish, and the Moving Average Convergence Divergence (MACD) has slipped below zero, hinting that momentum is increasingly bearish.
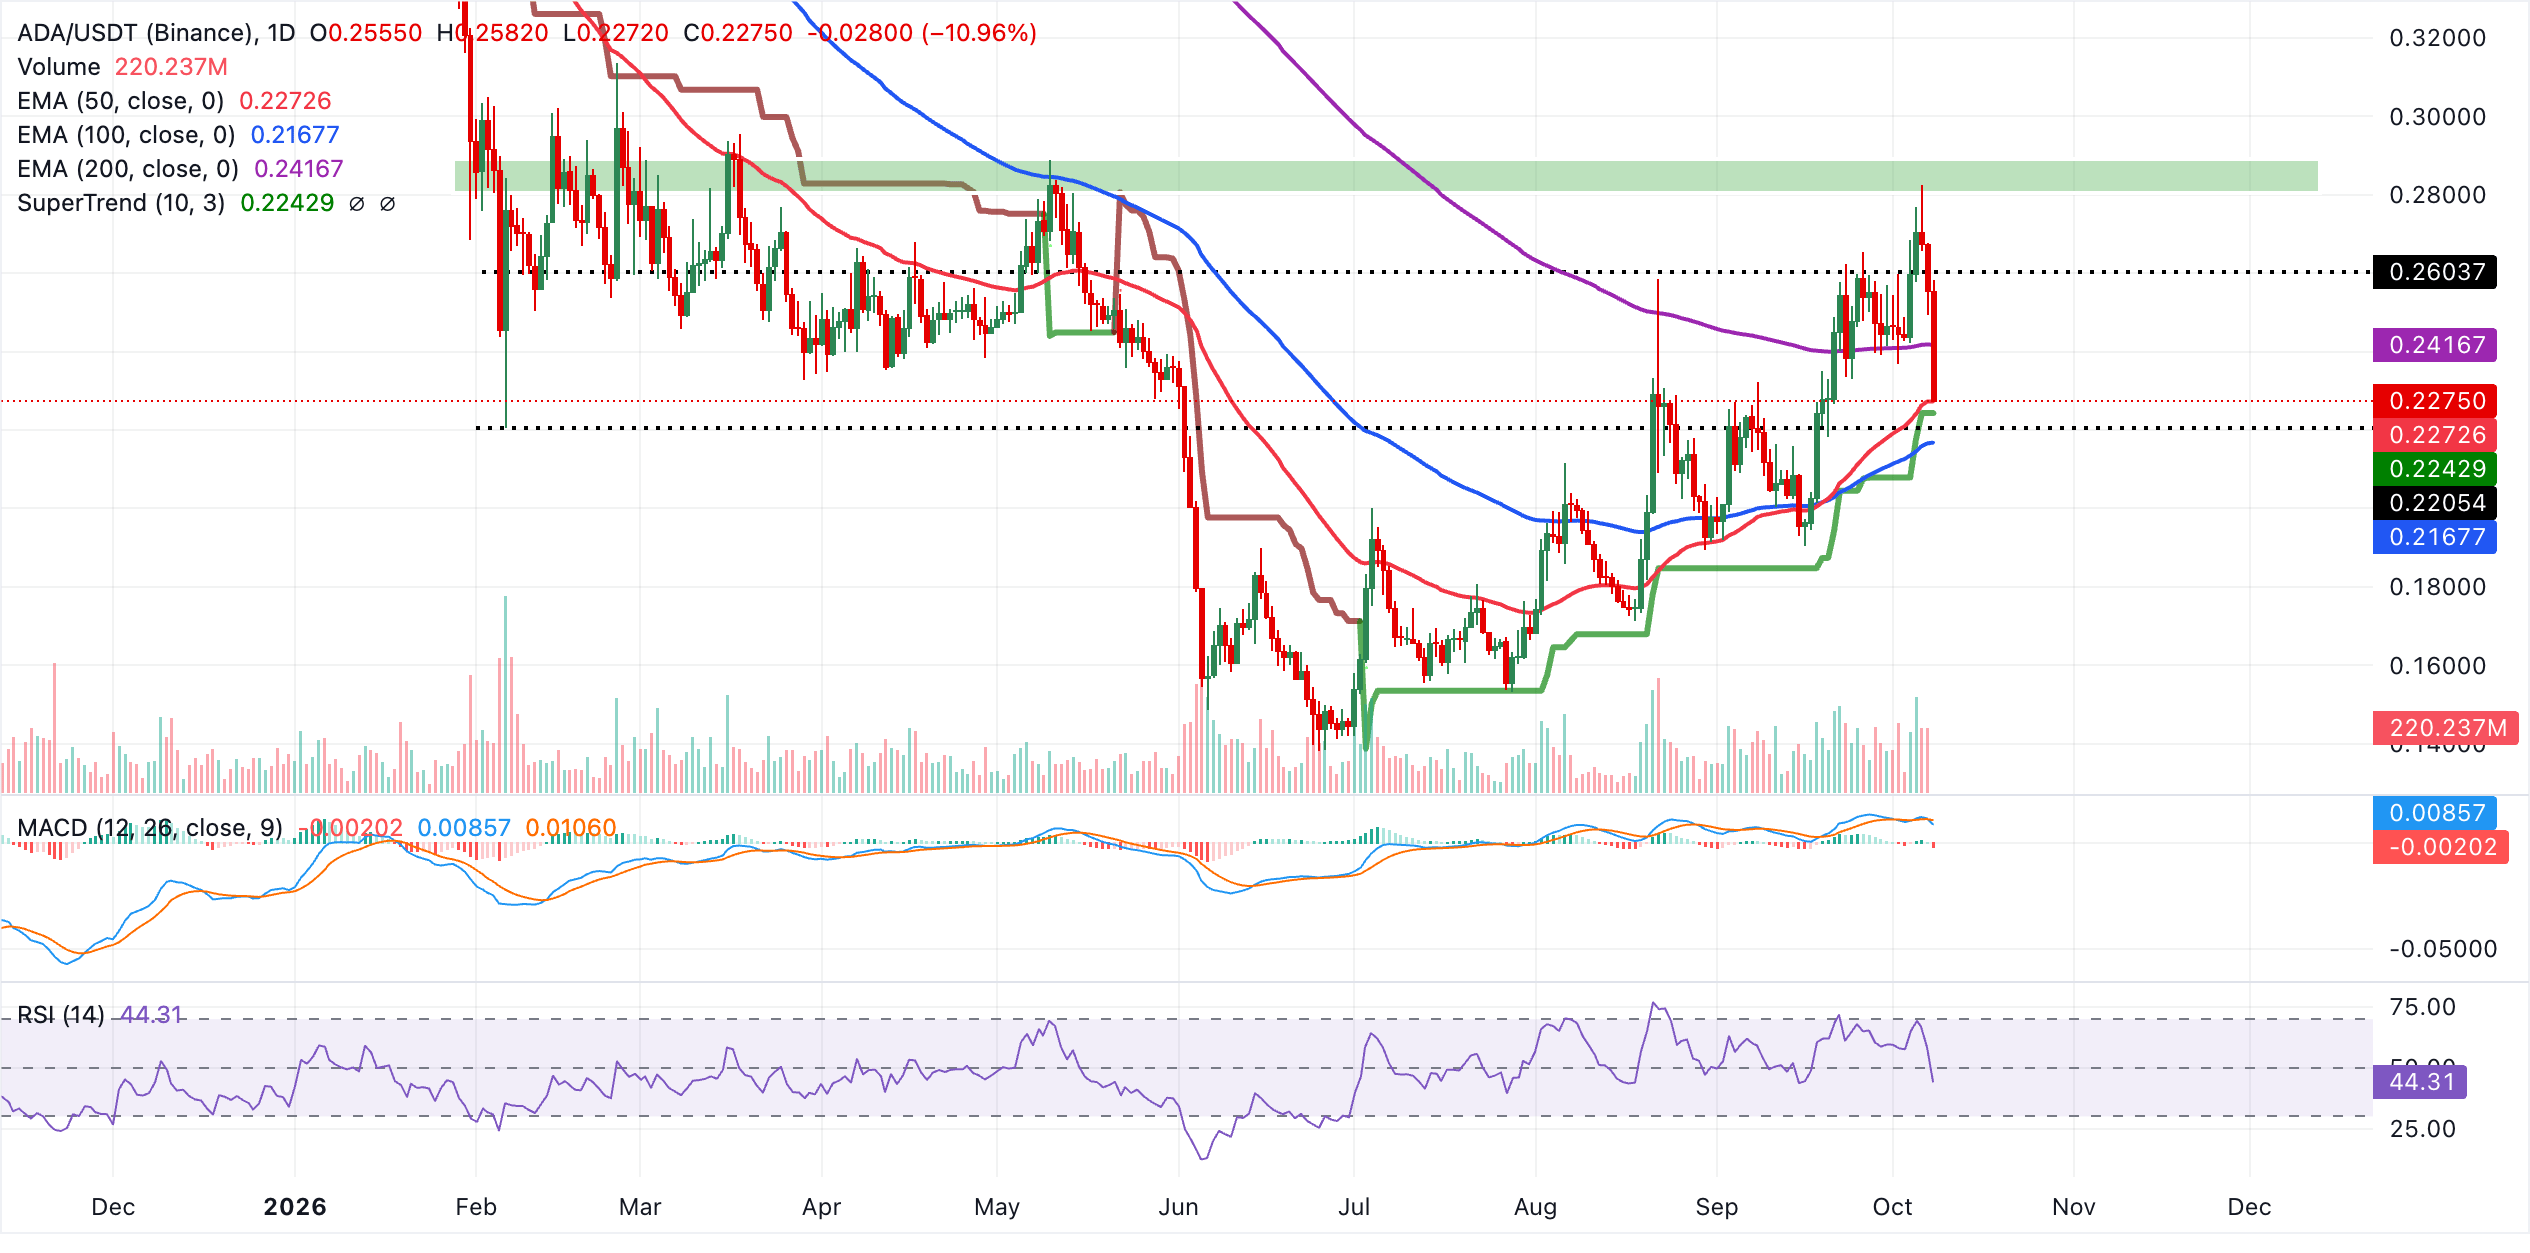
Immediate support lies at the 50-day EMA near $0.2272 and the SuperTrend zone at $0.2243, before deeper demand emerges around the 100-day EMA at $0.2168. As long as ADA holds above this stacked support cluster, the near-term bias stays tilted to the upside, with any pullback likely to be treated as a corrective dip.
Despite the above EMA support cluster, Cardano maintains bearish near-term bias on the weekly chart. The 50-week EMA at $0.3062, the 100-week EMA at $0.4073 and the 200-week EMA at $0.4585 all sit overhead, suggesting the broader trend remains under downside pressure despite a modest improvement in momentum.
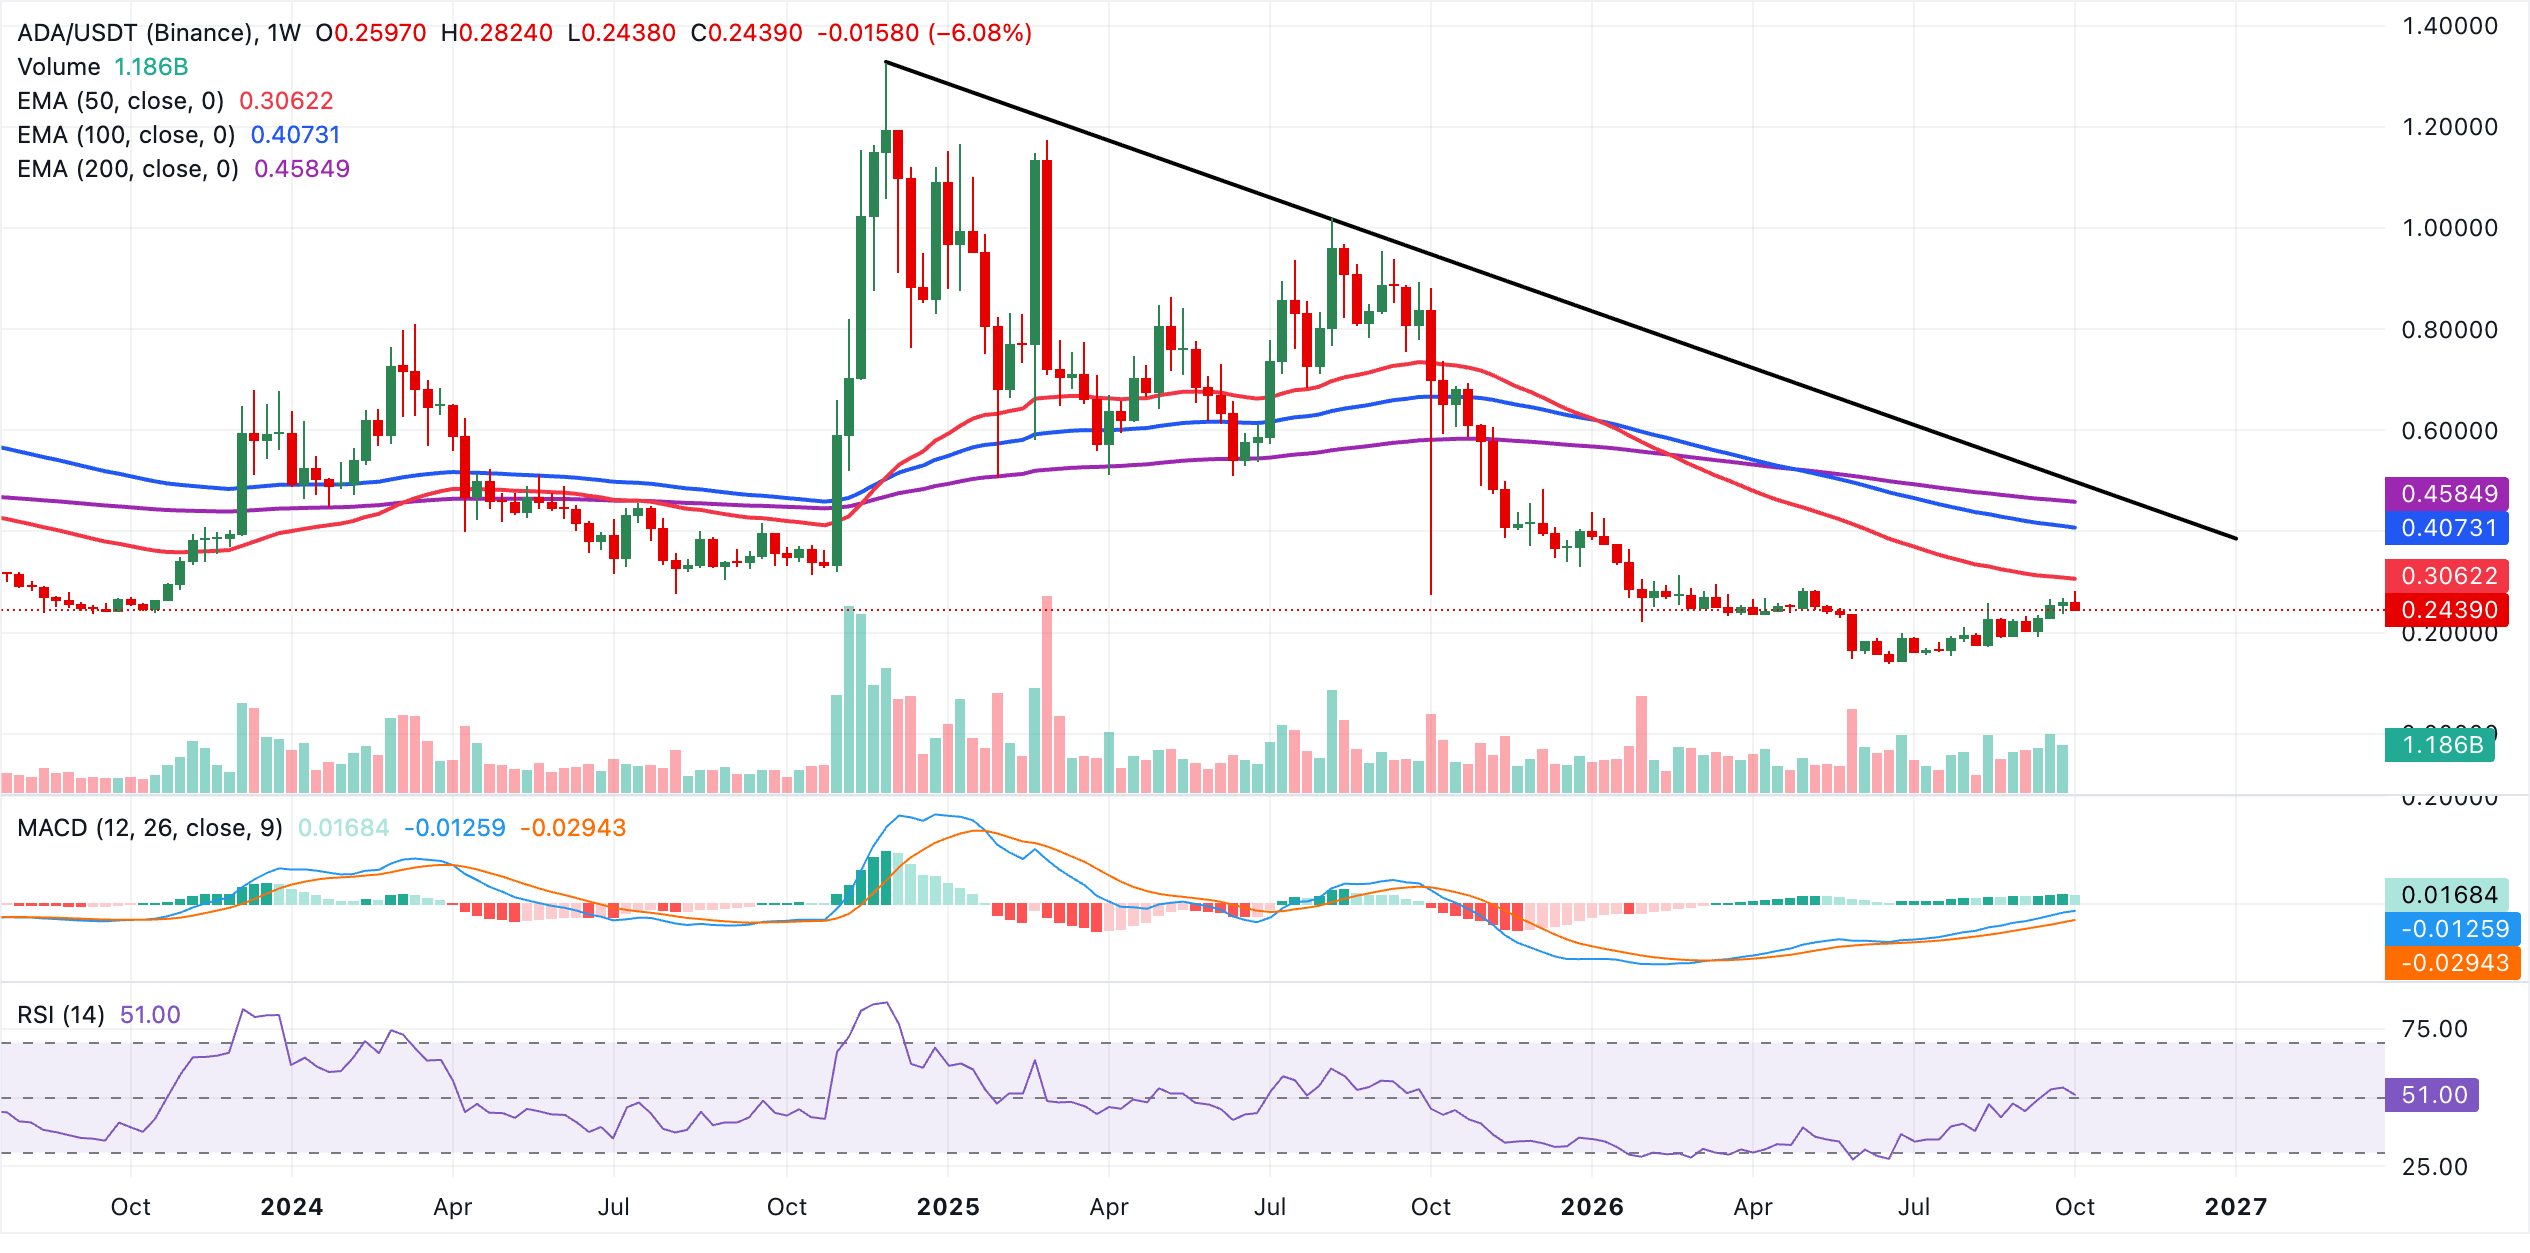
The MACD stays positive and above its signal line, while the histogram has eased slightly from recent highs, hinting at fading bullish momentum rather than a decisive trend shift. Meanwhile, the RSI trades just above 50, pointing to neutral conditions and reinforcing the idea of a capped recovery within a dominant bearish structure.
(The technical analysis of this story was written with the help of an AI tool. Know more.)
Open Interest, funding rate FAQs
Higher Open Interest is associated with higher liquidity and new capital inflow to the market. This is considered the equivalent of increase in efficiency and the ongoing trend continues. When Open Interest decreases, it is considered a sign of liquidation in the market, investors are leaving and the overall demand for an asset is on a decline, fueling a bearish sentiment among investors.
Funding fees bridge the difference between spot prices and prices of futures contracts of an asset by increasing liquidation risks faced by traders. A consistently high and positive funding rate implies there is a bullish sentiment among market participants and there is an expectation of a price hike. A consistently negative funding rate for an asset implies a bearish sentiment, indicating that traders expect the cryptocurrency’s price to fall and a bearish trend reversal is likely to occur.
Recommended Articles


