


ApeCoin price prediction 2026-2032: Will APE recover?
Key takeaways:
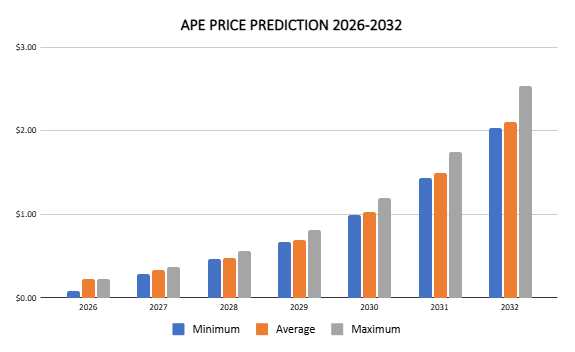
- Our ApeCoin price predictions anticipate a high of $0.23 in 2026.
- In 2028, it will range between $0.46 and $0.56, with an average price of $0.48.
- In 2031, it will range between $1.44 and $1.74, with an average price of $1.49.
Unlike the common meme-token sentiment, ApeCoin (APE) has utility. APE is the native token of ApeChain. The token also has utility at Yuga Labs, the company behind the Otherside metaverse, Bored Ape Yacht Club (BAYC), and Mutant Ape Yacht Club (MAYC) NFTs. These make up the Ape ecosystem.
Will APE reach $1? What will its price be in 2028? Let’s explore these and more in the Cryptopolitan Price Prediction from 2026 to 2032.
Overview
| Cryptocurrency | ApeCoin |
| Symbol | APE |
| Current price | $0.1500 |
| Market cap | $150.03M |
| Trading volume | $24.60M |
| Circulating supply | 1B |
| All-time high | $39.40 on Mar 17, 2022 |
| All-time low | $0.08164 on Apr 3, 2026 |
| 24-hour high | $0.1557 |
| 24-hour low | $0.1466 |
APE price prediction: Technical indicators
| Metric | Value |
| Price volatility | 21.02% (Extremely High) |
| 50-day SMA | $0.1185 |
| 200-day SMA | $0.1865 |
| Sentiment | Bearish |
| Green days | 13/30 (43%) |
| Fear and Greed Index | 34 (Fear) |
APE price analysis
At the time of writing (May 14), APE’s price was down 4.16% over the past 24 hours but up 69.73% over the past 30 days. Its trading volume fell 34.90% in 24 hours, indicating low market conviction
.
APE/USD 1-day chart analysis
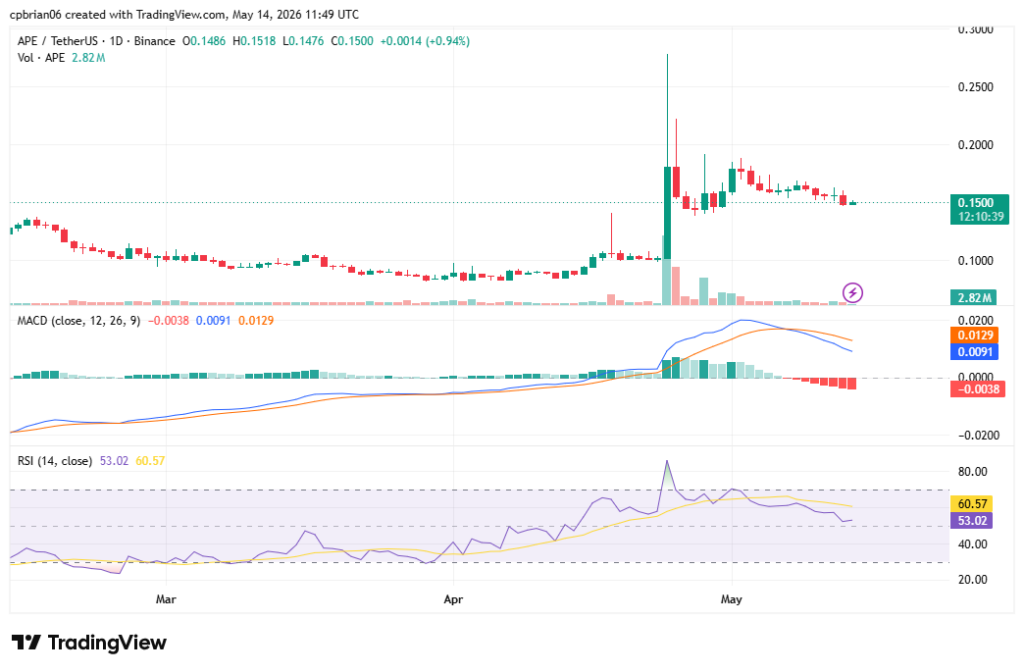
APE fell below $0.50 in 2025 and $0.30 in January 2026. In the third week of January, it fell below $0.20. In April, it fell below $0.10, reaching a new all-time low of $0.082. It later recovered to the current levels. The relative strength index is neutral at 53.02. It is oversold when the value drops below 30. The MACD histograms indicate rising negative momentum.
APE/USD 4-hour chart analysis
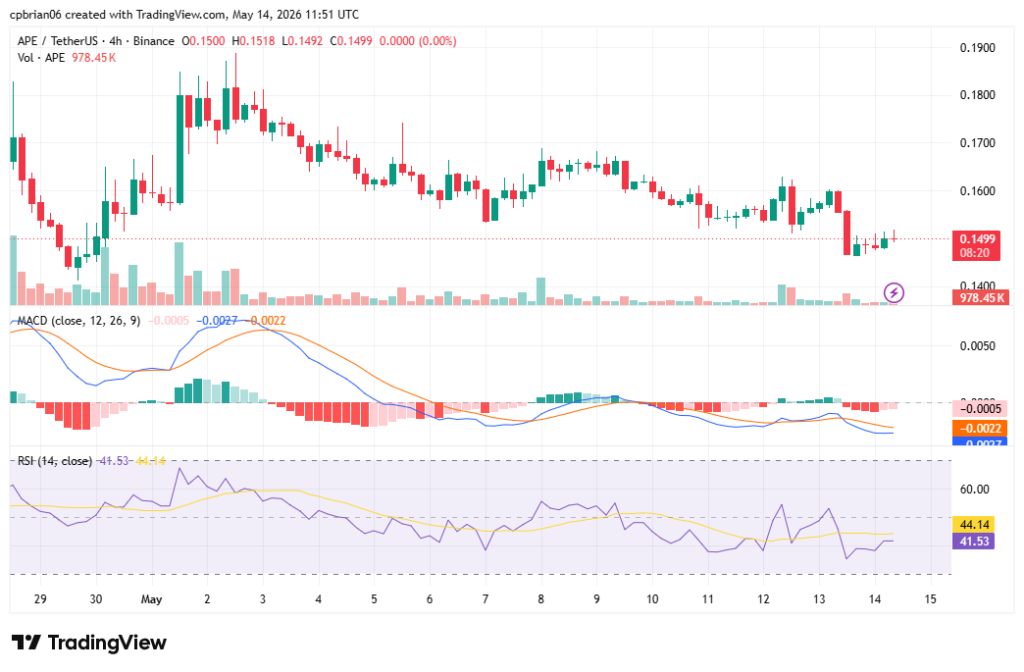
The 4-hour chart highlights APE’s short-term support and resistance levels at $0.1442 and $0.1812, respectively. The coin is correcting from a swing high, with its momentum slowing in the last 8 hours.
APE technical indicators: Levels and action
Daily simple moving average (SMA)
| Period | Value ($) | Action |
| SMA 3 | 0.1536 | SELL |
| SMA 5 | 0.1561 | SELL |
| SMA 10 | 0.1587 | SELL |
| SMA 21 | 0.1574 | SELL |
| SMA 50 | 0.1185 | BUY |
| SMA 100 | 0.1134 | BUY |
| SMA 200 | 0.1865 | SELL |
Daily exponential moving average (EMA)
| Period | Value ($) | Action |
| EMA 3 | 0.1529 | SELL |
| EMA 5 | 0.1550 | SELL |
| EMA 10 | 0.1566 | SELL |
| EMA 21 | 0.1498 | BUY |
| EMA 50 | 0.1329 | BUY |
| EMA 100 | 0.1409 | BUY |
| EMA 200 | 0.2054 | SELL |
What to expect from the APE price analysis next?
APE’s price analysis indicates it is bearish as it corrects from the month’s high. The Fear and Greed Index shows a fear sentiment among traders. Falling trading volumes confirm low conviction in the market trend. Short-term support and resistance levels are at $0.1442 and $0.1812, respectively.
Why is APE down?
Bitcoin led the bullish wave. ApeCoin, with a high beta, rallied in tandem, outperforming slightly. There was no specific, verifiable catalyst for APE’s recovery.
Can ApeCoin reach $1?
Per our Cryptopolitan price prediction, APE will break above $1 in 2030, driven by the growing utility and applications, such as in the metaverse.
Will APE reach $100?
It is unlikely that the APE price will reach $100 in the foreseeable future. At such a valuation, APE will be more valuable than the USDT stablecoin, which is more of a ‘household’ cryptocurrency.
Can Ape coin hit $1000?
It is unlikely that the APE price will reach $1000 before 2031.
Does ApeCoin have a future?
With the launch of ApeChain, ApeCoin now has greater utility and is therefore much more likely to endure.
How much is ApeCoin worth in 2026?
For 2026, the APE coin price is expected to range between $0.10 and $0.33. The average price for the year will be $0.22.
Recent news
While Solana’s low fees attracted new users, the dissolution of the ApeCoin DAO (with 99.66% approval) alienated decentralization advocates. ApeCoin’s 10M APE treasury allocation ($3.72M) added inflationary pressure.
Is Ape a good investment?
Latest ApeCoin moves are primarily a function of a stronger crypto market, lacking its own catalyst to drive independent momentum. This year’s trend is characterized by higher lows and record-low prices.
APE price prediction May 2026
The APE May price prediction ranges between $0.10 and $0.33, with an average closing price of $0.22.
| Month | Potential low ($) | Potential average ($) | Potential high ($) |
| May | 0.10 | 0.22 | 0.33 |
APE price prediction 2026
For 2026, the APE coin price is expected to range between $0.078 and $0.23. The average price for the year will be $0.22.
| Year | Potential low ($) | Potential average ($) | Potential high ($) |
| 2026 | 0.078 | 0.22 | 0.23 |
APE price prediction 2027-2032
| Year | Potential low ($) | Potential average ($) | Potential high ($) |
| 2027 | 0.28 | 0.33 | 0.37 |
| 2028 | 0.4600 | 0.4800 | 0.5600 |
| 2029 | 0.6700 | 0.6900 | 0.8100 |
| 2030 | 0.9900 | 1.03 | 1.1900 |
| 2031 | 1.4400 | 1.49 | 1.7400 |
| 2032 | 2.0300 | 2.1100 | 2.5400 |
Apecoin price prediction 2027
The year 2027 will experience bullish momentum. According to APE price movements, it will range from $0.28 to $0.37, with an average price of $0.33.
APE price prediction 2028
The Apecoin key price levels continue to climb in 2028. According to the prediction, it will range between $0.46 and $0.56, with an average trading price of $0.48.
APE price prediction 2029
According to our APE price prediction, APE will trade between $0.67 and $0.81. It will average at $0.69.
Apecoin APE price prediction 2030
According to our Apecoin price forecast for 2030, the price will range from a minimum of $1.19 to a maximum of $0.99, with an annual average of $1.03.
APE prediction 2031
The ApeCoin price prediction for 2031 is $1.44 to $1.74, with an average of $1.49.
Apecoin price prediction 2032
APE will trade higher in 2032, ranging between $2.03 and $2.54. The average price for the year will be $2.11.
APE market price prediction: Analysts’ APE price forecast’
| Platform | 2026 | 2027 | 2028 |
| Coincodex | $0.1314 | $0.1216 | $0.06356 |
| Gate.com | $0.1510 | $0.1668 | $0.1885 |
Cryptopolitan’s APE price predictions
Our predictions indicate that Apecoin price movements will reach a high of $0.23 in 2026. In 2028, the price range is expected to be between $0.46 and $0.56, with an average price of $0.48. In 2031, it will range between $2.03 and $2.54, with an average price of $2.11. Note that the predictions are not investment advice. Seek independent professional consultation or do your research.
APE historic price sentiment
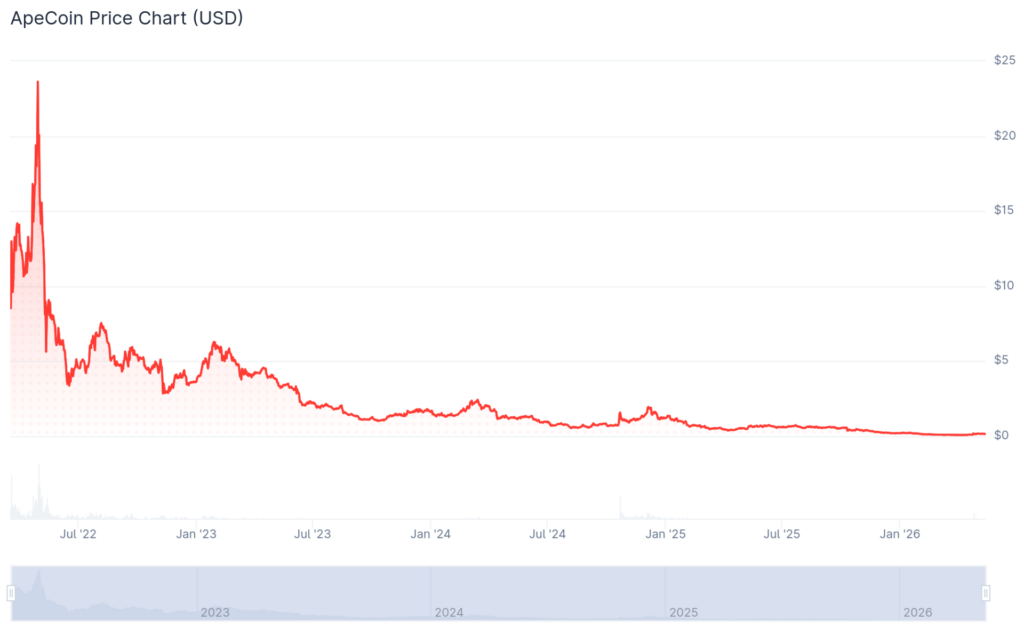
APE price history. Image by CoinGecko
- Yuga Labs founded the ApeDAO in 2022. 62% of the tokens were allocated to the ApeDAO. 15% to BAYC and MAYC NFT holders, 16% to Yuga Labs, 14% to launch contributors, and 8% to BAYC founders.
- APE was distributed and began trading on March 17, 2022, at $7.26.
- The year 2022 closed with APE trading at $3.
- It remained bearish for the first three quarters of 2023. In October, it had dropped to $1.09.
- The crypto market sentiment shifted in October as institutional interest in electronic trading funds rose. As the global crypto market cap surpassed $2 trillion, APE also broke above $2.
- The bull run continued in 2024, pushing APE as high as $2.43. The market started reversing afterward, and by June, it had fallen below $1. It crossed into August, trading at $0.71.
- In September, it rose to $0.87 but later corrected, falling to the $0.67 mark in October. After the launch of the Apechain, APE pumped, rising above $1 in November and peaking at $2.17 in early December, after which it started correcting.
- It crossed into 2025, trading at $1.20. It then underwent a bearish run, and by February, it had fallen to $0.70, and by April, it had further declined to $0.50. It recovered in May, rising above $0.65 and $0.69 in June. It fell to $0.40 in October and $0.21 in December.
- In January 2026, it peaked at $0.24, then turned bearish, falling to $0.10. On April 3, it registered a new all-time low at $0.08164.
- Towards the end of April, it quickly corrected, gaining over 100% in a matter of days. In May, it traded at $0.15.
Recommended Articles


