


Can Intel Stock Hit $100 in May?
Intel (INTC) stock closed Friday at $82.54, capping a roughly 100% surge in a single month and printing fresh all-time highs, as traders now ask whether $100 is reachable before May ends.
The post-earnings melt-up has pushed Intel into deeply overbought territory while bearish options positioning quietly builds. Whether the chip giant breaks higher or pulls back from here now hinges on a single chart pattern forming on the two-day timeframe.
Intel Stock Volume Divergence Flashes Warning at Overbought RSI
Intel stock has rallied for seven months on the two-day chart, but volume has been thinning the entire way. Between September 17 and April 23, price trended steadily higher while traded volume trended in the opposite direction.
That gap is a classic volume divergence, a warning that conviction behind the move is fading.
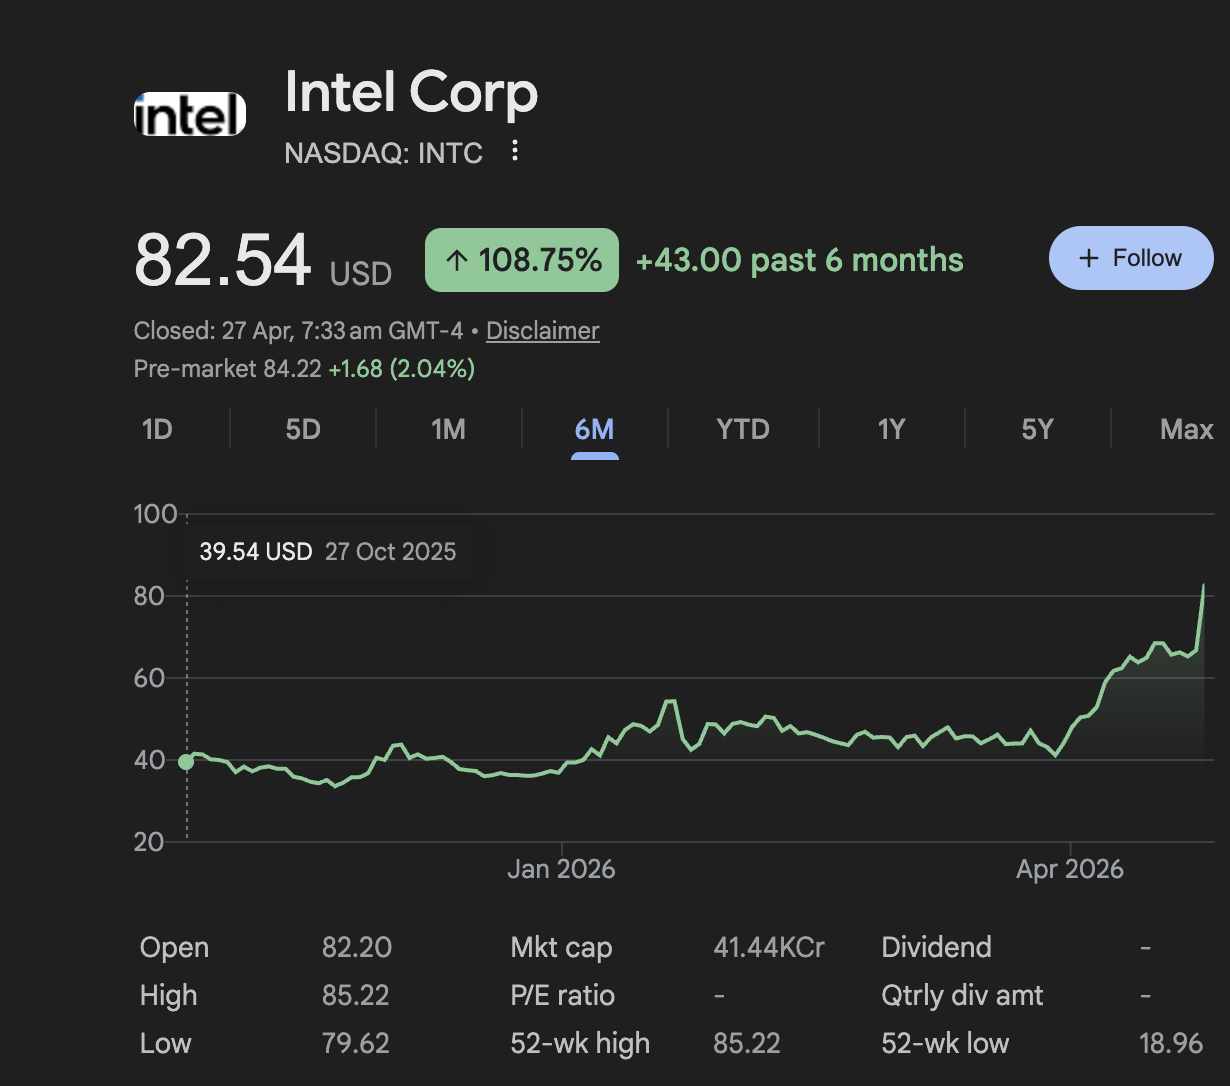 Intel Price Action: Google Finance
Want more insights like this? Sign up for Editor Harsh Notariya’s Daily Newsletter here.
The Relative Strength Index (RSI), a momentum indicator, just printed 80.92. That marks the second time INTC has tagged this exact overbought zone in less than a year.
The first hit came in early 2026, and the stock corrected by roughly 23% in the days that followed. The same volume divergence preceded that pullback, and the same divergence is present now.
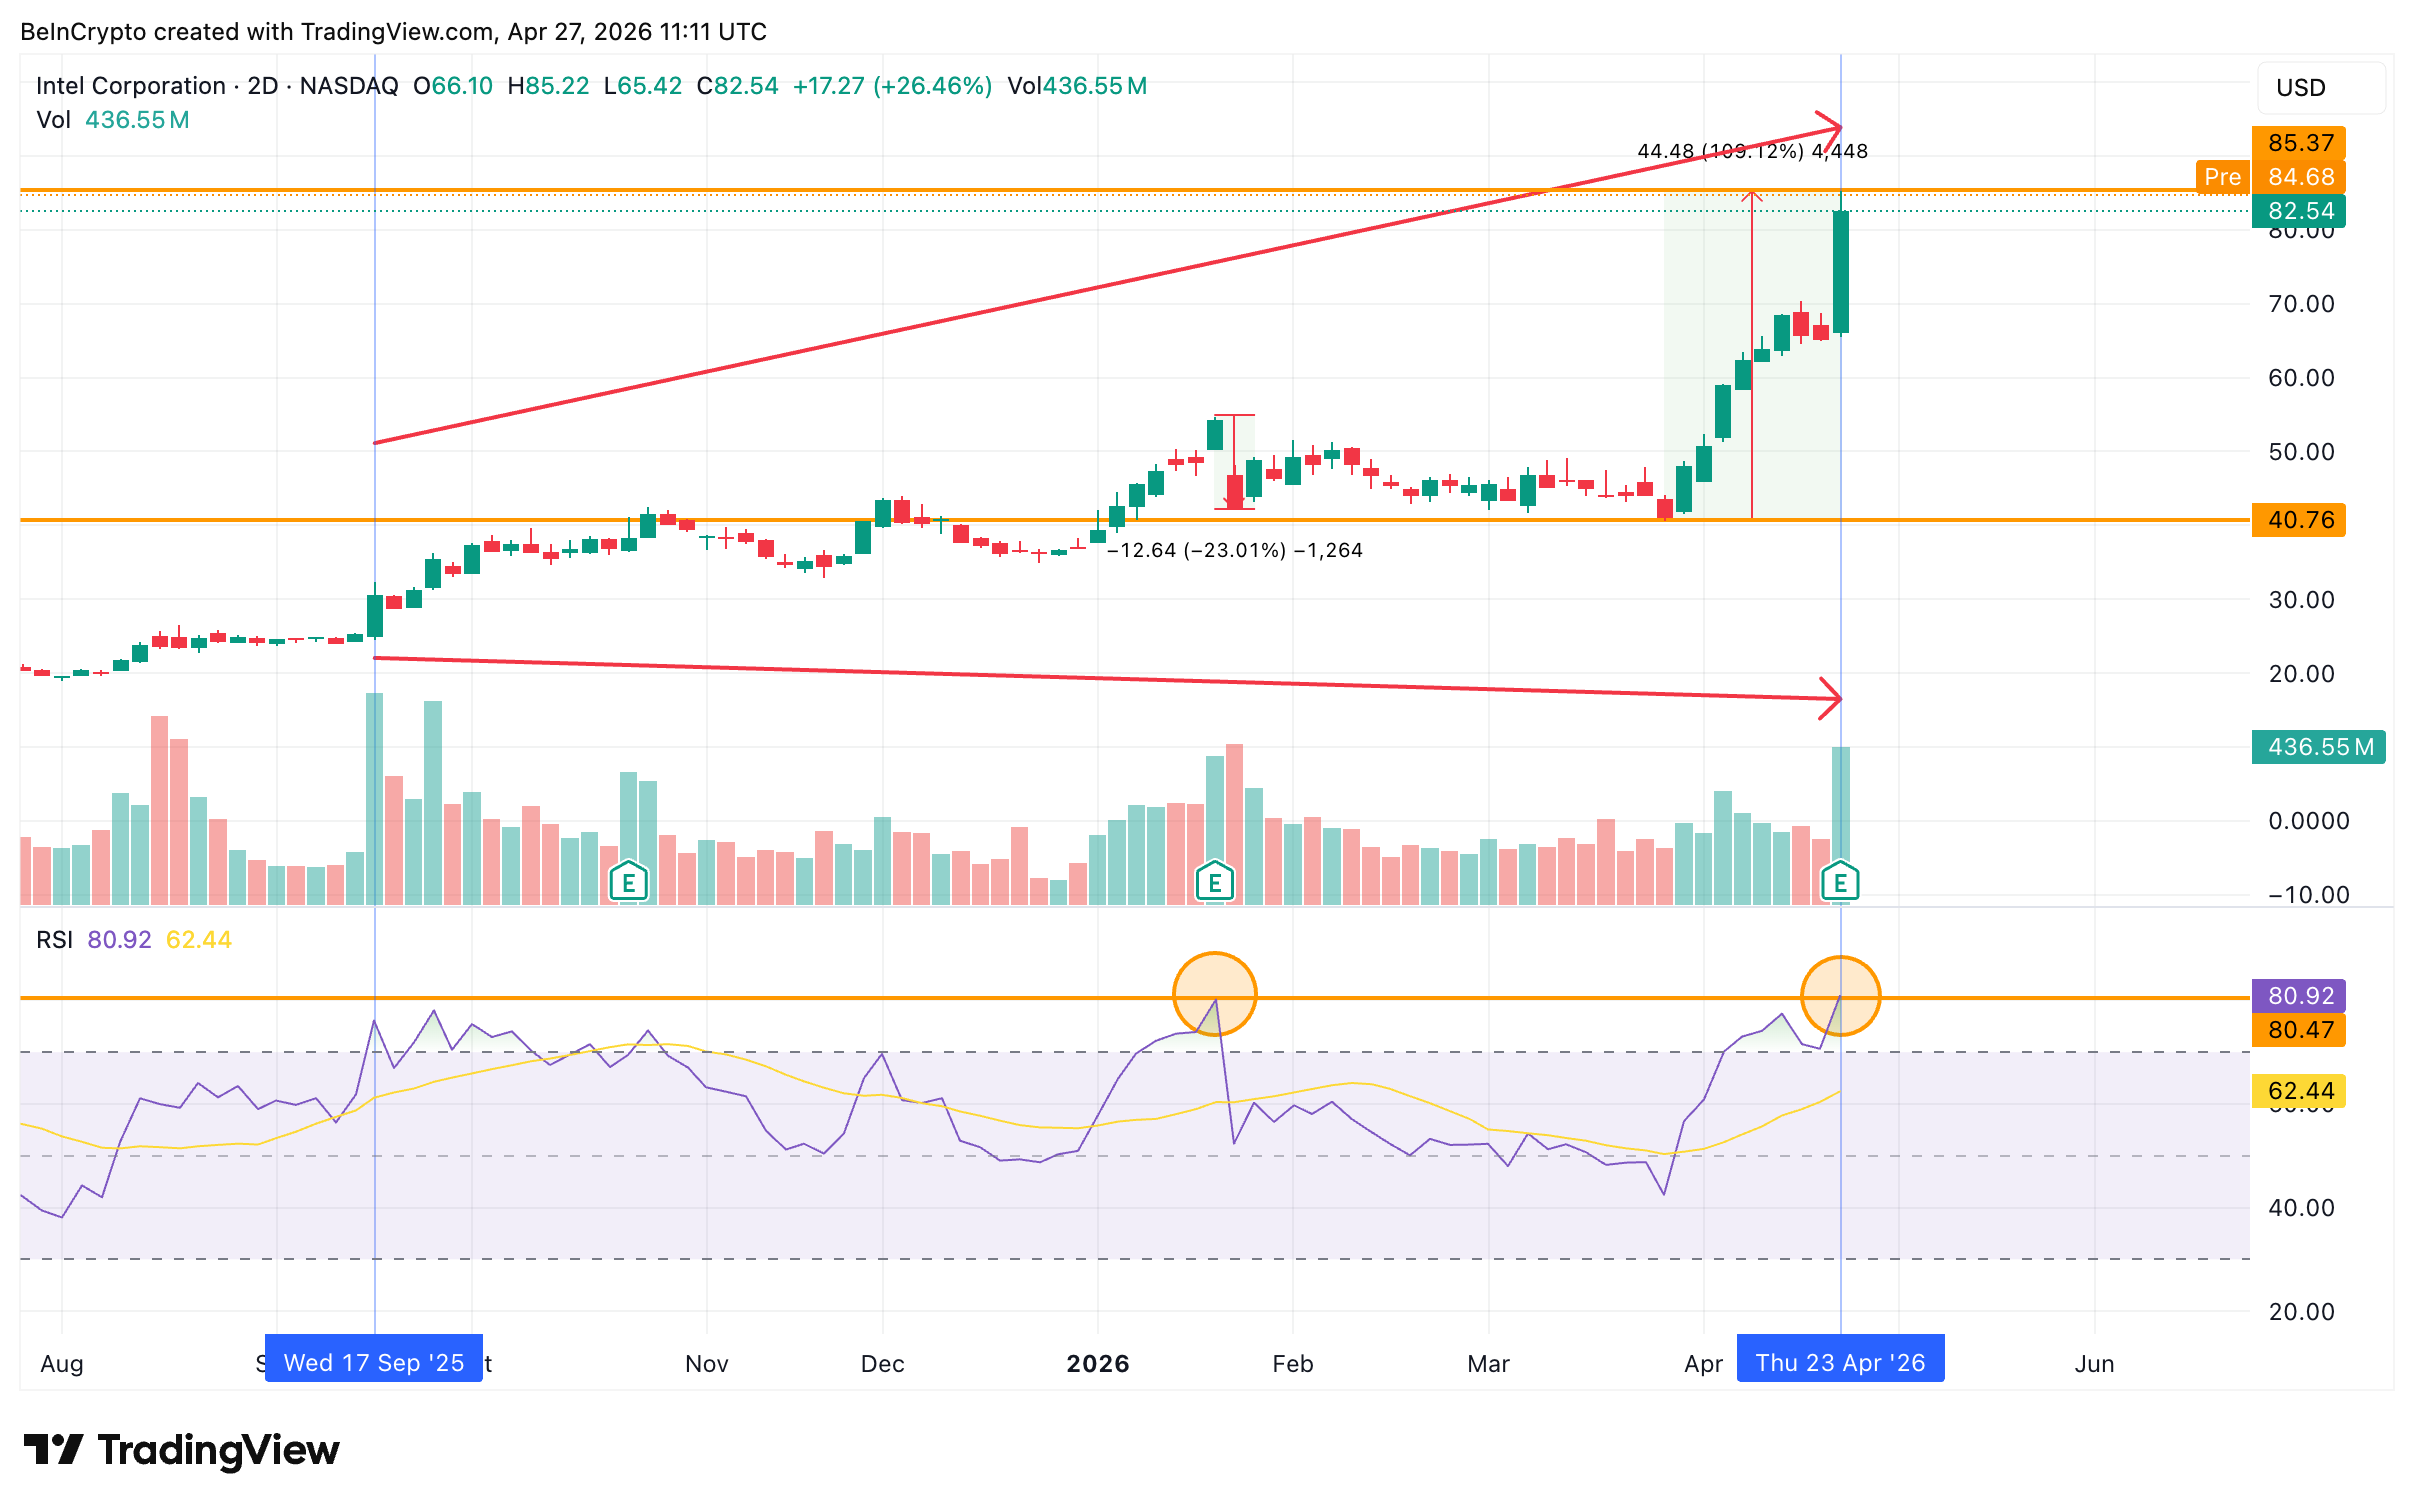 Intel RSI Volume Divergence: TradingView
That technical exhaustion matters because of what sits underneath the rally.
Intel now trades above 120 times next year’s expected earnings, the richest forward valuation among large-cap chip stocks, meaning every dollar of future profit is already priced in many times over.
On a clean accounting basis, the company posted a $3.7 billion net loss last quarter after a Mobileye writedown, and the Intel Foundry segment, the centerpiece of the entire turnaround thesis, lost another $2.4 billion in the same quarter.
Momentum is the only thing currently holding price above the underlying business. When the RSI resets, that gap tends to close.
Whether options positioning confirms or contradicts that pullback risk is the next piece of the puzzle.
INTC Put-Call Ratio Rises Even as Analysts Stay Cautious
On March 27, when Intel closed at $43.13, the options market sat in balance. The put-call ratio by volume printed 0.93 and the open interest ratio printed 0.91, with neither calls nor puts dominating.
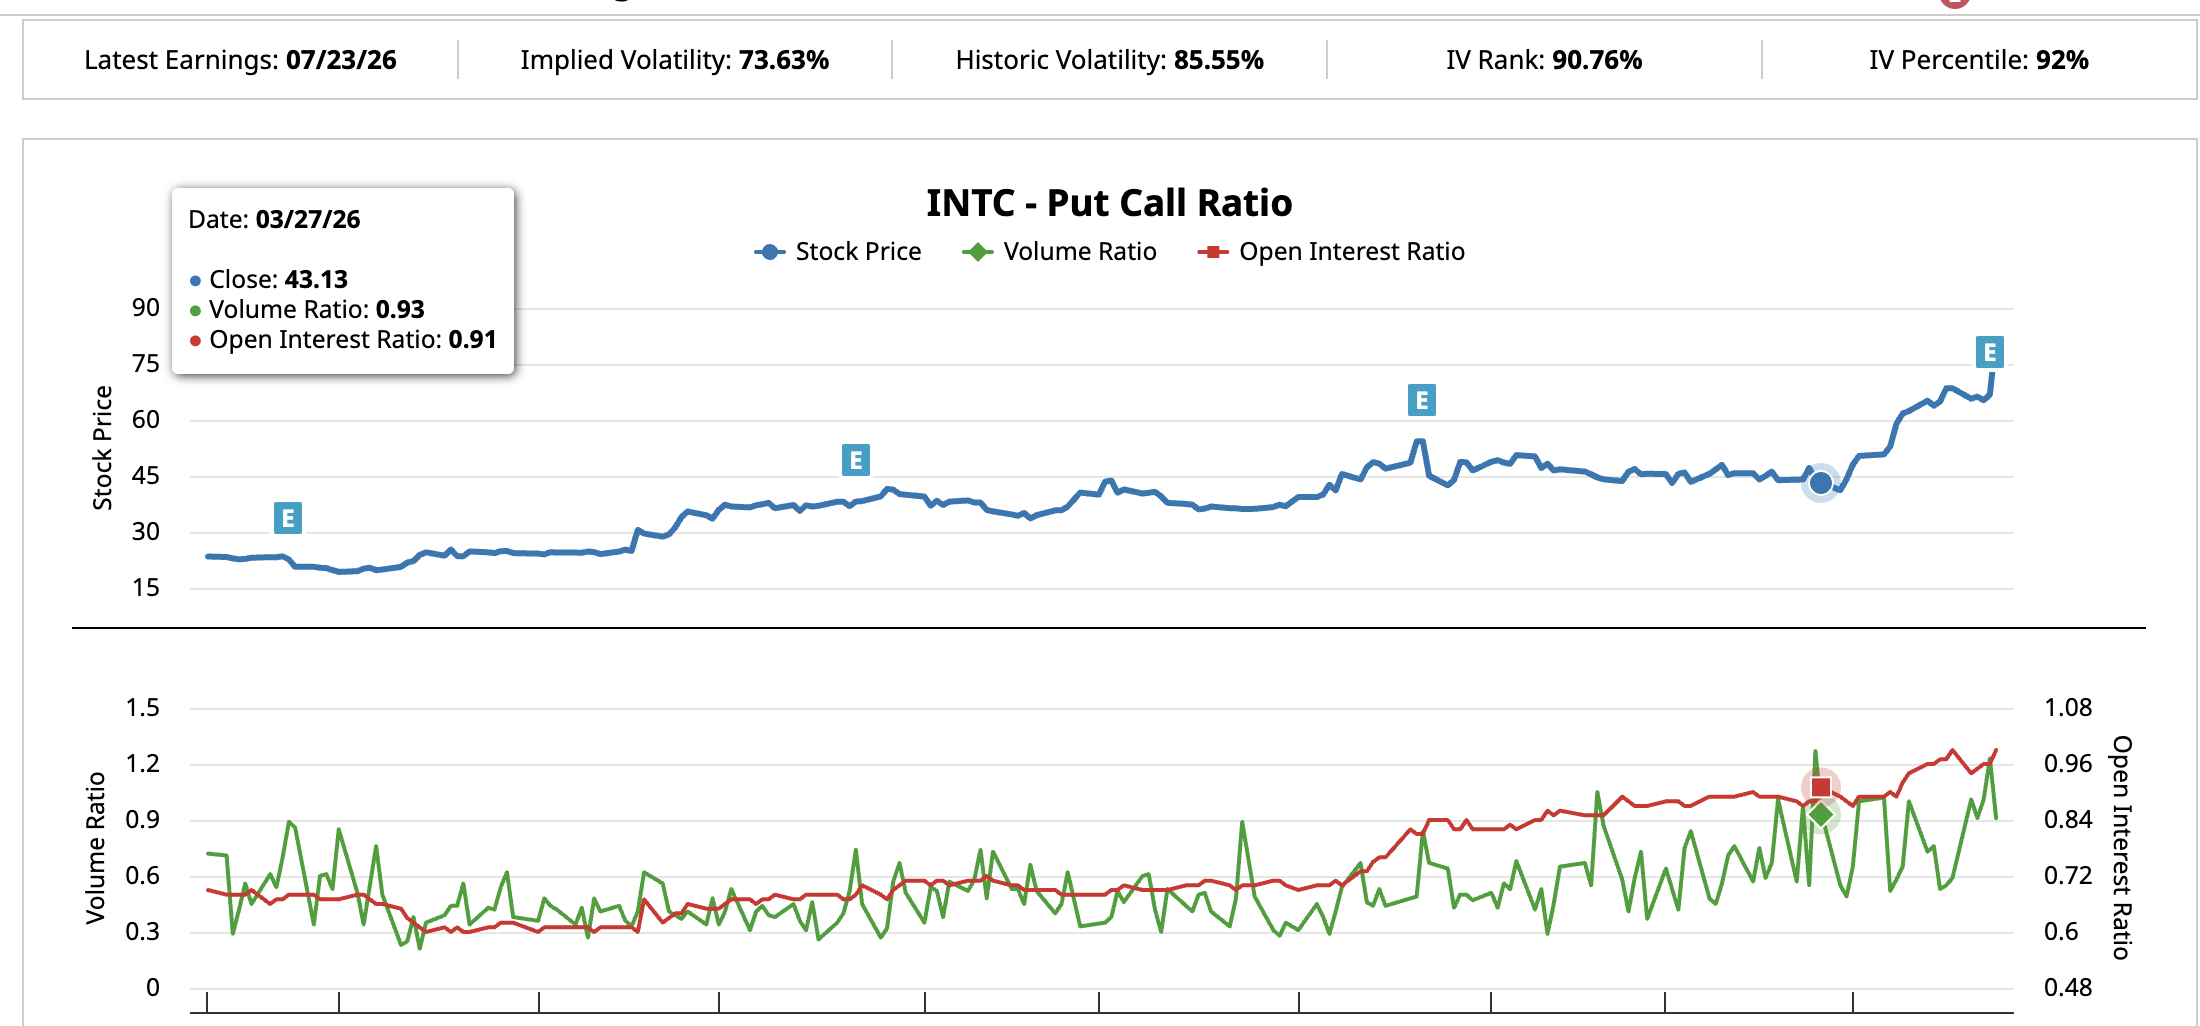 INTC Put Call Ratio March: Barchart
By April 23, the day Intel reported Q1 earnings with the stock at $66.78, the volume ratio had climbed to 1.23 and the open interest ratio to 0.96. Bearish positioning continued to build as the price rose.
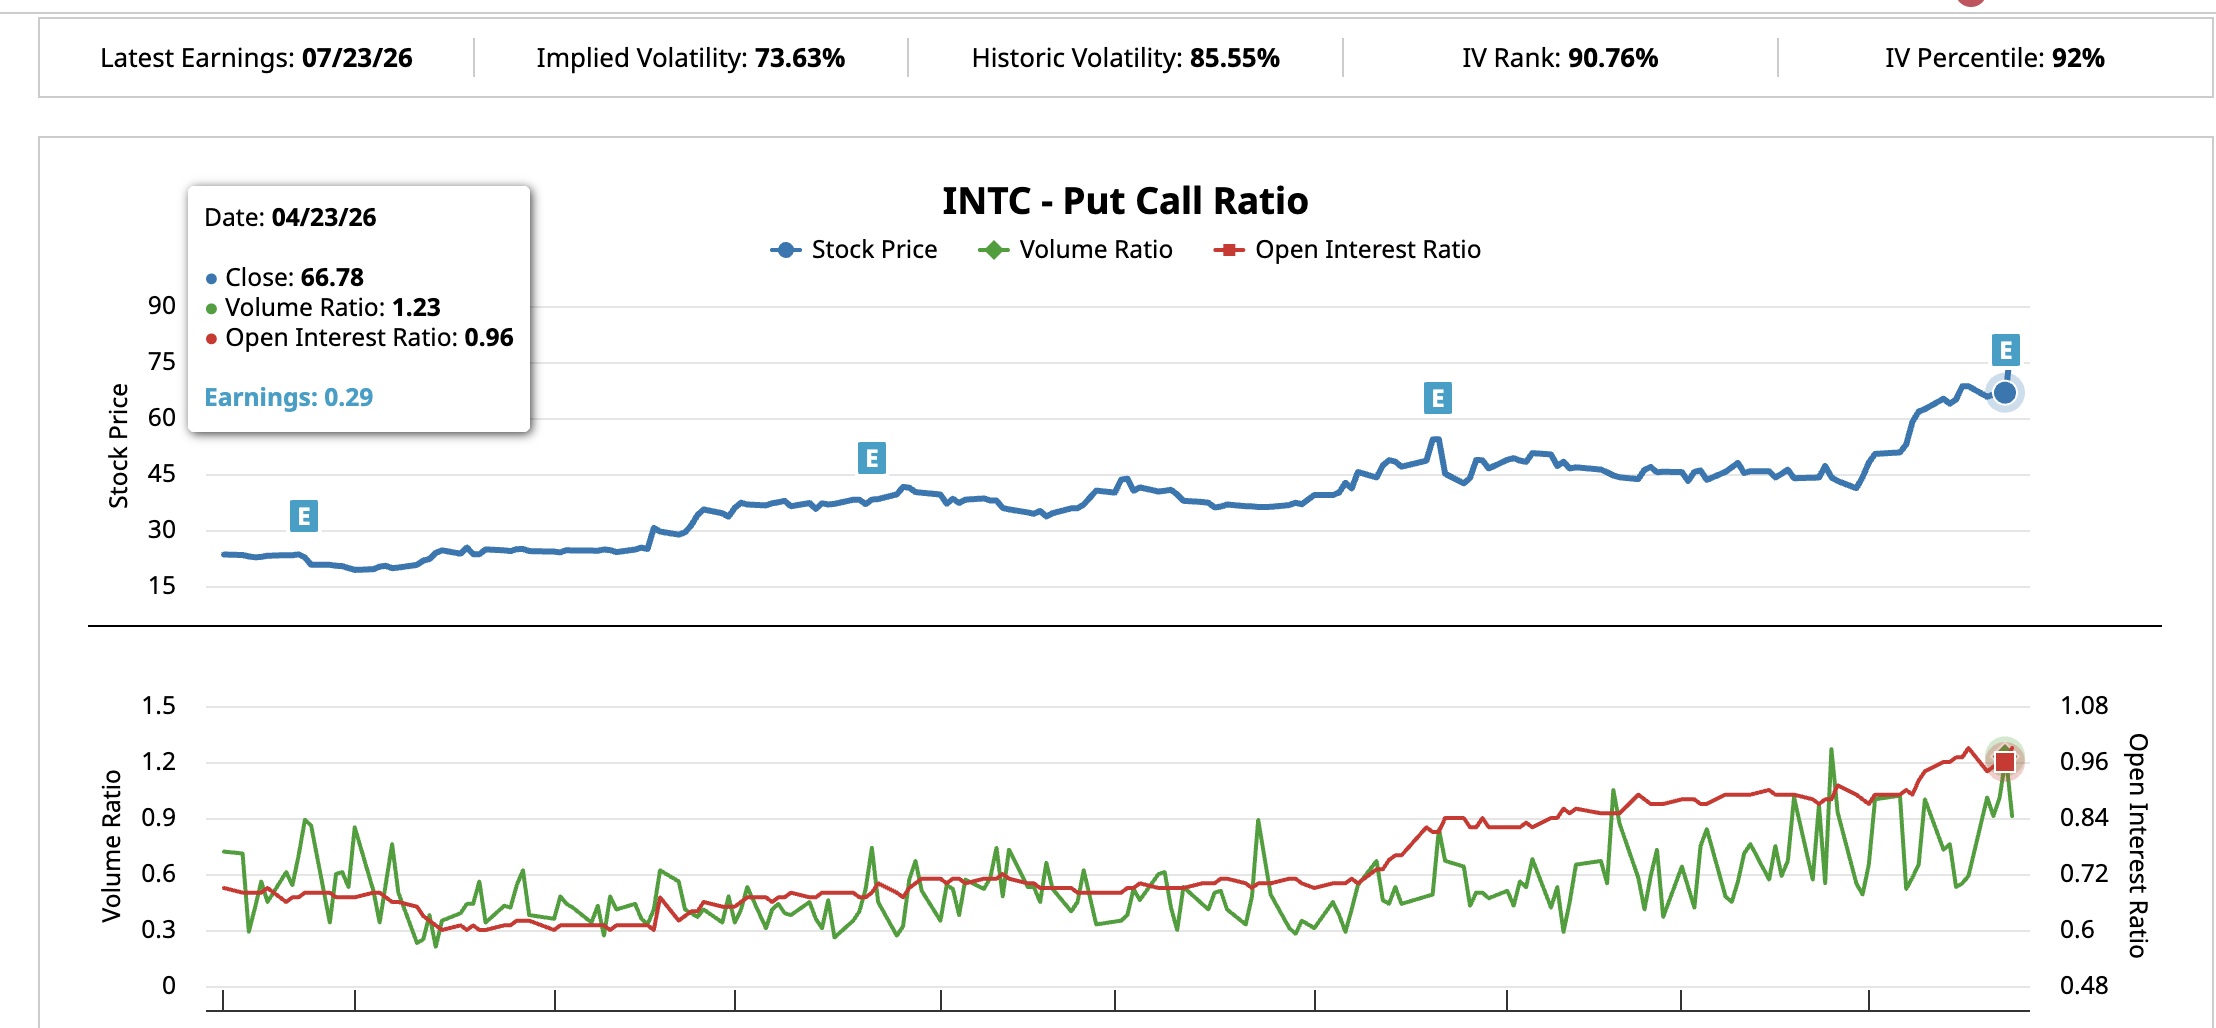 INTC Put Call Ratio Latest: Barchart
That positioning carries two edges. If Intel pushes higher, those bearish bets get caught, and forced covering can amplify the move, the same dynamic that fueled the 24% single-day rip on April 24.
If the stock breaks down instead, the put wall becomes a magnet that pulls the price further down.
Implied volatility, which reflects how big a price move options traders expect over the coming year, sits at 73.63%. The IV Rank of 90.76 shows that reading is near the top of the past year’s range, meaning the market is bracing for one of its largest expected swings in either direction.
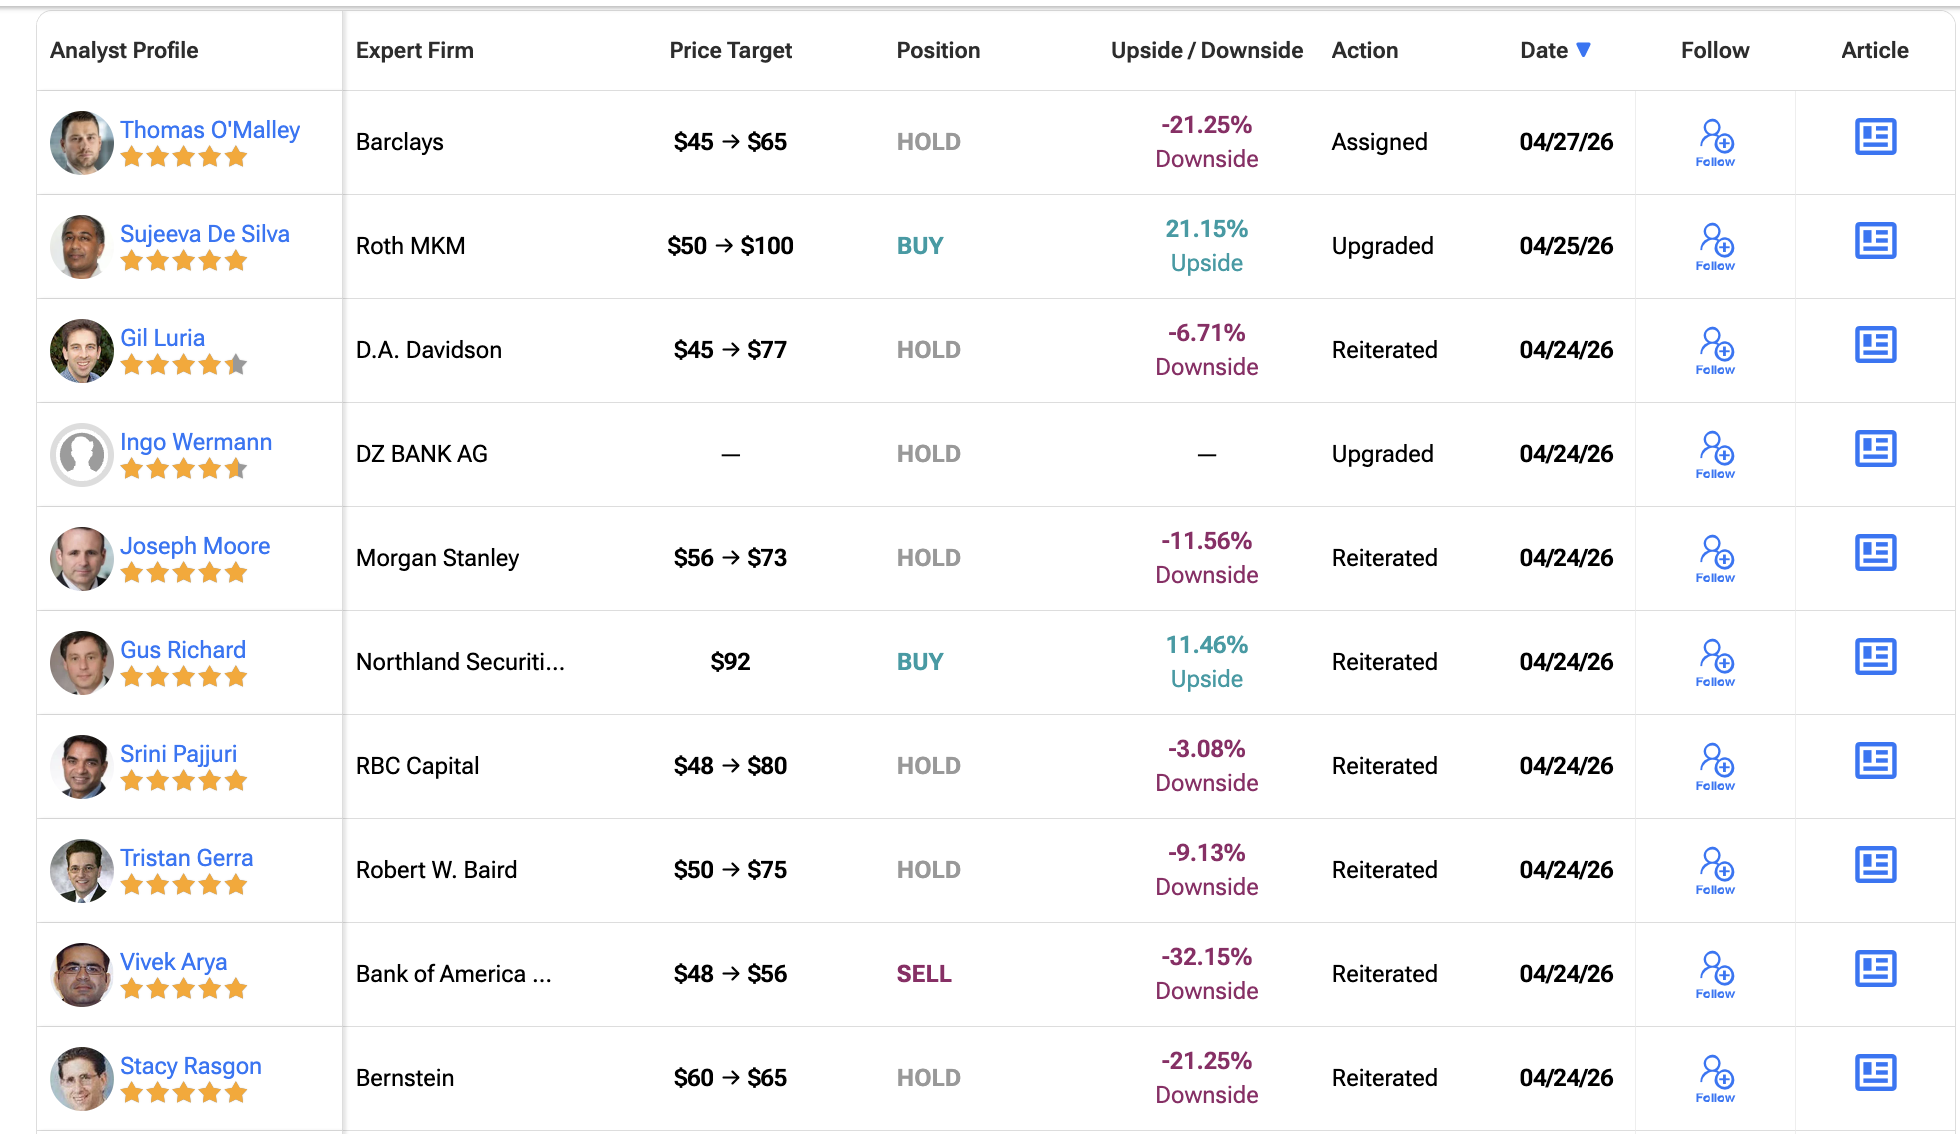
Wall Street has not stepped in to defend the rally. Analyst targets were raised across the board after earnings, but most ratings stayed cautious.
Barclays raised its price target to $65 with a Hold rating. Bank of America reiterated Sell at $56, implying roughly 32% downside. Morgan Stanley is rated Hold with a $73 price target. RBC went to $80, also Hold. Only Roth MKM at $100 and Northland at $92 carry a Buy.
 Analyst Ratings Table: TipRanks
With positioning bearish and most price targets sitting below spot, the price chart itself becomes the decider.
Intel Stock Price Levels and the May $100 Question
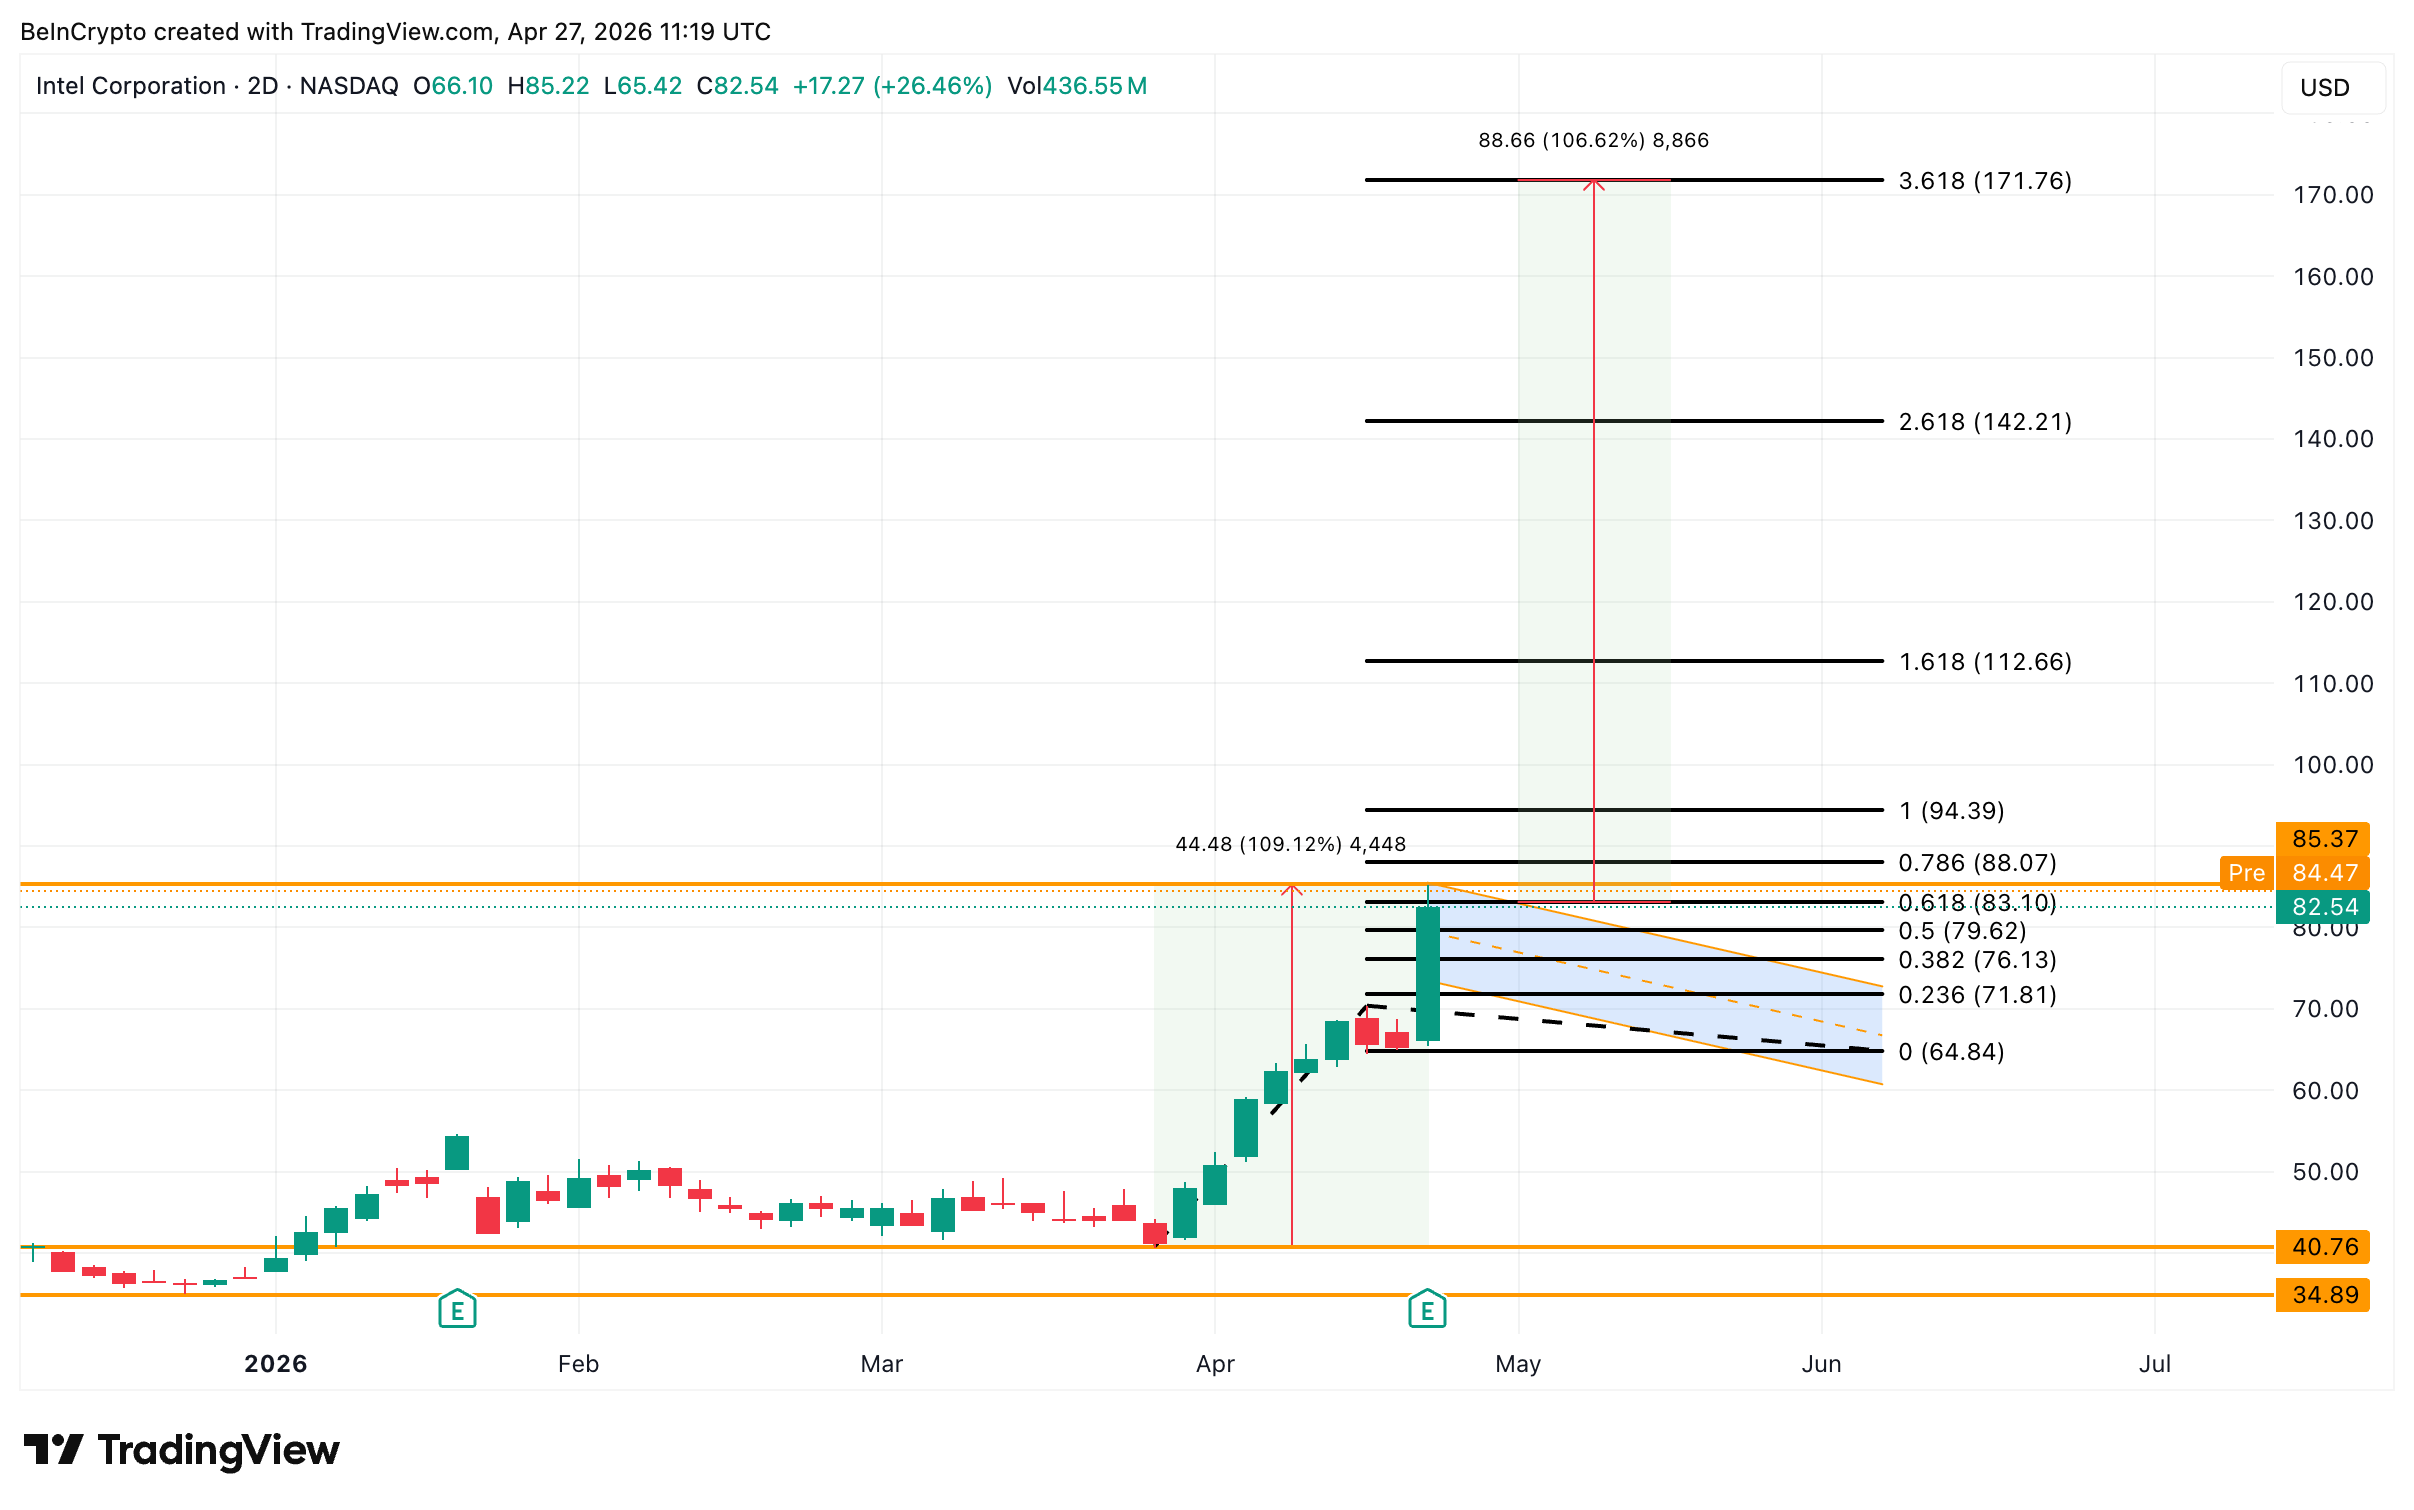
The rally from $40.76 to the April 24 peak at $85.37 forms the pole of a potential bull flag pattern. It is a continuation setup where a sharp move higher is followed by a tight sideways drift before the next leg up. Intel stock currently consolidates near $82.54.
The flag stays intact as long as the price holds above $64.84. A 2-day close above $83.10, the 0.618 Fibonacci level, would confirm the breakout.
That can push INTC stock price toward $94.39 and even $112.66, followed by a measured move toward $171.76 over the medium term.
For the May $100 target, the stock first needs to clear $83.10 cleanly, then break $88.07 (0.786 Fib) and the 1.0 Fib at $94.39. Above $94.39, the path to $100 opens through the 1.618 extension at $112.66.
 Intel Price Analysis: TradingView
The setup carries a real caveat. With RSI already at 80.92 and volume thinning into the move, a sharp pullback toward $76.13 (0.382 Fib) or even $71.81 (0.236 Fib) remains possible before any clean breakout.
A 2-day close below $64.84 invalidates the bull flag and the bullish thesis. The next major support from there sits all the way down at the $40.76 base from late March, the same level Intel traded at before the rally began.
Below that line, the price is no longer pricing in the AI turnaround at all, just the loss-making business shown in the latest filing.
The $83.10 close is the line in the sand. A clean break sends Intel stock toward $100 in May. A rejection here, with bearish options positioning, an extreme RSI reading, and a foundry segment still losing $2.4 billion a quarter as fuel, opens the door for a 23% pullback that would mirror the last overbought reset.
Recommended Articles


