


US CPI Inflation Set to Jump in March, Putting an End to Gradual Two-Year Decline
The US Bureau of Labor Statistics (BLS) will publish the March Consumer Price Index (CPI) data on Friday. The report is expected to show a jump in inflation, driven by the upsurge seen in crude Oil prices after the United States (US) and Israel launched a joint attack on Iran.
The monthly CPI is forecast to rise 0.9%, following the 0.3% increase recorded in March, while the annual reading is seen climbing to its highest level since May 2024 at 3.3%, from 2.4% in February. Core CPI figures, which exclude volatile food and energy prices, are expected to come in at 0.3% and 2.7%, on a monthly and yearly basis, respectively.
Since the beginning of the conflict in the Middle East on February 28, the barrel of West Texas Intermediate (WTI) is up about 40%, even after the sharp decline seen following the announcement of a two-week ceasefire between the US and Iran earlier this week. In March, WTI gained nearly 50%, rising from about $67 per barrel to settle near $100 by the end of the month.
Previewing the inflation data, “the recent surge in crude prices will be the main factor behind the 0.9% m/m jump in the CPI. The Y/Y rate will leap close to 1pp to 3.3% in March, a two-year-high,” said TD Securities analysts.
“Core inflation will stay shielded from the oil shock for now, rising 0.27% m/m. We look for tariff pass-through to continue playing a role by lifting goods prices. Supercore inflation likely stayed firm at 0.3%,” they added.
What to Expect in the Next CPI Data Report?
CPI figures for March will reflect the impact of high oil prices on inflation, which shouldn’t be surprising. Even if the annual CPI inflation rises 3.3% in March, as forecast, investors could see that as a temporary increase in case they remain confident that Oil prices will come down significantly, with a permanent truce in the Middle East allowing the Strait of Hormuz to remain open.
However, the growing uncertainty about the sustainability of a ceasefire and Iran’s condition to retain control of the strait in a peace agreement complicates the picture and raises doubts about a steady pullback in Oil prices. Hence, the developments in the Middle East are likely to shape inflation expectations, rather than the March CPI reading itself.
The Minutes from the Federal Reserve’s (Fed) March meeting showed that a number of policymakers are already pushing back the timing of potential rate cuts, reflecting lingering concerns that inflation could prove more persistent than expected.
In fact, a large majority flagged the risk that price pressures could stay elevated for longer, particularly if higher Oil prices feed through more broadly.
“Provided that underlying inflation excluding energy remains contained, the Fed can afford to look through the oil-price shock and refrain from raising rates amid a mixed US labor market backdrop,” BBH analysts said.
How Could the US Consumer Price Index Report Affect Eur/USD?
Markets currently see about a 75% chance of the Fed leaving the policy rate unchanged at 3.5%-3.75% by the end of the year, compared to a 17% probability seen on March 9, according to the CME FedWatch Tool.
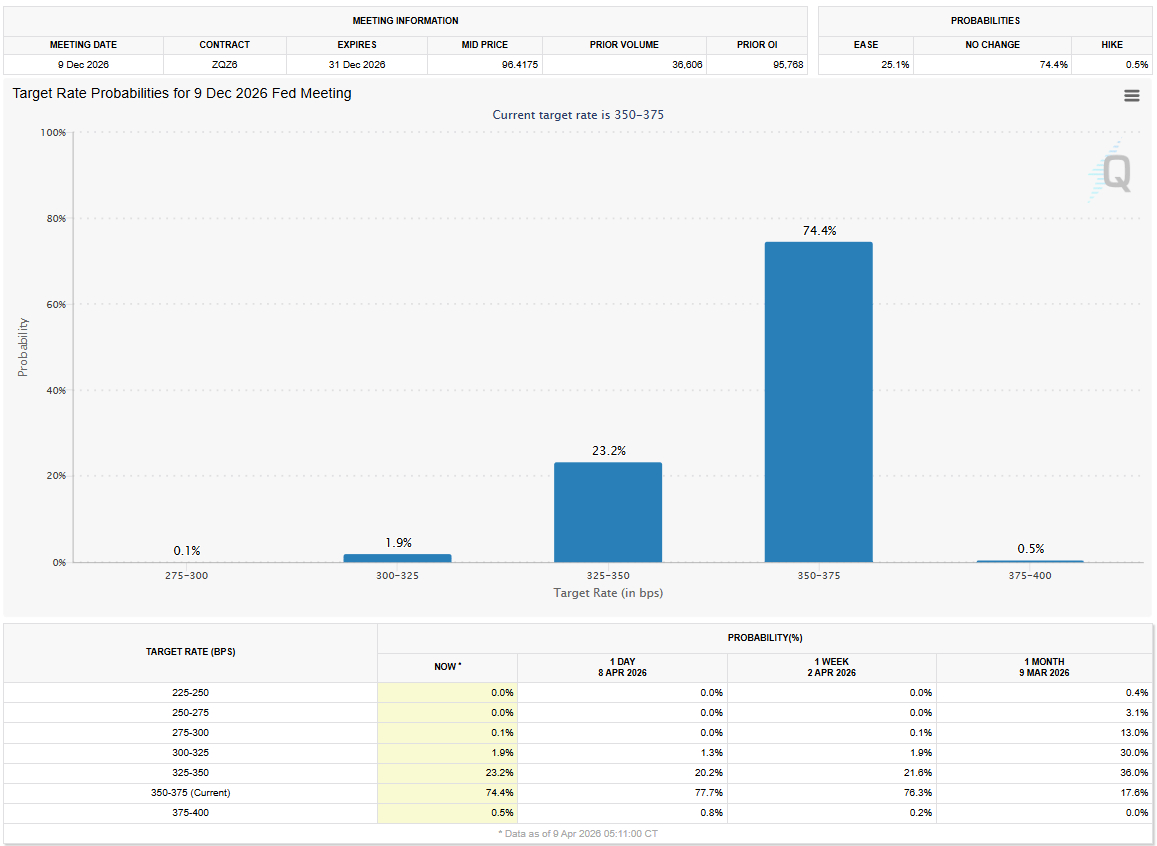 Source: CME Group
A stronger-than-forecast monthly CPI print for March might not be able to influence the market pricing of the Fed’s interest-rate outlook in a significant way.
However, if a hot inflation print is combined with a re-escalation of the conflict in the Middle East and growing expectations about the naval activity in the Strait of Hormuz not going back to its pre-war state anytime soon, investors could reassess the probability of a Fed hike in response to persistent inflation. In this scenario, the US Dollar (USD) could gather strength and force EUR/USD to turn south.
Conversely, the USD could remain under bearish pressure – and allow EUR/USD to extend its rebound – in case crude Oil prices continue to come down in a steady way, regardless of the March CPI figures.
In summary, March inflation prints are unlikely to trigger a significant market reaction, while market focus remains on the US-Iran crisis and its impact on Oil prices.
Eren Sengezer, FXStreet European Session Lead Analyst, shares a brief technical outlook for EUR/USD.
“EUR/USD’s near-term technical outlook points to a bullish tilt. The Relative Strength Index (RSI) indicator on the daily chart climbed above 50 for the first time since the beginning of the US-Iran war and the pair broke above the two-month-old descending trend line.”
“The Fibonacci 50% retracement level of the February-April trend aligns as the next resistance level at 1.1730 ahead of 1.1800 (Fibonacci 61.8% retracement) and 1.1900 (Fibonacci 78.6% retracement). On the downside, the immediate support is located at 1.1650 (Fibonacci 38.2% retracement). In case this support fails, technical sellers could show interest, opening the door for an extended slide toward 1.1560 (Fibonacci 23.6% retracement) and 1.1500 (static level, round level).”
Recommended Articles


