


Crypto Overview: Bitcoin tops $72,000 on short squeeze while Privacy coins rally
- Bitcoin is above $72,000 on Friday, signaling a bullish week amid de-escalation efforts across the Middle East.
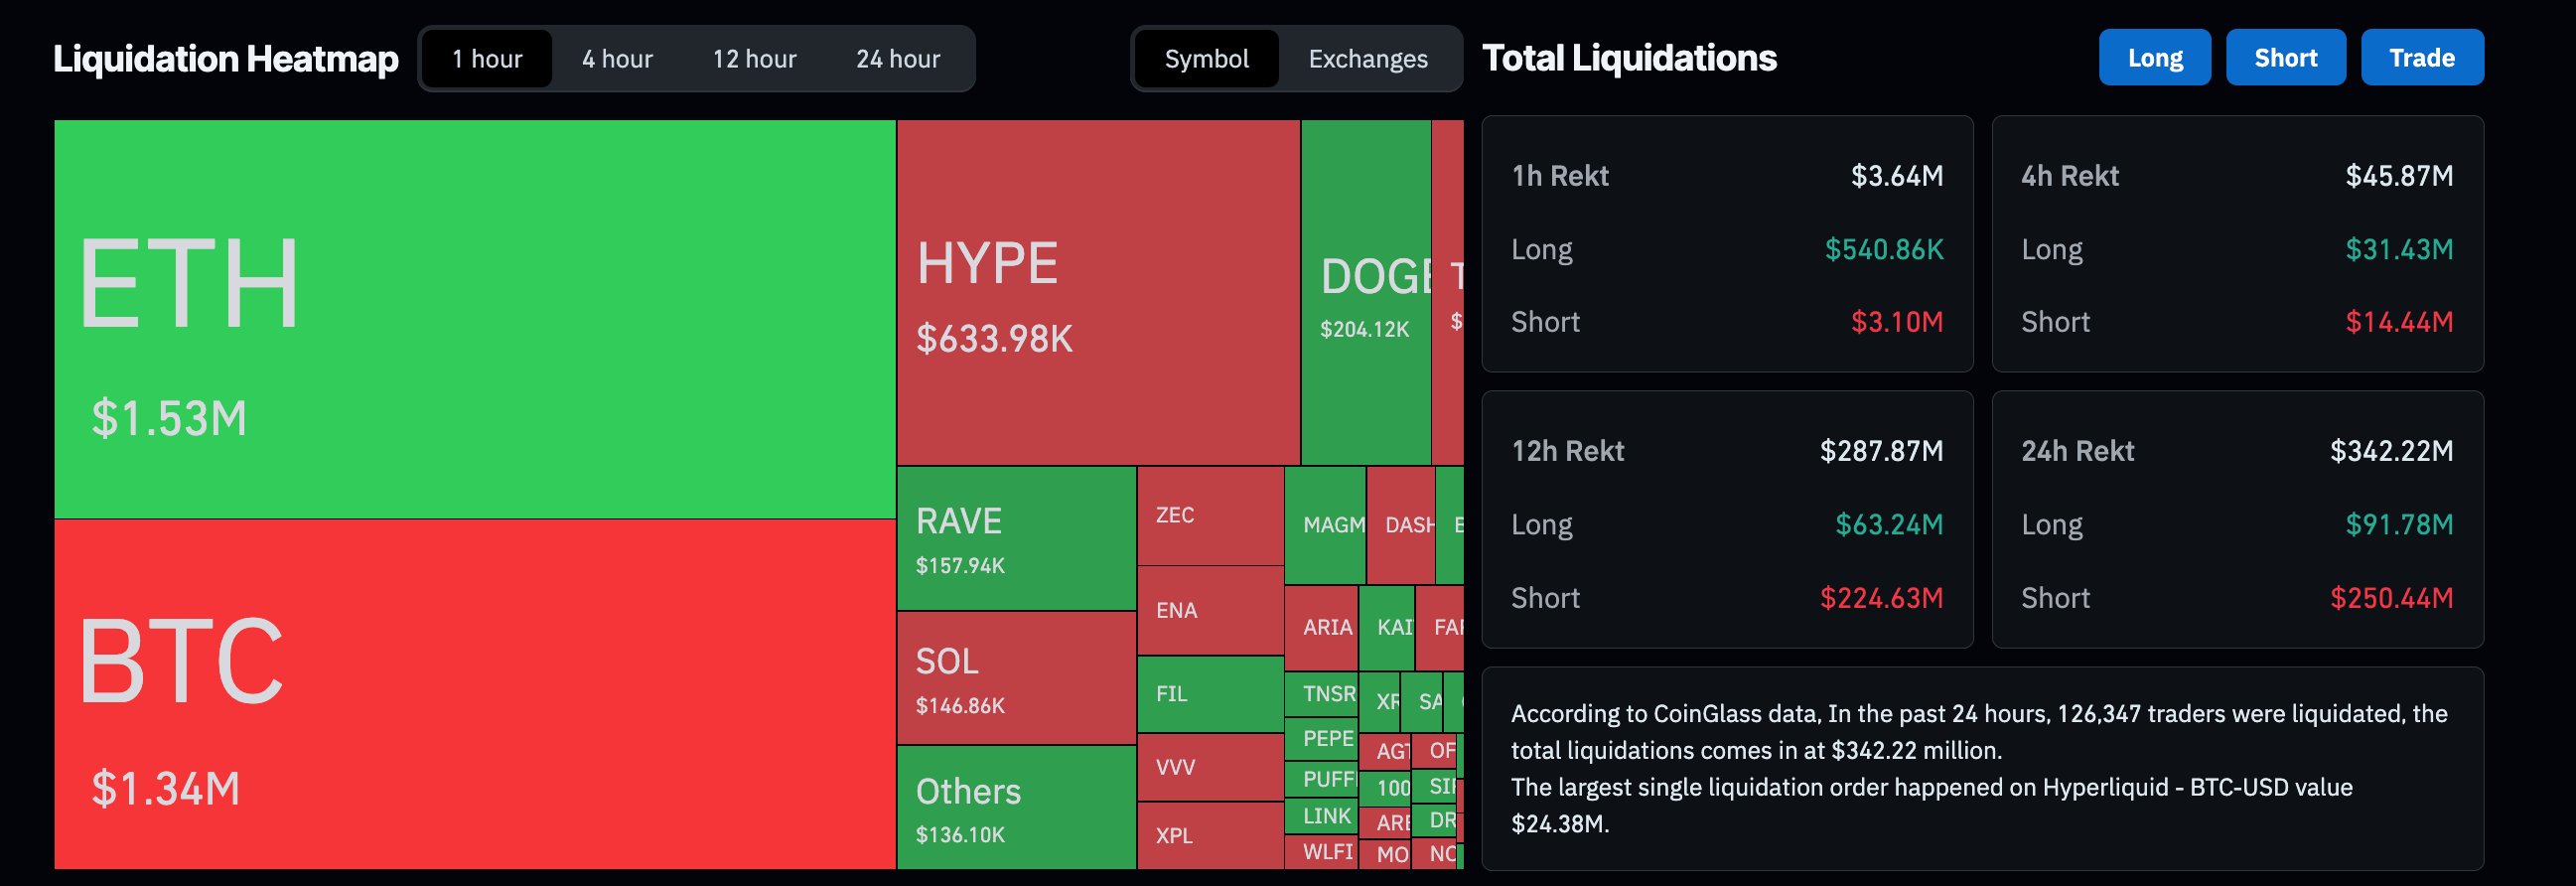
- Liquidations exceeding $300 million in 24 hours imply a bearish wipeout amid the broader market's recovery.
- Privacy coins, including Dash and Zcash, are leading the gains over the last 24 hours.
Bitcoin (BTC) hovers above $72,000 at press time on Friday, extending its recovery as Israel agrees to direct talks with Lebanon. Meanwhile, privacy coins Dash (DASH) and Zcash (ZEC) are leading gains over the last 24 hours.
Crypto Market recovers amid Middle East de-escalation efforts
Israel’s missile strikes on Lebanon prompted a warning from Iran of stepping back from the vulnerable US-Iran truce. Israel’s Prime Minister Benjamin Netanyahu tested the terms set by US President Donald Trump for a two-week ceasefire before deciding to pursue direct talks with Lebanon, which pushed down oil prices.
Meanwhile, CoinGlass data shows liquidations over the past 24 hours reached $342.22 million, led by $250.44 million in short liquidations, reflecting a bearish wipeout in the market.
Bitcoin extends gains amid the conflict
Bitcoin shows a steady recovery so far this week, bouncing off the 50-day Exponential Moving Average (EMA) to cross above $72,000 at press time on Friday. Still, BTC is capped by the 100- and 200-day EMAs at $75,459.32 and $83,510.80, respectively, preserving a broader capped bias.
The Relative Strength Index (RSI) at 59 points to constructive but not overbought momentum, while the Moving Average Convergence Divergence (MACD) stays positive, hinting that buyers are probing higher despite the still-dominant overhead structure.
On the topside, initial resistance appears at the broken descending trendline region around $73,361.31, with a more substantial confluence emerging near the 100-day EMA at $75,459.32 and the 23.6% Fibonacci retracement of the larger downswing at $75,623.11. A sustained break above that cluster would open the way toward the 200-day EMA at $83,510.80 and the 38.2% retracement near $85,288.26, ahead of higher Fibonacci barriers at $93,099.82 and $100,911.37.
On the downside, the 50-day EMA at $70,609.71 is the first line of support; a daily close below it would expose the broader structural floor defined by the cycle low anchor near $60,000.00.
Privacy coins extend rally
Zcash trades around $375, extending a strong bullish phase after reclaiming and accelerating well above its 50-, 100-, and 200-day EMAs, which now sit comfortably below price, reinforcing an underlying uptrend.
Momentum is stretched, with the RSI at 77 in overbought territory and the MACD line pushing higher in positive territory, which hints at robust upward pressure but also raises the risk of a corrective pause after the latest vertical leg.
A steady recovery above the $400 psychological level could extend ZEC spot toward the $500 mark, followed by the overhead resistance at the December 29 high at $560.
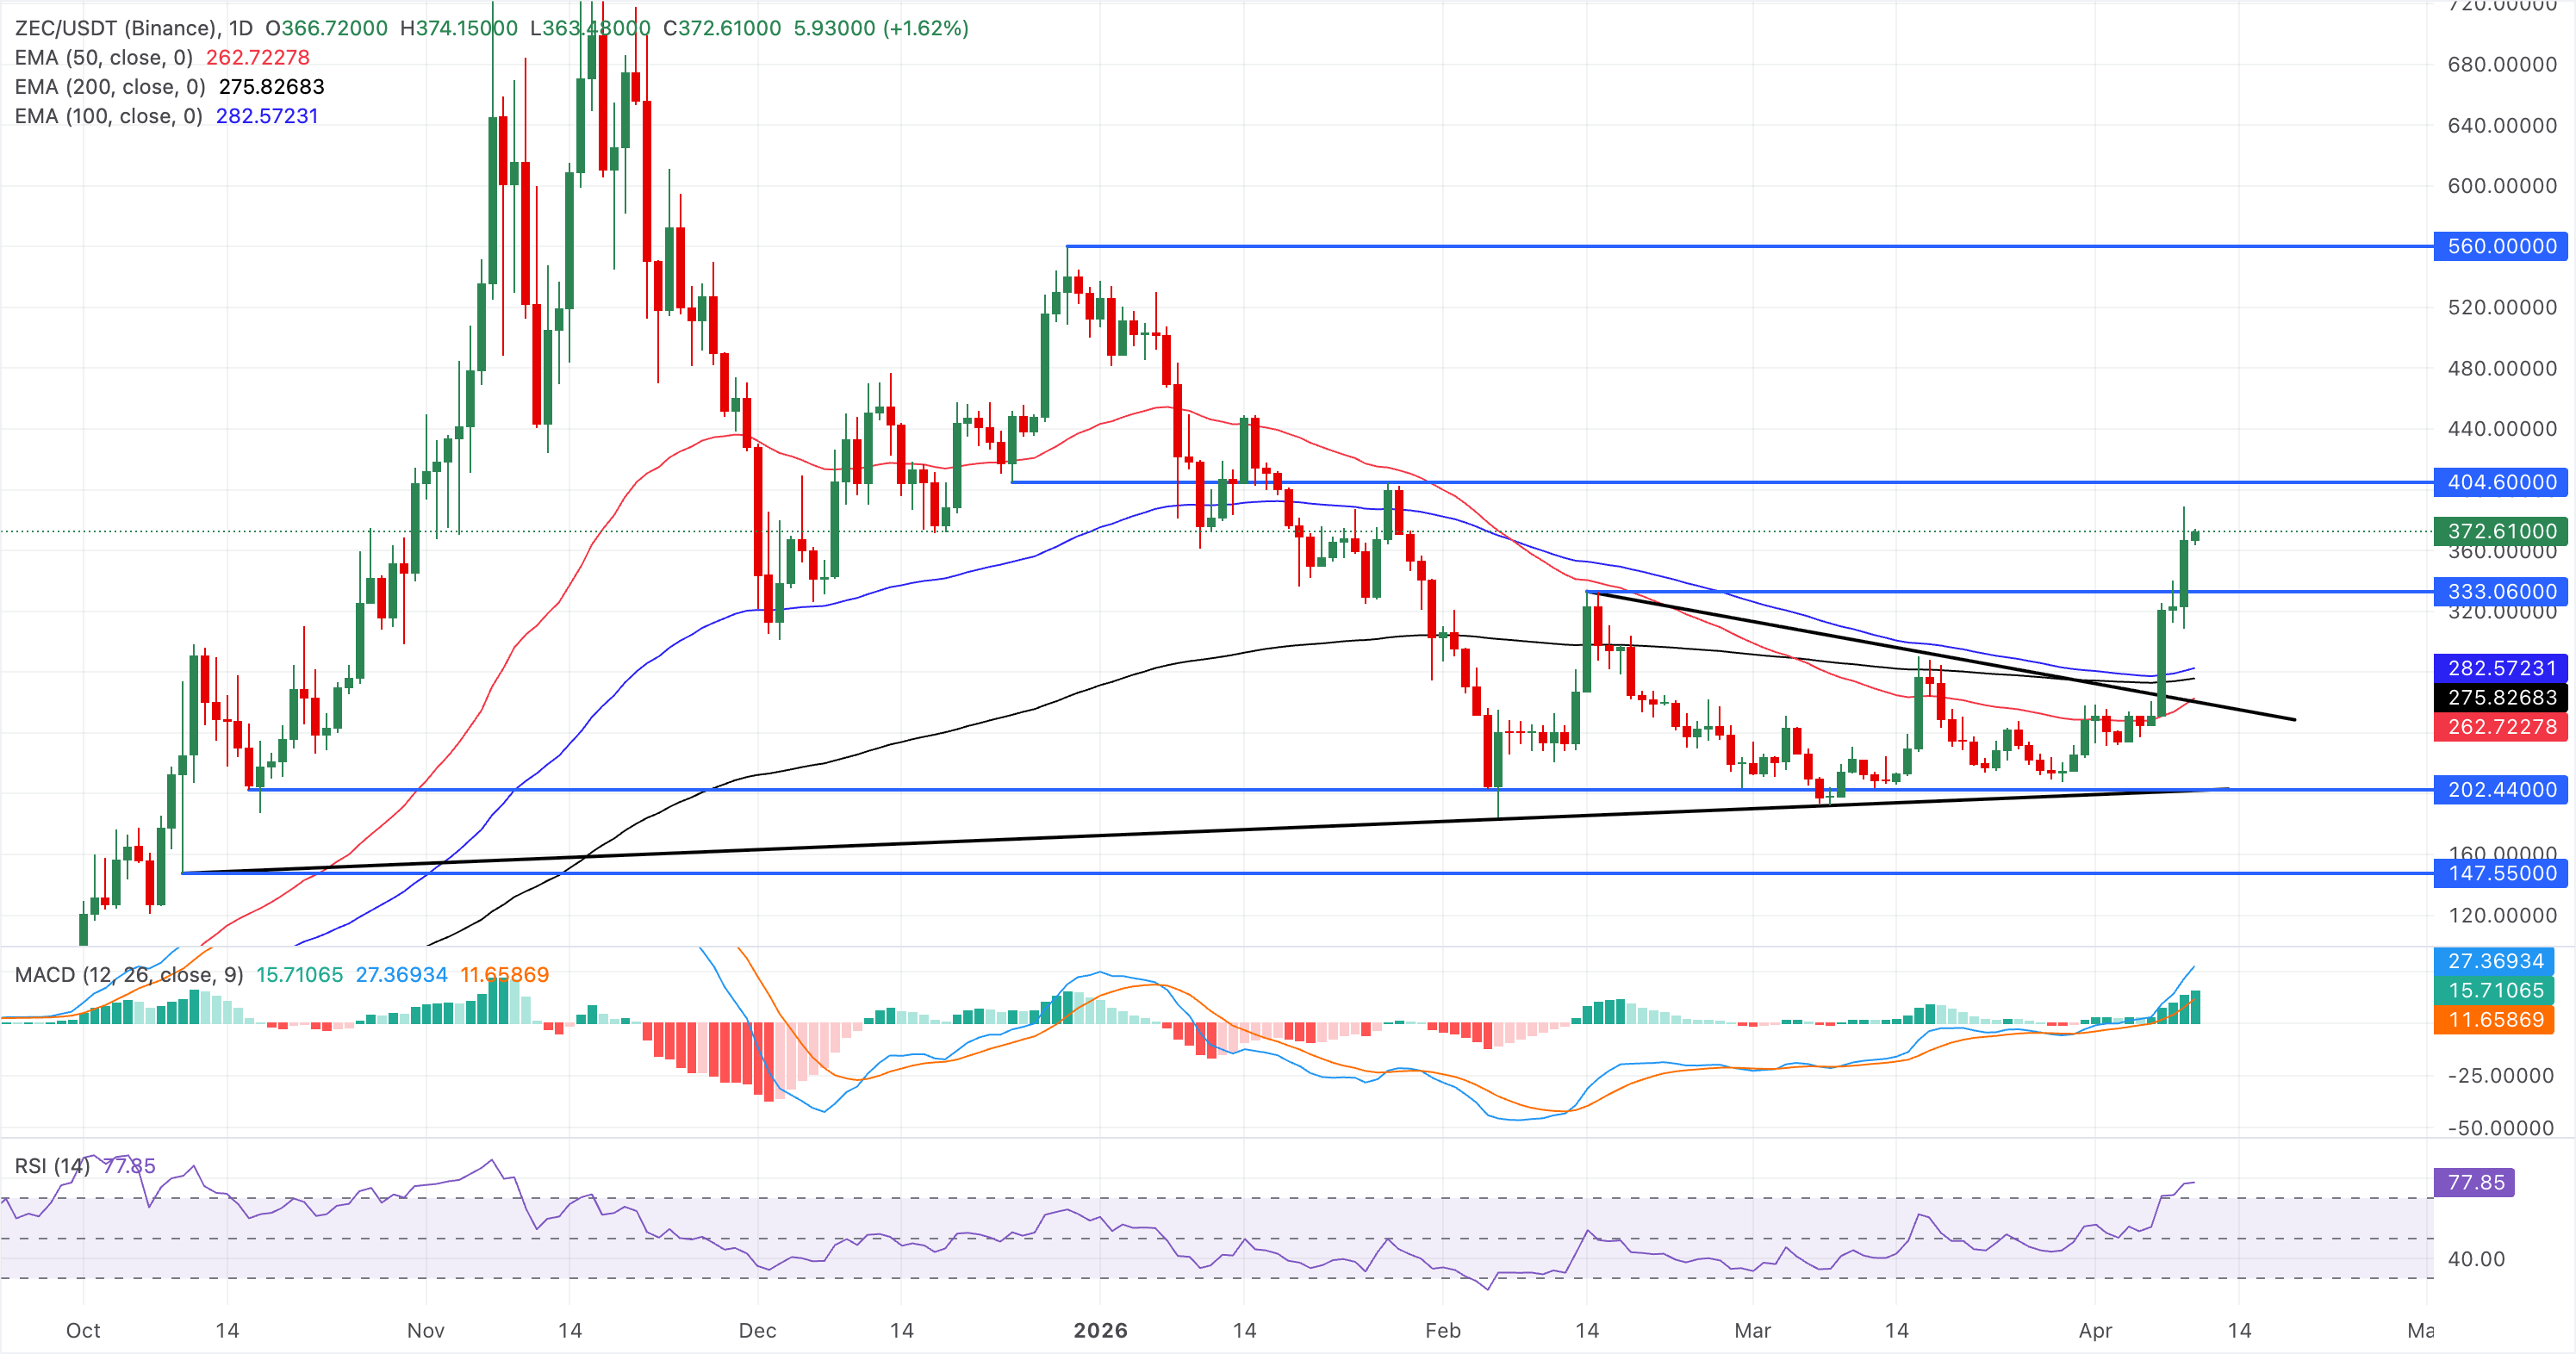
On the downside, initial support is given by the rising EMA cluster between the 100-day EMA at $282 and the 200-day EMA at $275, with the 50-day EMA at $262 offering a deeper dynamic floor should profit-taking intensify.
On the other hand, DASH shows a steady recovery toward $40.00, extending a bullish near-term bias as price holds above the 50-day and 100-day EMAs at $34.53 and $38.17, respectively, while challenging the broader downtrend structure.
The 23.6% Fibonacci retracement of the downswing from $96.85 to $29.31 at $45.25 serves as the first meaningful topside barrier, and a sustained close above it would open the door to the 50% retracement level at $53.27.
The RSI at 66 continues to rise steadily above the midline, with further upside before reaching overbought territory, and the MACD above its signal line rises into positive territory.
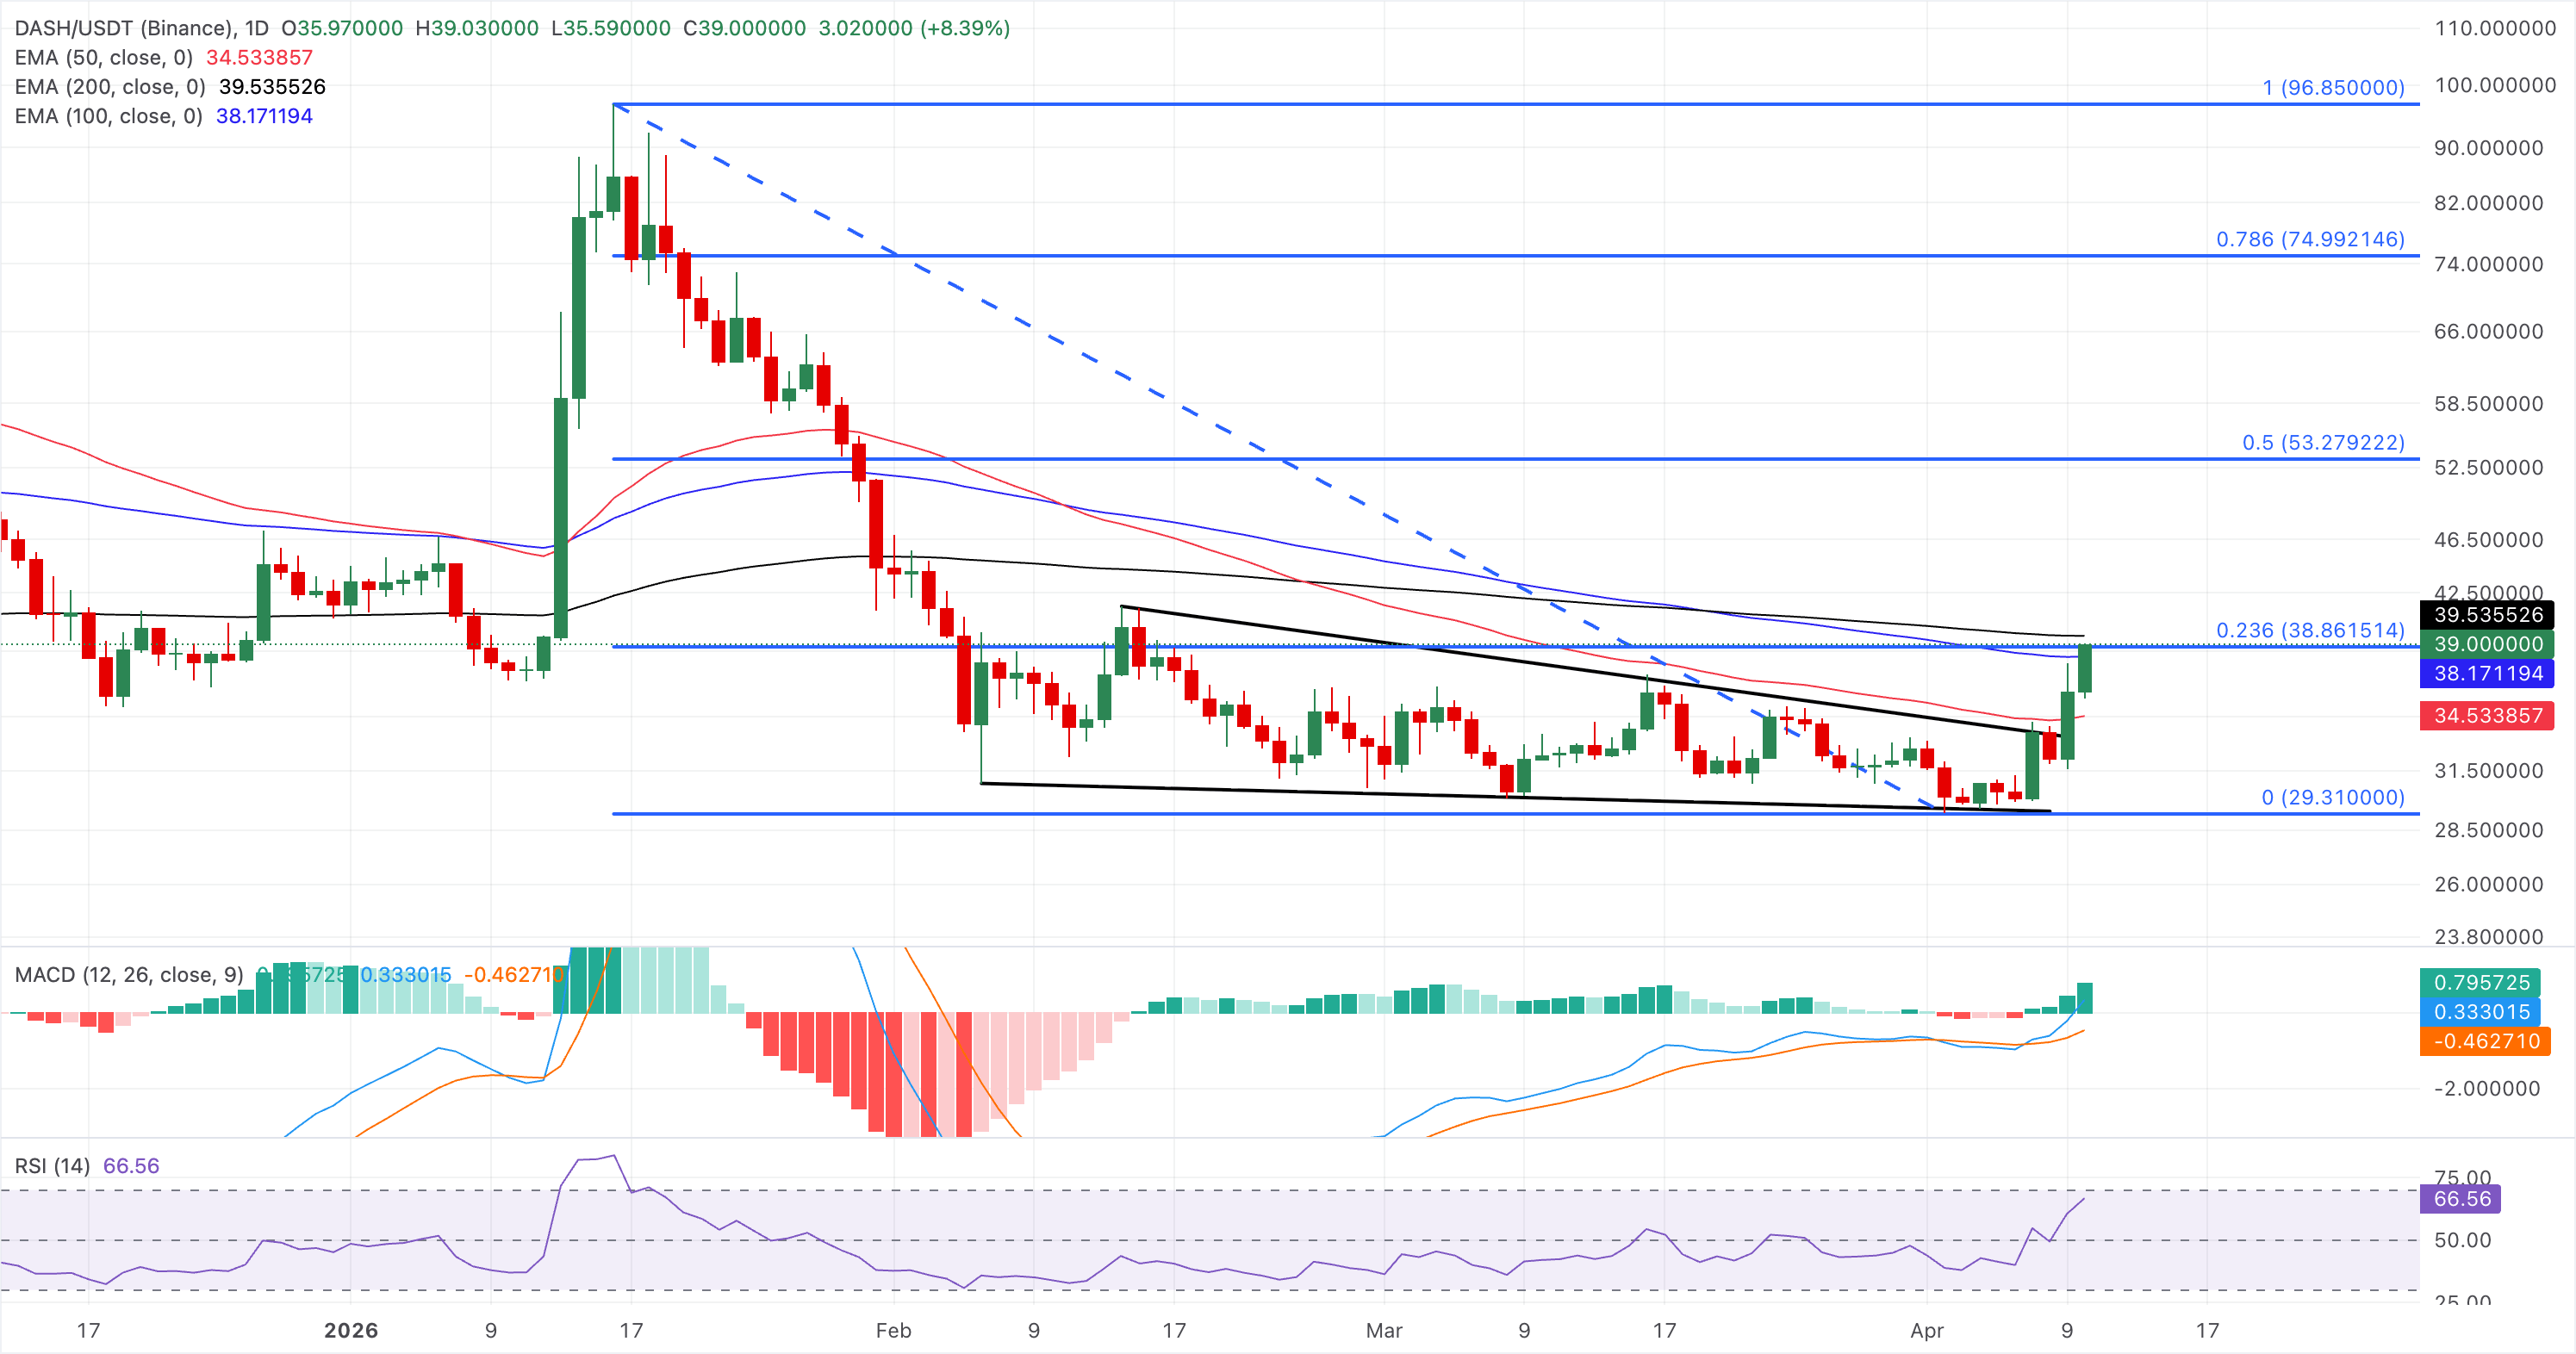
On the downside, initial support is provided by the 100-day EMA at $38.17, with further technical cushions at the 50-day EMA around $34.53.
(The technical analysis of this story was written with the help of an AI tool.)
Recommended Articles


