


Ethereum Price Forecast: ETH derivatives begin a comeback, but realized price resistance caps recovery
Ethereum price today: $2,180
- Ethereum is experiencing improved sentiment in its derivatives market following a recovery in open interest and Net Taker Volume.
- Despite the derivatives rebound, ETH must break above the realized price resistance to continue its recovery.
- ETH could fall to the $2,110 support after facing a rejection at the $2,390 resistance.
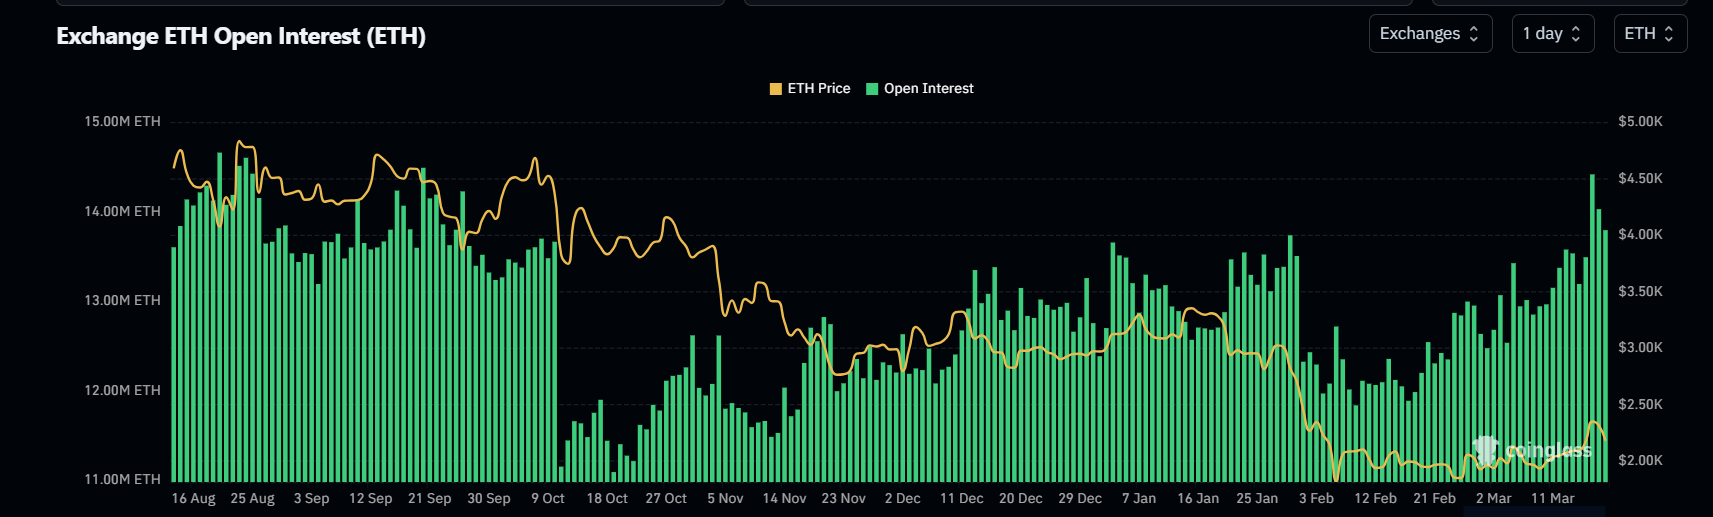
Following a brief price rise above $2,300 over the past few days, Ethereum's open interest (OI) jumped to about 14.42 million ETH on Tuesday, its highest level since September, before easing toward 13.79 million ETH on Wednesday.
Open interest is the total worth of outstanding contracts in a derivatives market. The top altcoin's OI has been rising since mid-February, indicating a gradual increase in risk appetite among derivatives traders.
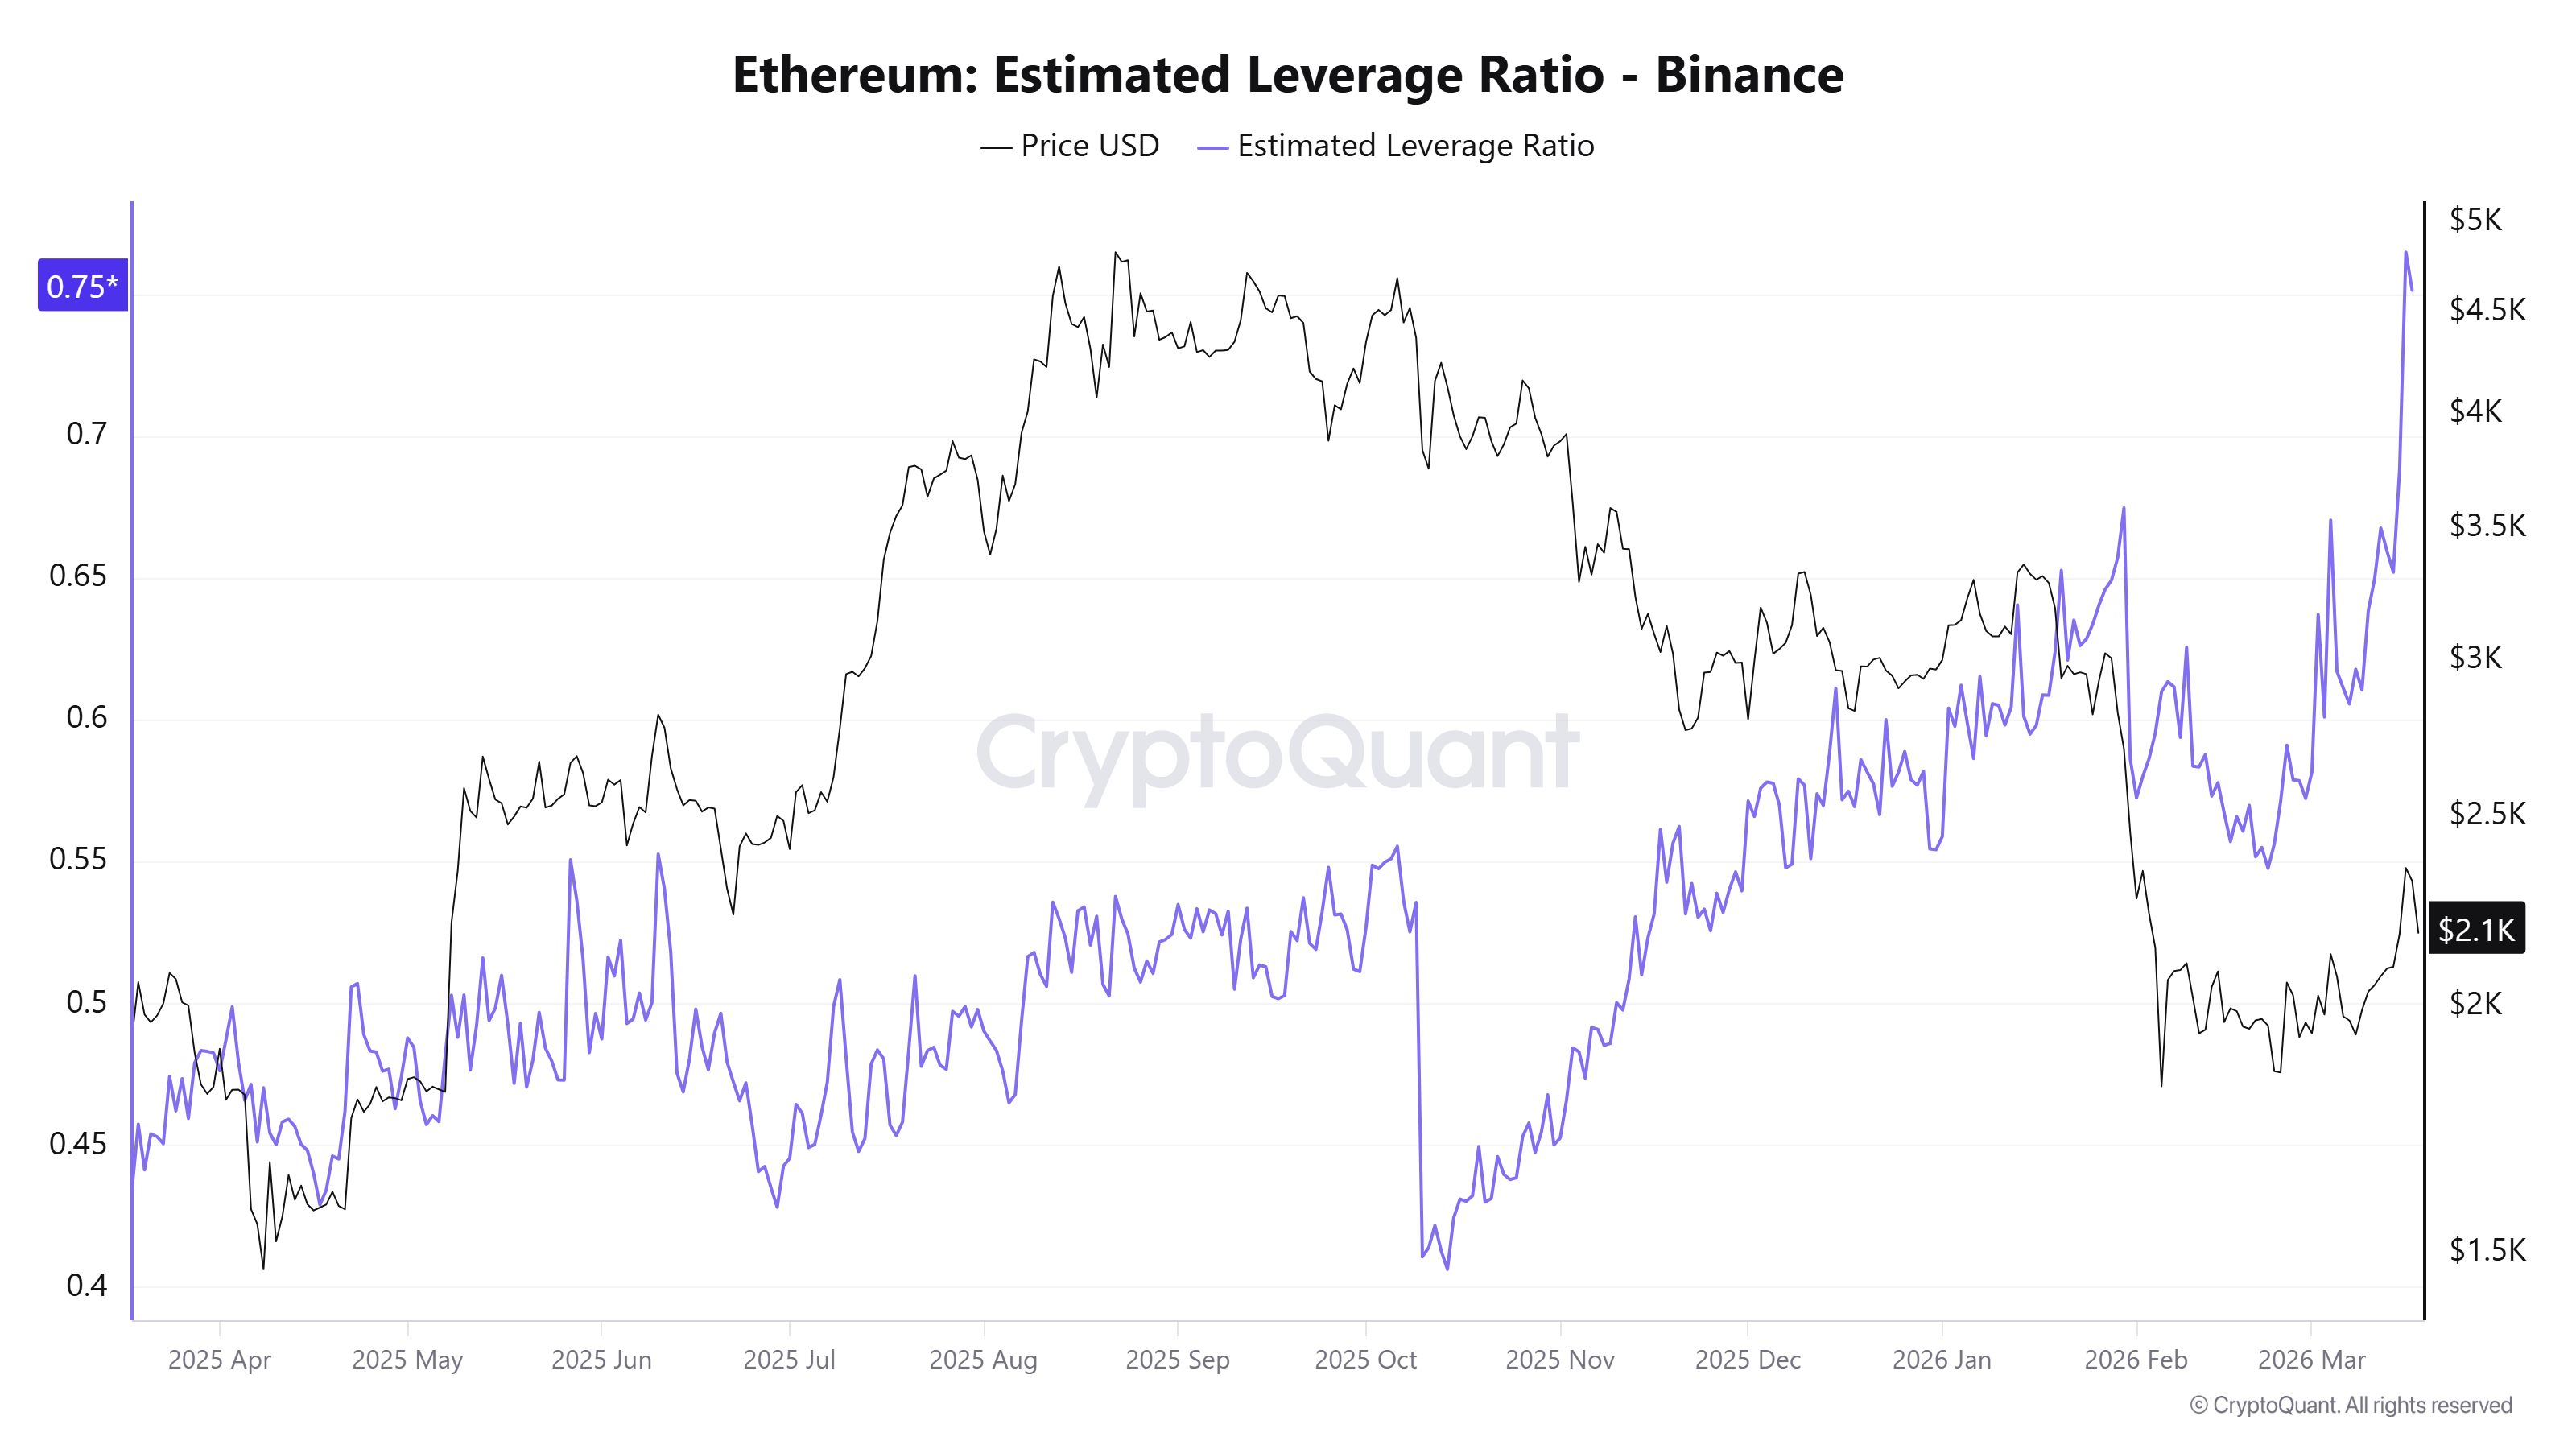
The Ethereum Estimated Leverage Ratio (ELR) also paints a similar picture. The metric tracks the average leverage applied by derivatives traders.
Following the October 10 leverage flush, ETH's ELR on Binance dropped 27% from 0.56 to 0.41. However, it has recovered since then, reaching 0.75 on Tuesday.
While positions have been largely tilted toward shorts in the past few months, a steady rise in the ETH Net Taker Volume on Binance, which climbed to $142.5 million on Tuesday, shows long trades are regaining dominance.
The Net Taker Volume measures the difference between buying and selling volume of traders using market orders.
-1773864776234-1773864776236.png)
Despite the improvement in derivatives, the top altcoin has to overcome a key onchain resistance at its realized price to continue the recovery path, as evidenced by its decline on Wednesday.
Following a brief rise above its realized price or average onchain cost basis of investors at $2,306, ETH is down 6% over the past 24 hours, aligning with earlier reports that the level has historically sparked distribution if the trend is weak.
The broader crypto market is also facing a similar downtrend on Wednesday, with Bitcoin dropping more than 5% over the past 24 hours to $71,400 at the time of writing. The weakness follows rising Oil prices and the US Federal Reserve (Fed) keeping interest rates steady at 3.5-3.75% amid sustained Middle East geopolitical tensions.
Ethereum Price Forecast: ETH eyes $2,110 support after rejection at $2,390
Ethereum has seen $139.4 million in liquidations over the past 24 hours, led by $117.7 million in long liquidations, according to Coinglass data.
ETH is on the verge of declining below the 50-day Exponential Moving Average (EMA) after seeing a rejection at the resistance near $2,390.
Immediate support is seen at the 20-day EMA around $2,110, with a break exposing the horizontal floor at $1,740 as the next significant downside level. On the topside, initial resistance remains at the horizontal barrier near $2,390, followed by the 100-day EMA zone around $2,500 and then the higher static cap at $2,746.
A daily close above $2,390 would reopen the path toward the $2,746 region, while sustained trade below $2,110 would weaken the current bullish bias and shift focus back to the broader range base around $1,740.
The Relative Strength Index (RSI) has pulled back from the overbought area toward the mid-50s, while the Stochastic Oscillator (Stoch) retreats from extreme readings, indicating fading upside momentum but not a confirmed reversal, as daily closes remain above the short-term average.
(The technical analysis of this story was written with the help of an AI tool.)
Recommended Articles


