


Ethereum Rises 7% on Familiar Rebound Cue, But On-Chain Data Flags Critical Risks
Ethereum price has staged a modest rebound, rising roughly 7% since March 8 after printing a bullish technical signal on the 8-hour chart. The move comes as the broader crypto market attempts to stabilize. However, Ethereum’s larger trend remains weak. The asset is still down about 31% year-to-date in 2026, highlighting that the broader downtrend remains intact despite the recent bounce.
Interestingly, the rebound follows a technical pattern that previously triggered a strong rally. Yet this time, several on-chain indicators suggest the recovery may face stronger resistance ahead.
Historical Bullish Divergence Triggered a 15% Rally, Earlier in March
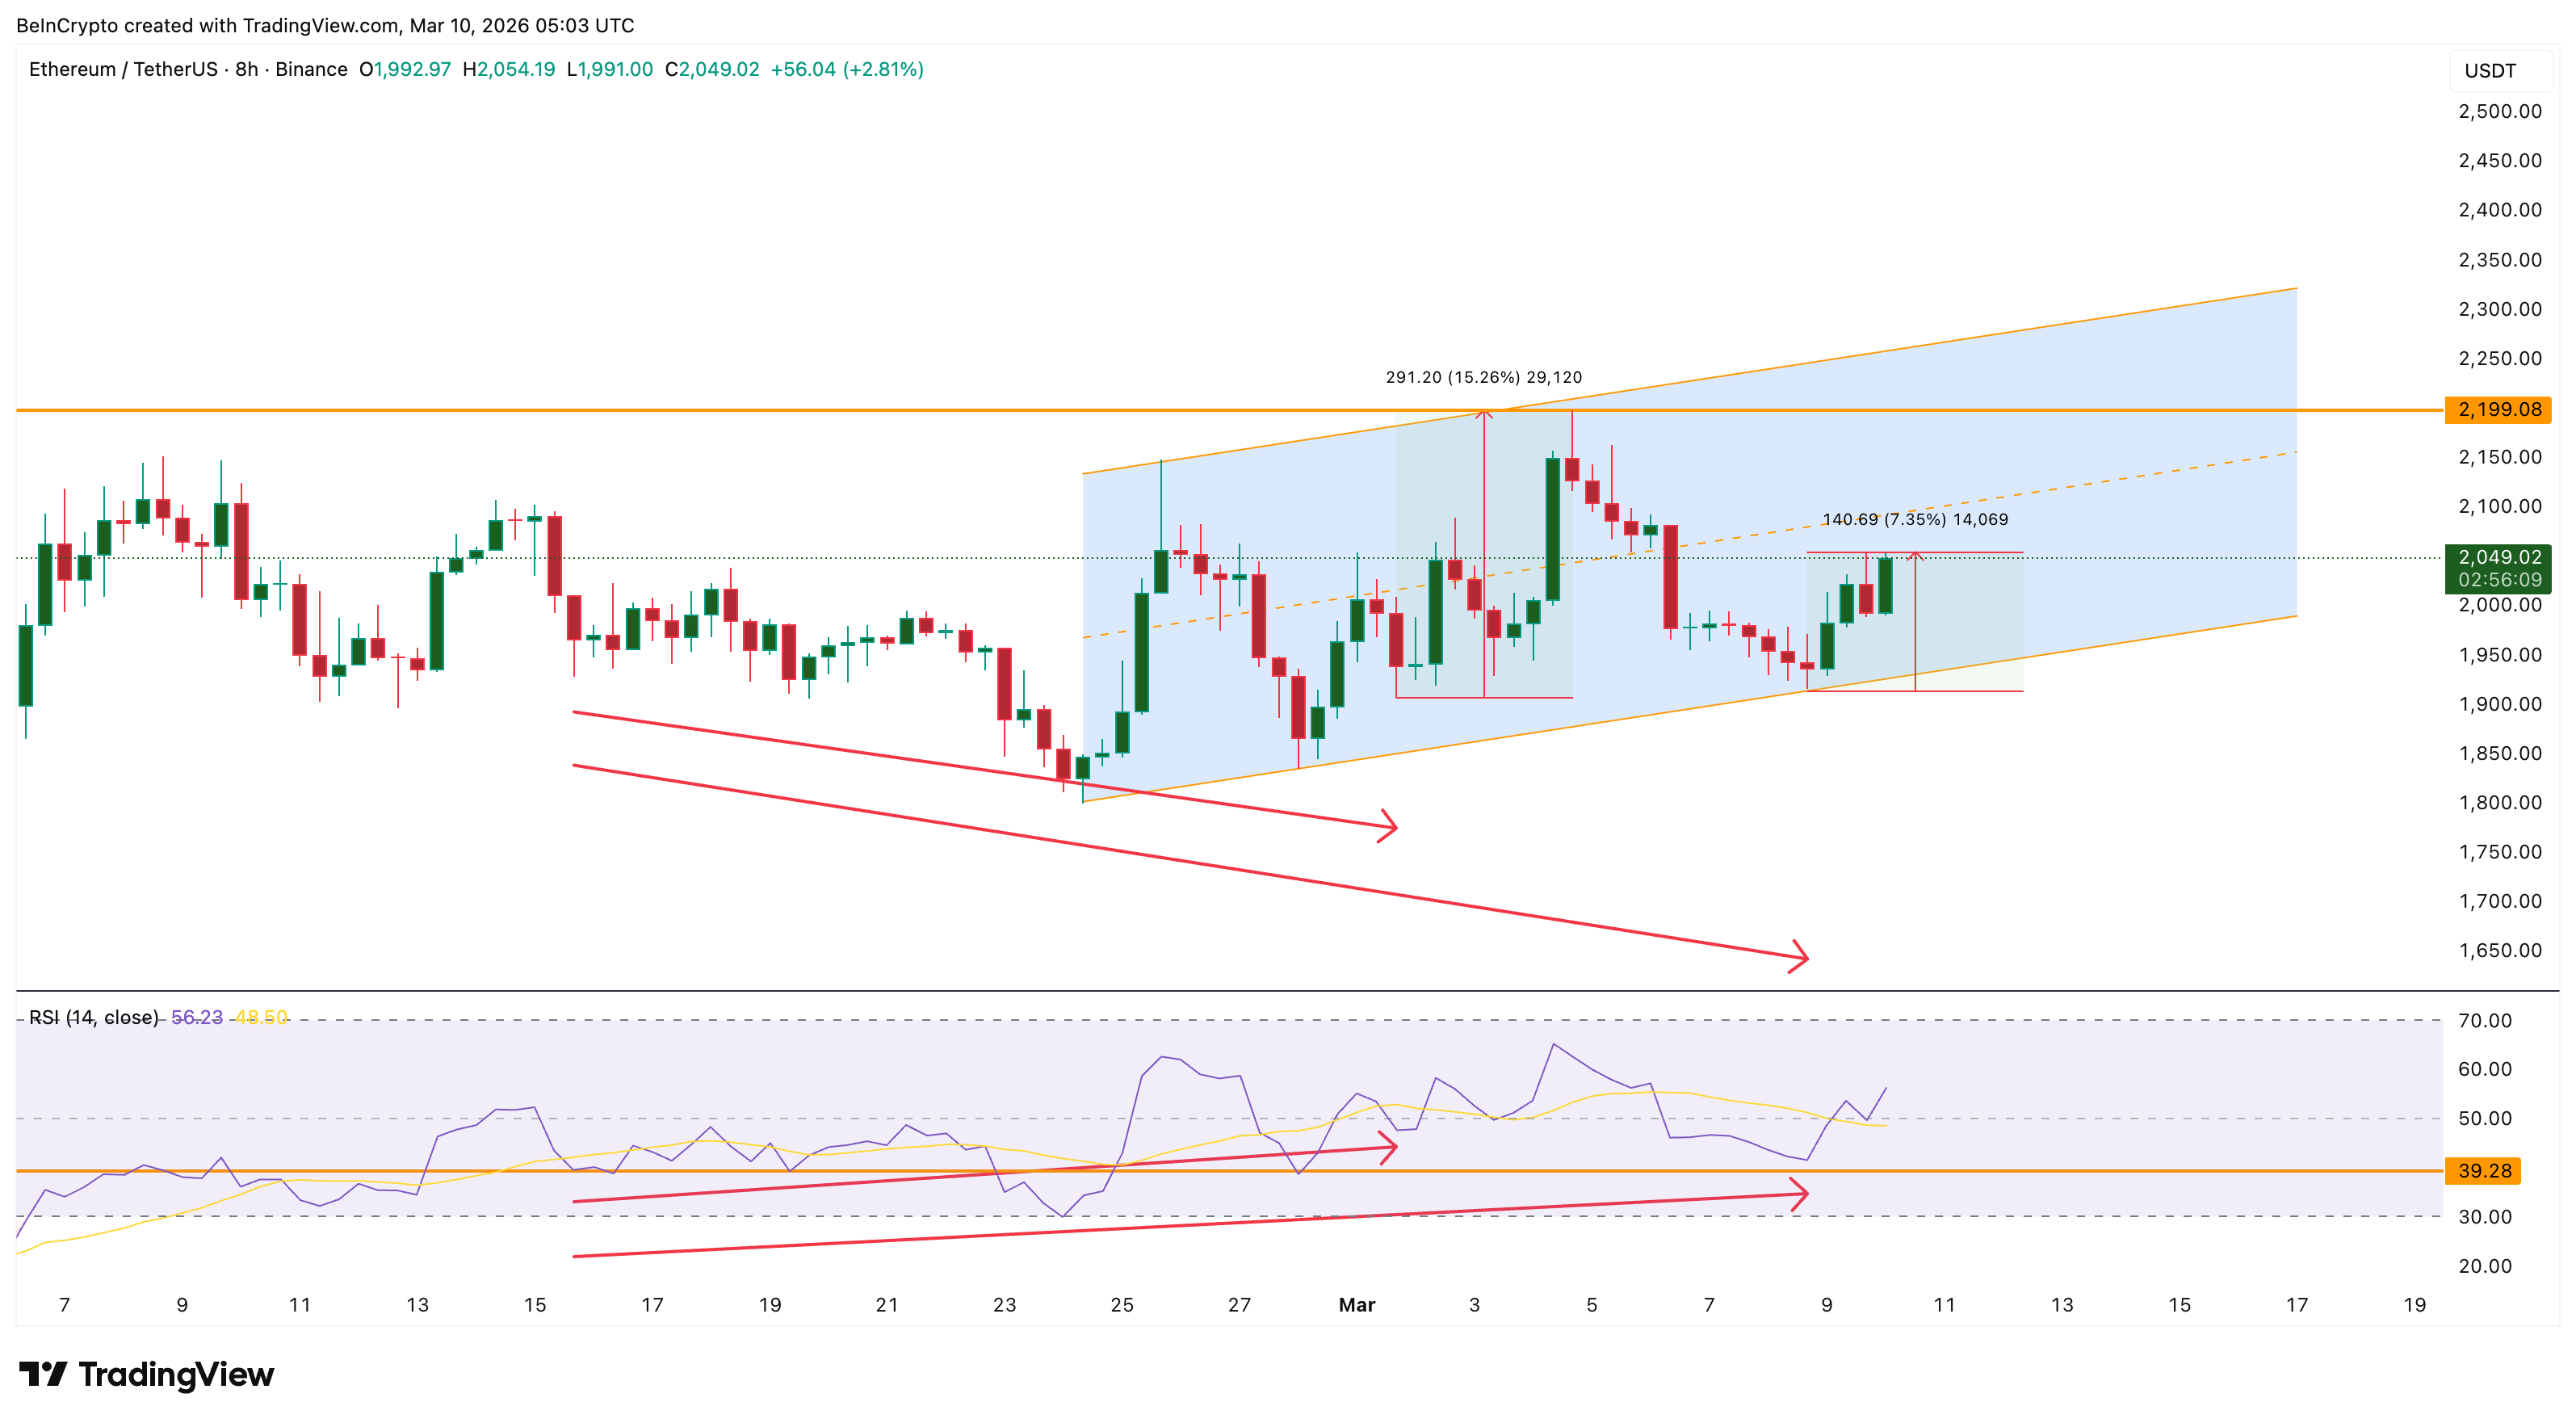
The latest rebound follows a bullish divergence on the Relative Strength Index (RSI) on the 8-hour chart. RSI is a momentum indicator that measures the speed and strength of price movements. When prices form lower lows while RSI forms higher lows, it can indicate that selling momentum is weakening.
Between February 15 and March 8, Ethereum’s price formed a lower low, while RSI created a slightly higher low, producing a classic bullish divergence.
A similar divergence appeared earlier between February 15 and March 1. After that signal flashed, Ethereum rallied more than 15%, climbing to a local high near $2,199 ($2,200 zone) before the move lost momentum.
 Bullish Divergence: TradingView
Want more token insights like this? Sign up for Editor Harsh Notariya’s Daily Crypto Newsletter here.
The latest divergence has already produced a rebound of over 7%, raising the possibility that Ethereum could attempt another move toward the $2,200 region, which acted as resistance during the previous rally.
However, the supporting data behind the current move appears weaker than during the earlier rebound.
Exchange Flows and Whale Holdings Show This Rebound Lacks Earlier Support
One major difference lies in exchange flows and whale accumulation.
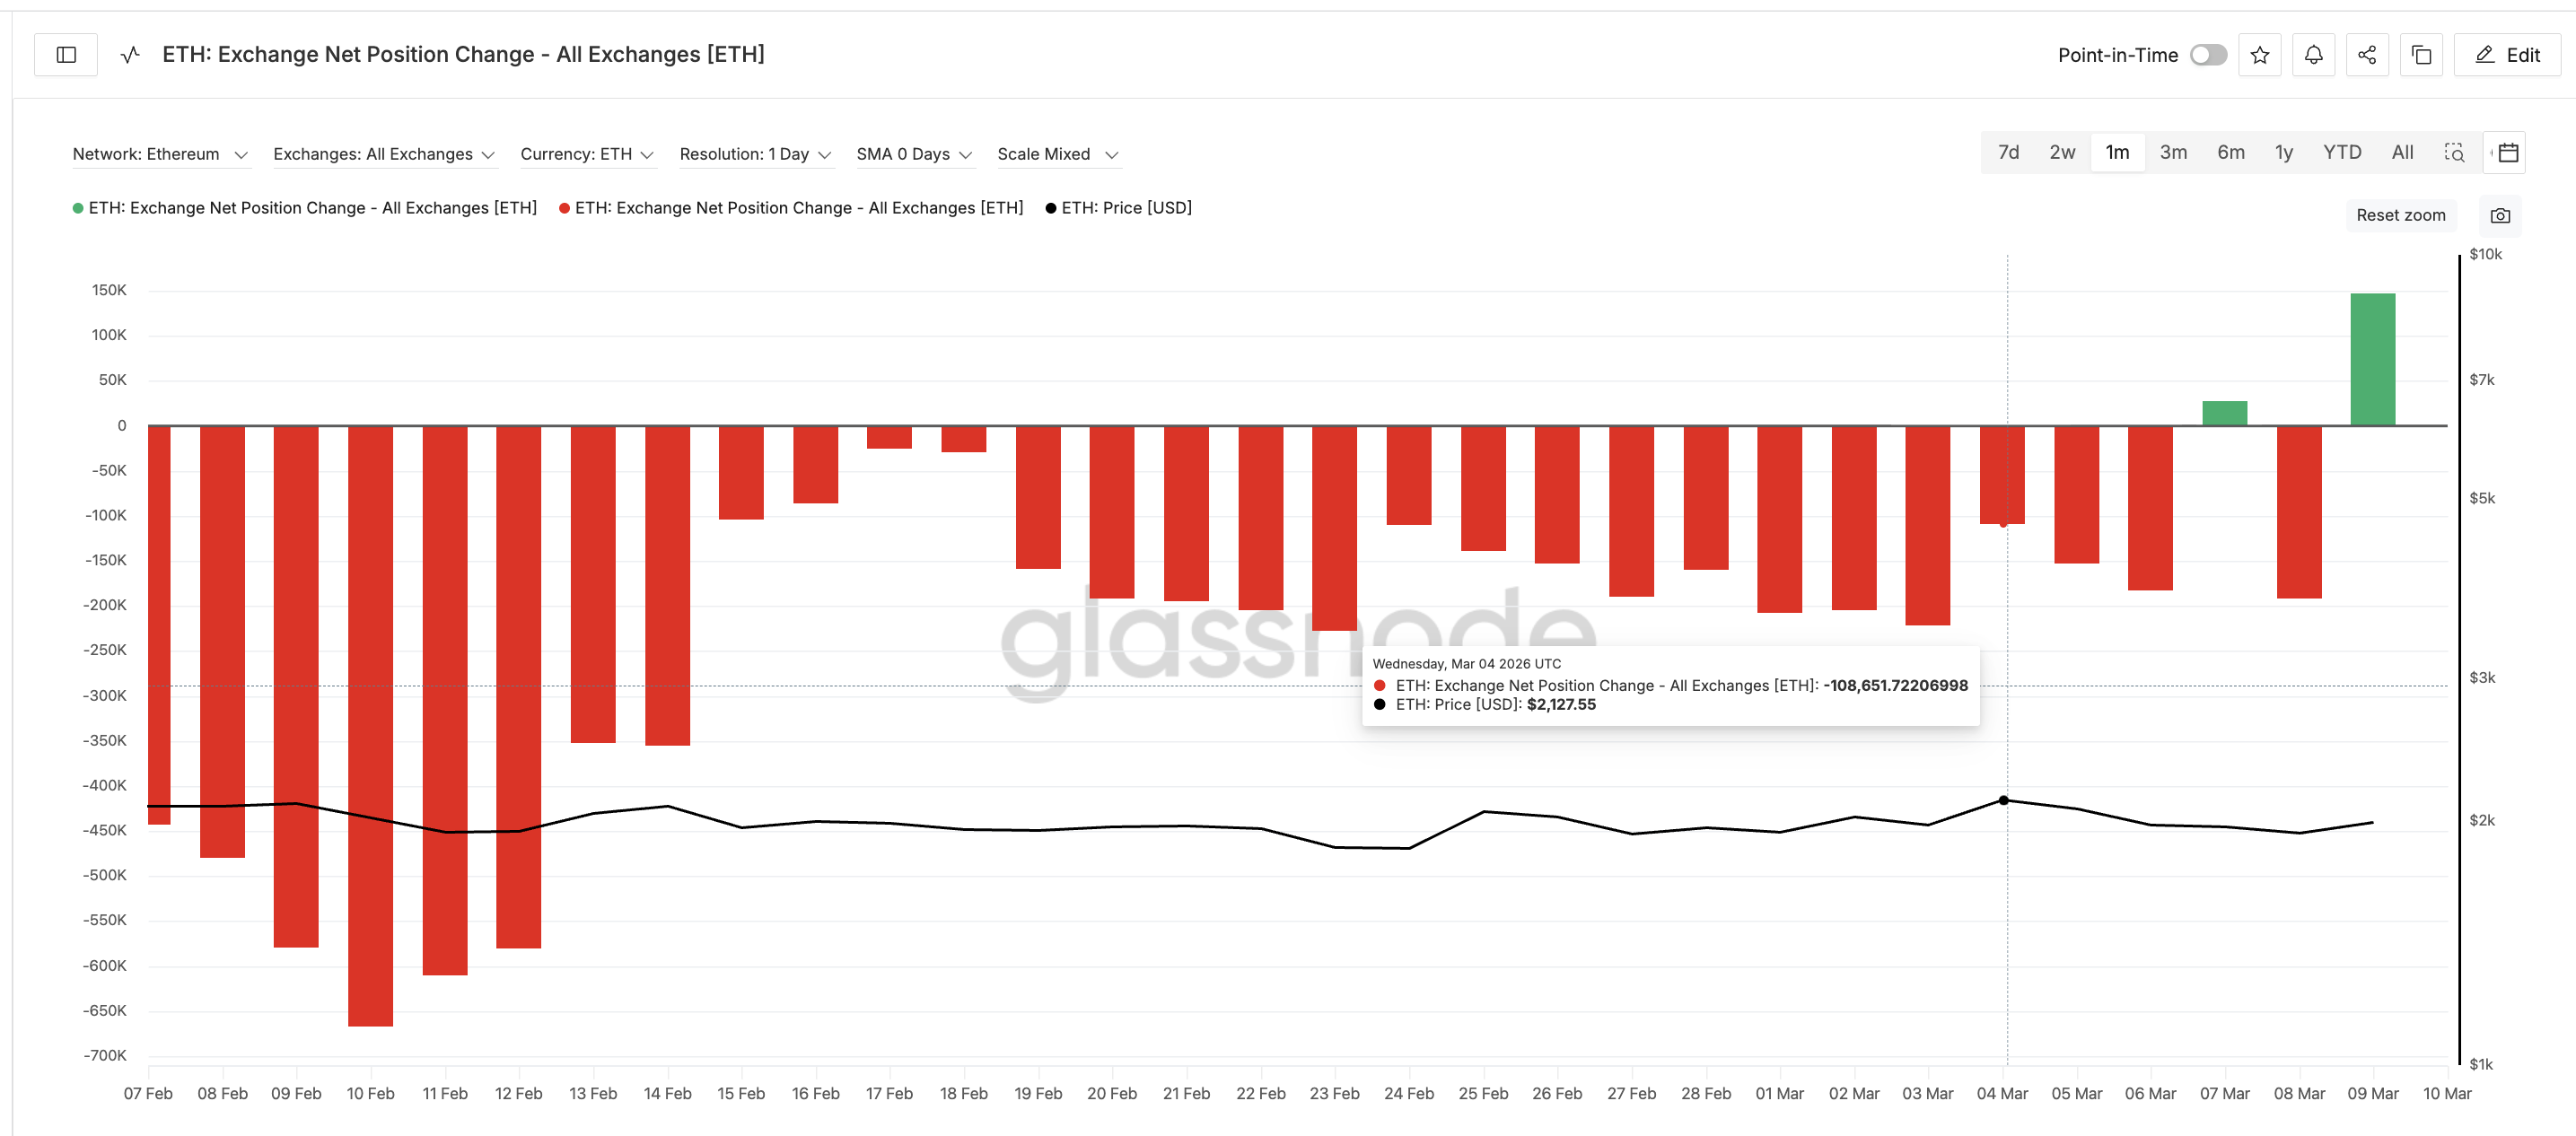
During the previous rally between March 1 and March 4 (post-divergence), Ethereum experienced continuous exchange outflows. The Exchange Net Position Change remained negative, signaling that coins were leaving exchanges, a sign of sustained buying pressure.
 ETH Exchange Flow: Glassnode
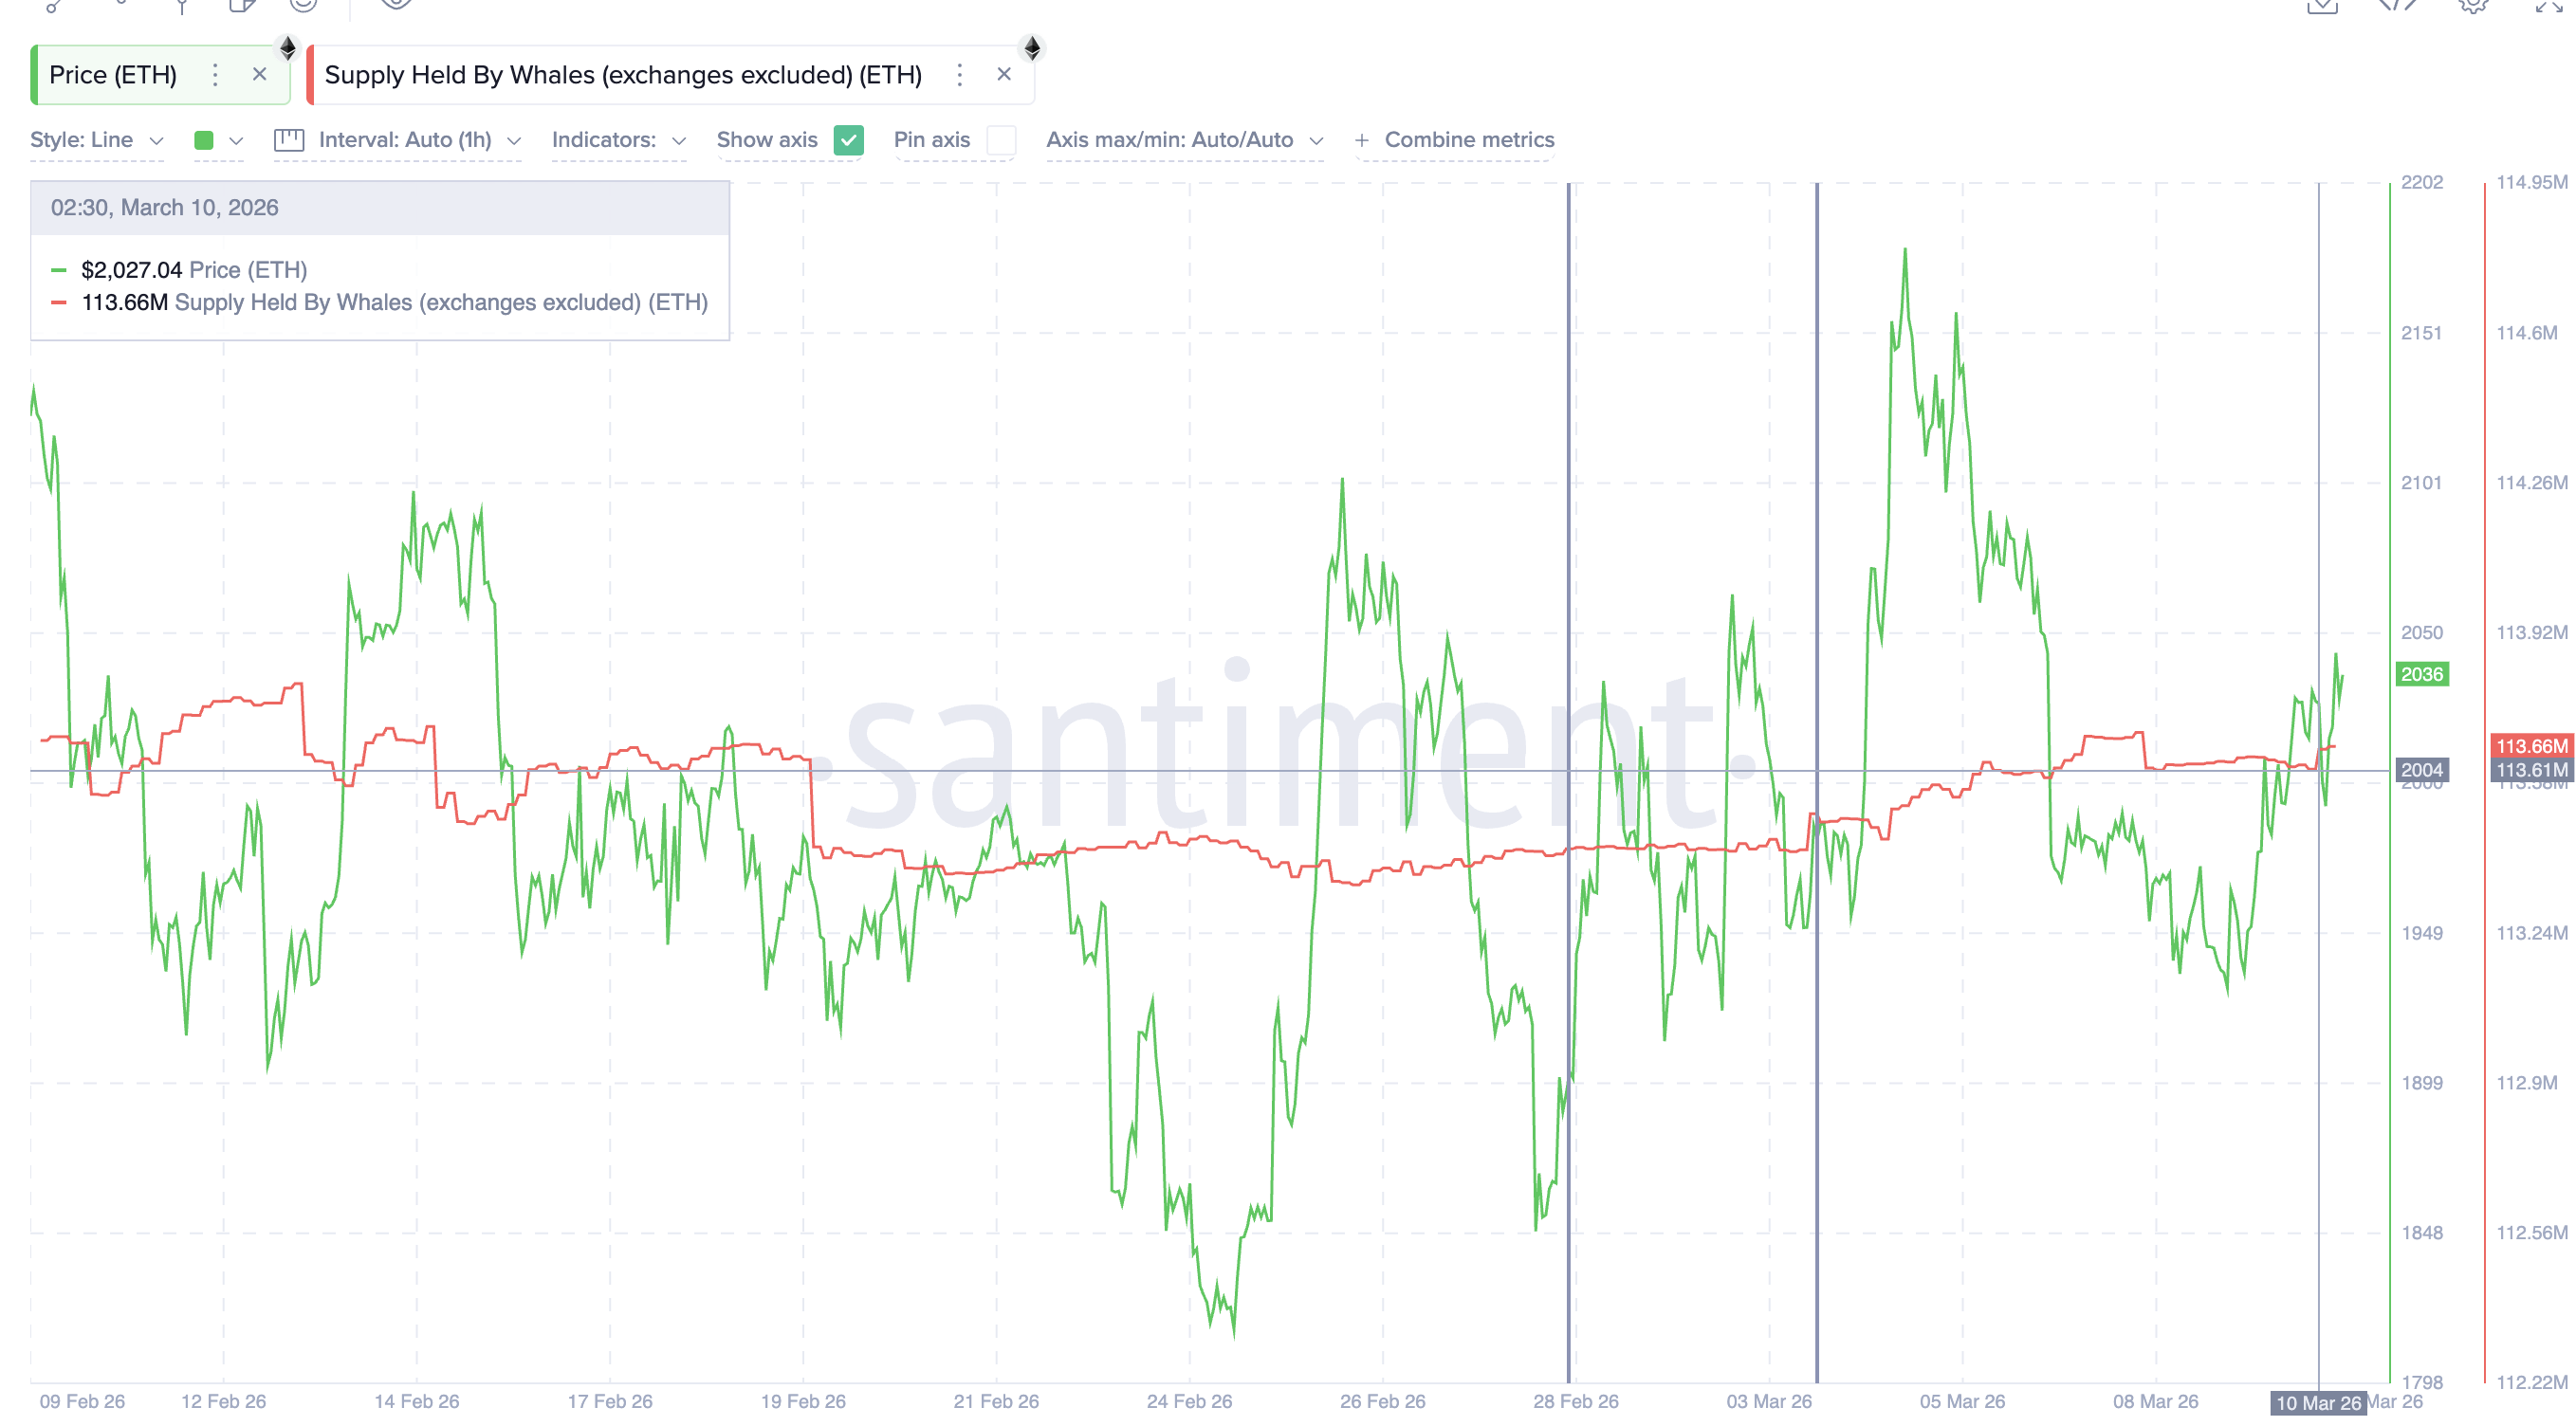
At the same time, whale wallets were accumulating. Holdings among large wallets rose from 113.43 million ETH on February 28 to 113.51 million ETH by March 3, an increase of about 80,000 ETH, reinforcing the bullish momentum.
 Ethereum Whales: Santiment
The current rebound shows the opposite pattern.
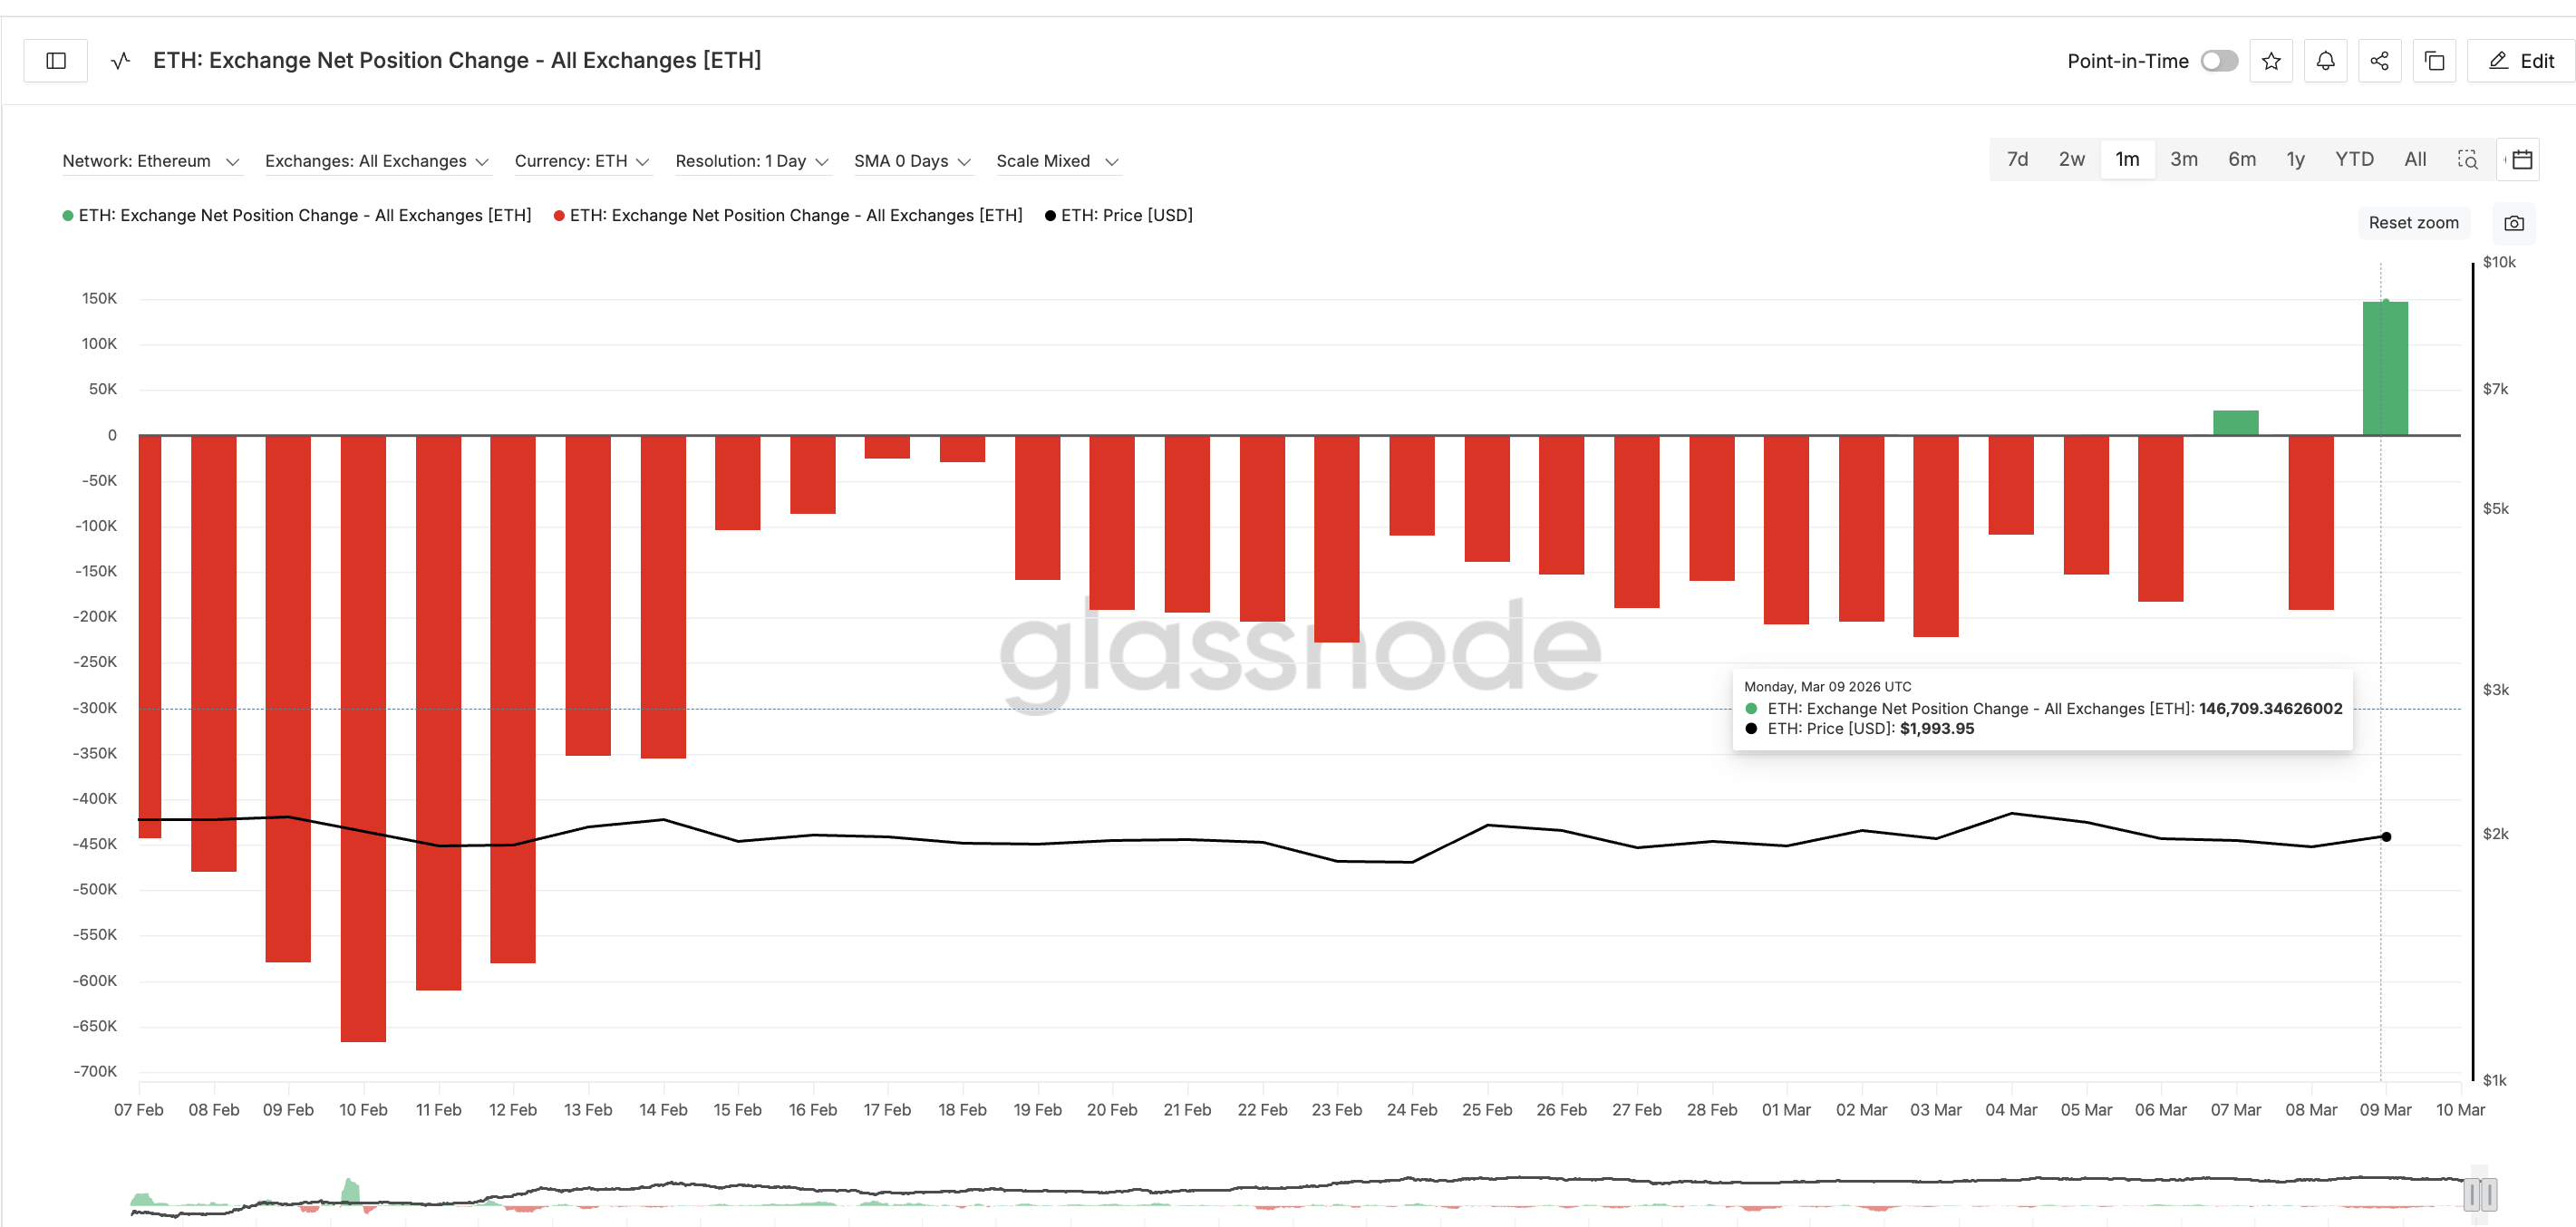
On March 9, the Exchange Net Position Change turned positive, with inflows reaching 146,709 ETH. Rising inflows typically indicate that investors are moving coins to exchanges, increasing the likelihood of selling pressure. Encountering sell pressure immediately after the divergence isn’t good for the rally hopes.
 Sell Pressure Rising: Glassnode
Whale behavior also shifted. Large holders reduced their supply from 113.70 million ETH on March 7 to about 113.61 million ETH by March 10, representing a decline of roughly 90,000 ETH.
This combination suggests that the recent rebound lacks the same accumulation support that fueled the earlier 15% ETH price rally. But that’s not the only risk.
Cost Basis Data Reveals Heavy Supply Clusters Between $2,030 and $2,180
On-chain cost-basis data further highlights potential resistance ahead.
URPD, or the UTXO Realized Price Distribution metric, shows where large portions of supply last moved on-chain. These zones often act as support or resistance because many holders may choose to sell when the price revisits their cost basis.
Note: Although URPD is originally designed for UTXO-based networks like Bitcoin, analytics platforms such as Glassnode have extended the metric to account-based chains like Ethereum.
Several notable supply clusters appear directly above Ethereum’s current price.
Approximately 1.42% of Ethereum’s supply is concentrated at around $2,029 (close to the current price). Another 1.06% cluster appears near $2,079, followed by 0.88% near $2,128 and 0.91% near $2,178.
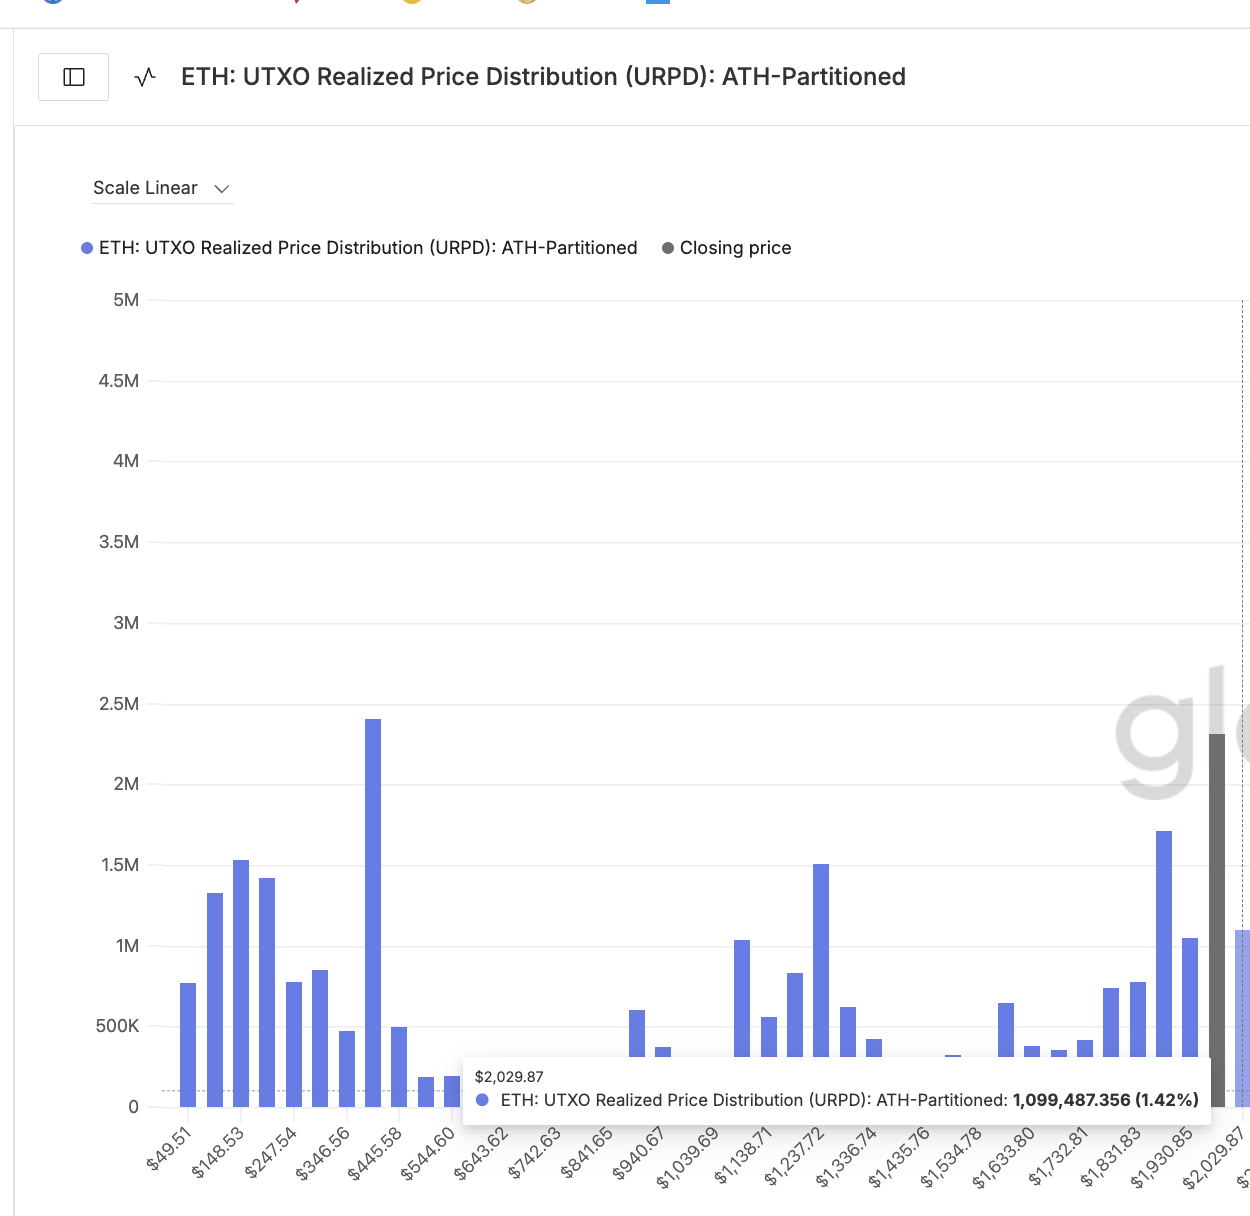 Key Cluster 1: Glassnode
Together, these levels create a dense resistance corridor where over 4% of supply sits between roughly $2,030 and $2,180.
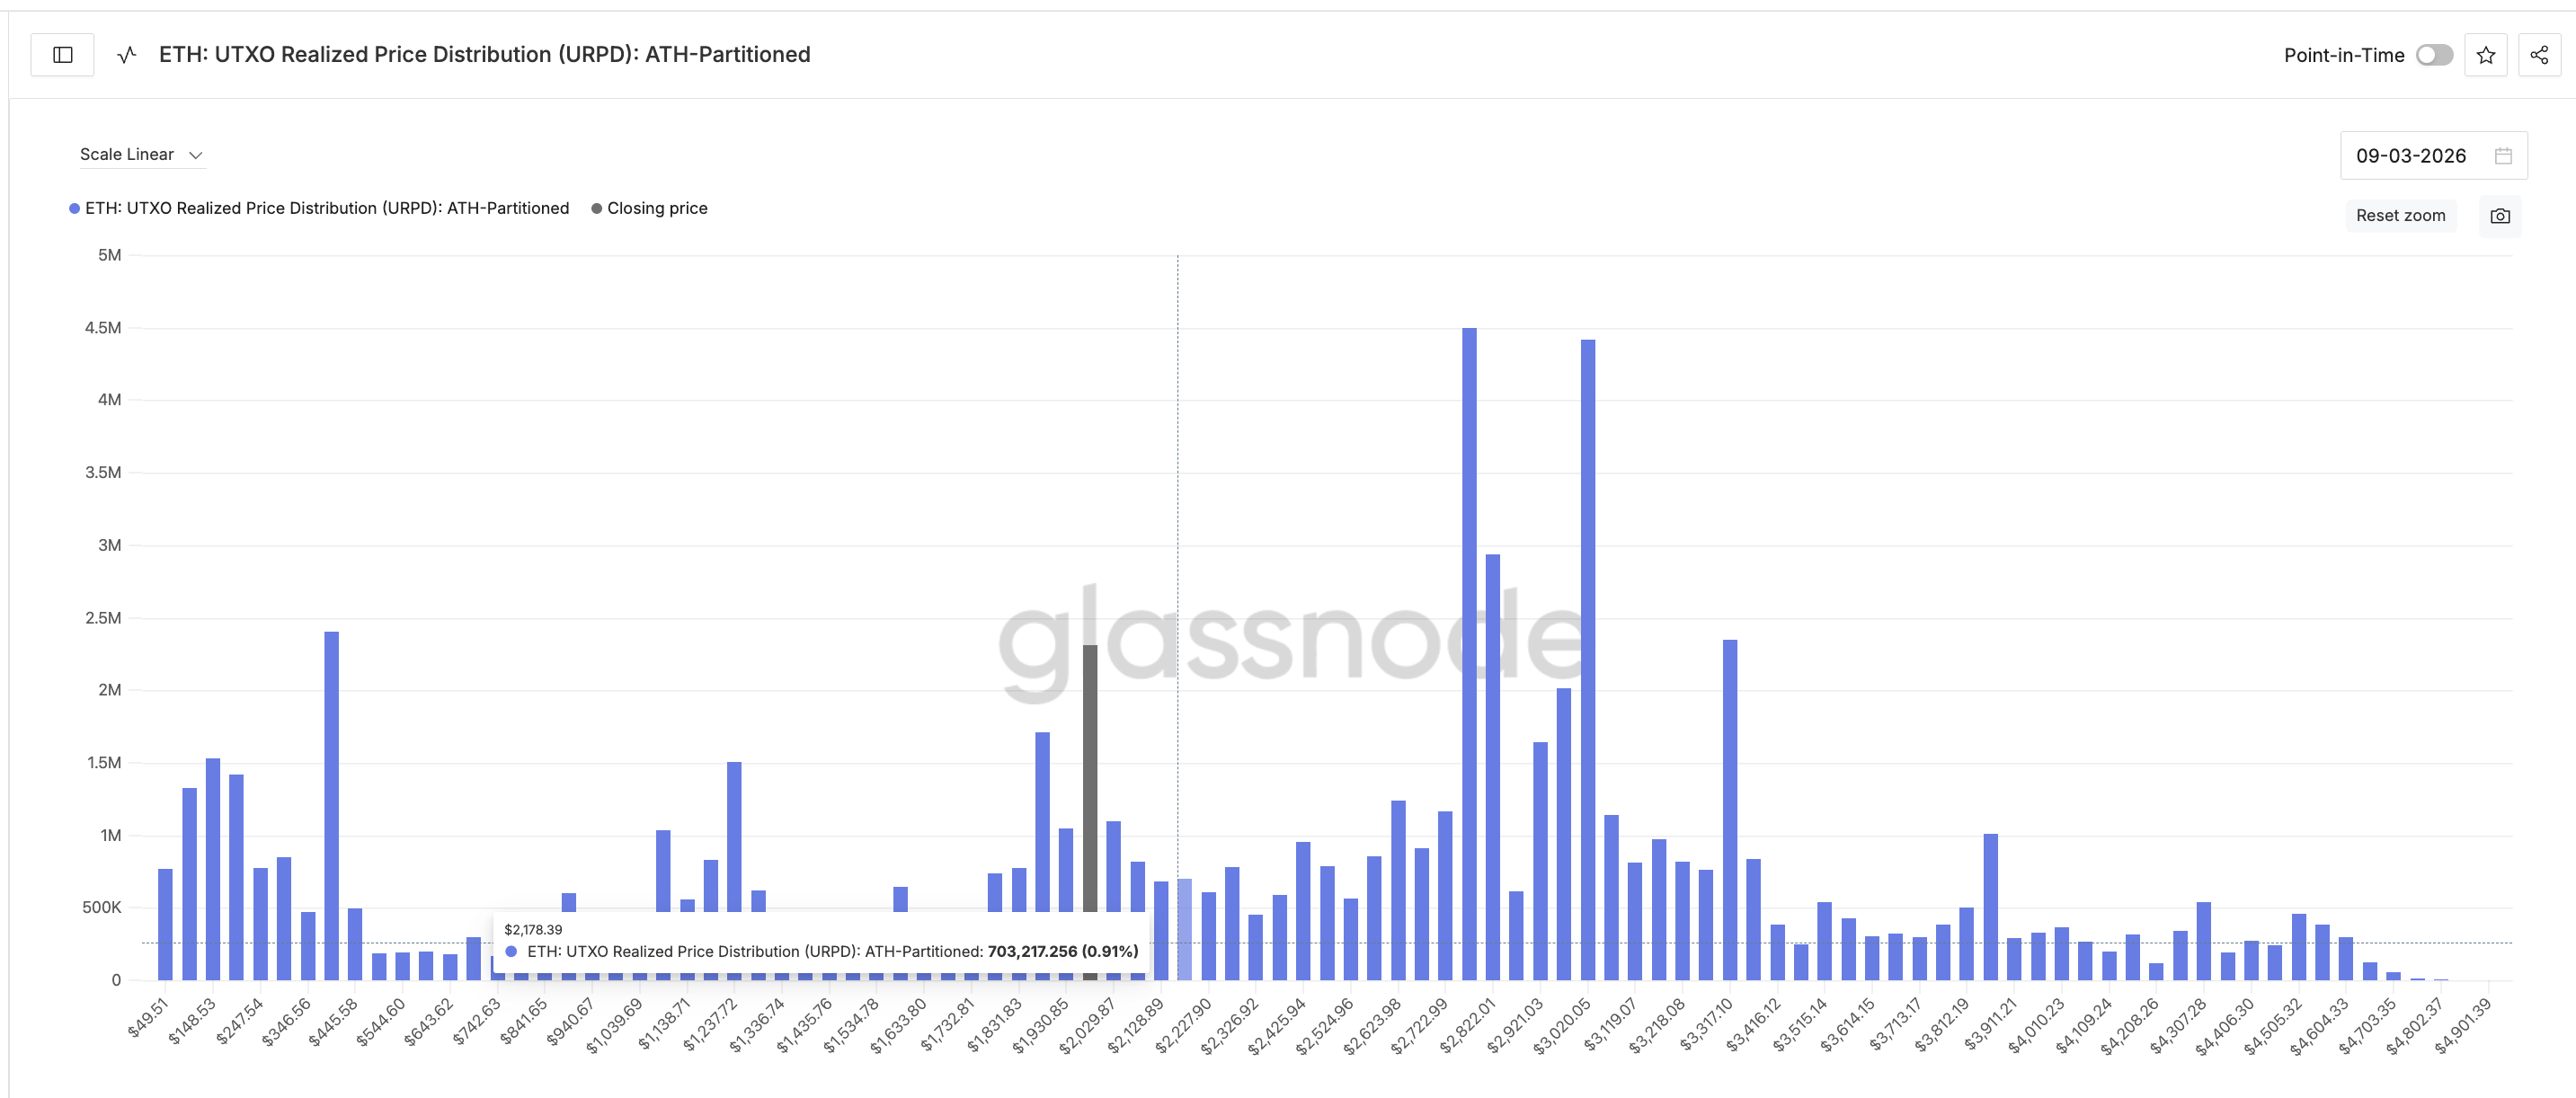 Key ETH Cluster 2: Glassnode
If holders in these zones begin selling, the rebound could face significant resistance. And the weak buying support, as seen earlier, might not be able to absorb the probable sell-off.
Ethereum Price Must Break $2,200 to Sustain Rally Hopes
From a technical perspective, Ethereum must first clear $2,130, which aligns closely with the lower URPD supply clusters.
The next critical barrier sits near the psychological $2,200 level, which previously capped the March rally. A decisive 8-hour close above $2,200 would signal that Ethereum has absorbed the nearby supply clusters, potentially opening the path toward $2,270, which also has a sizable cluster to account for.
This makes $2,270 a key resistance zone, possibly the one that needs to be crossed for rekindling hopes of a sustained rally.
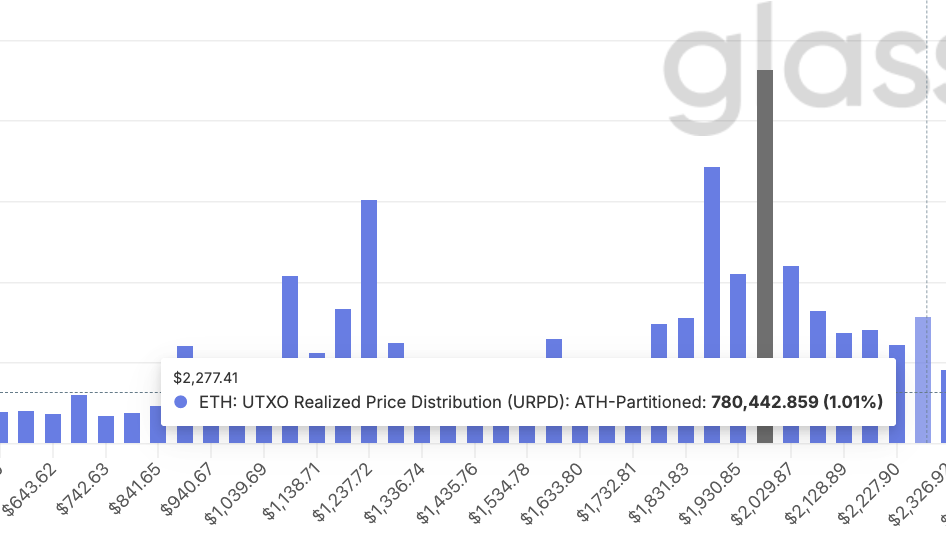 Key ETH Cluster 3: Glassnode
However, downside risks remain.
If Ethereum falls below $2,000, the rebound thesis could weaken. A further drop toward $1,910 would reinforce the broader bearish structure.
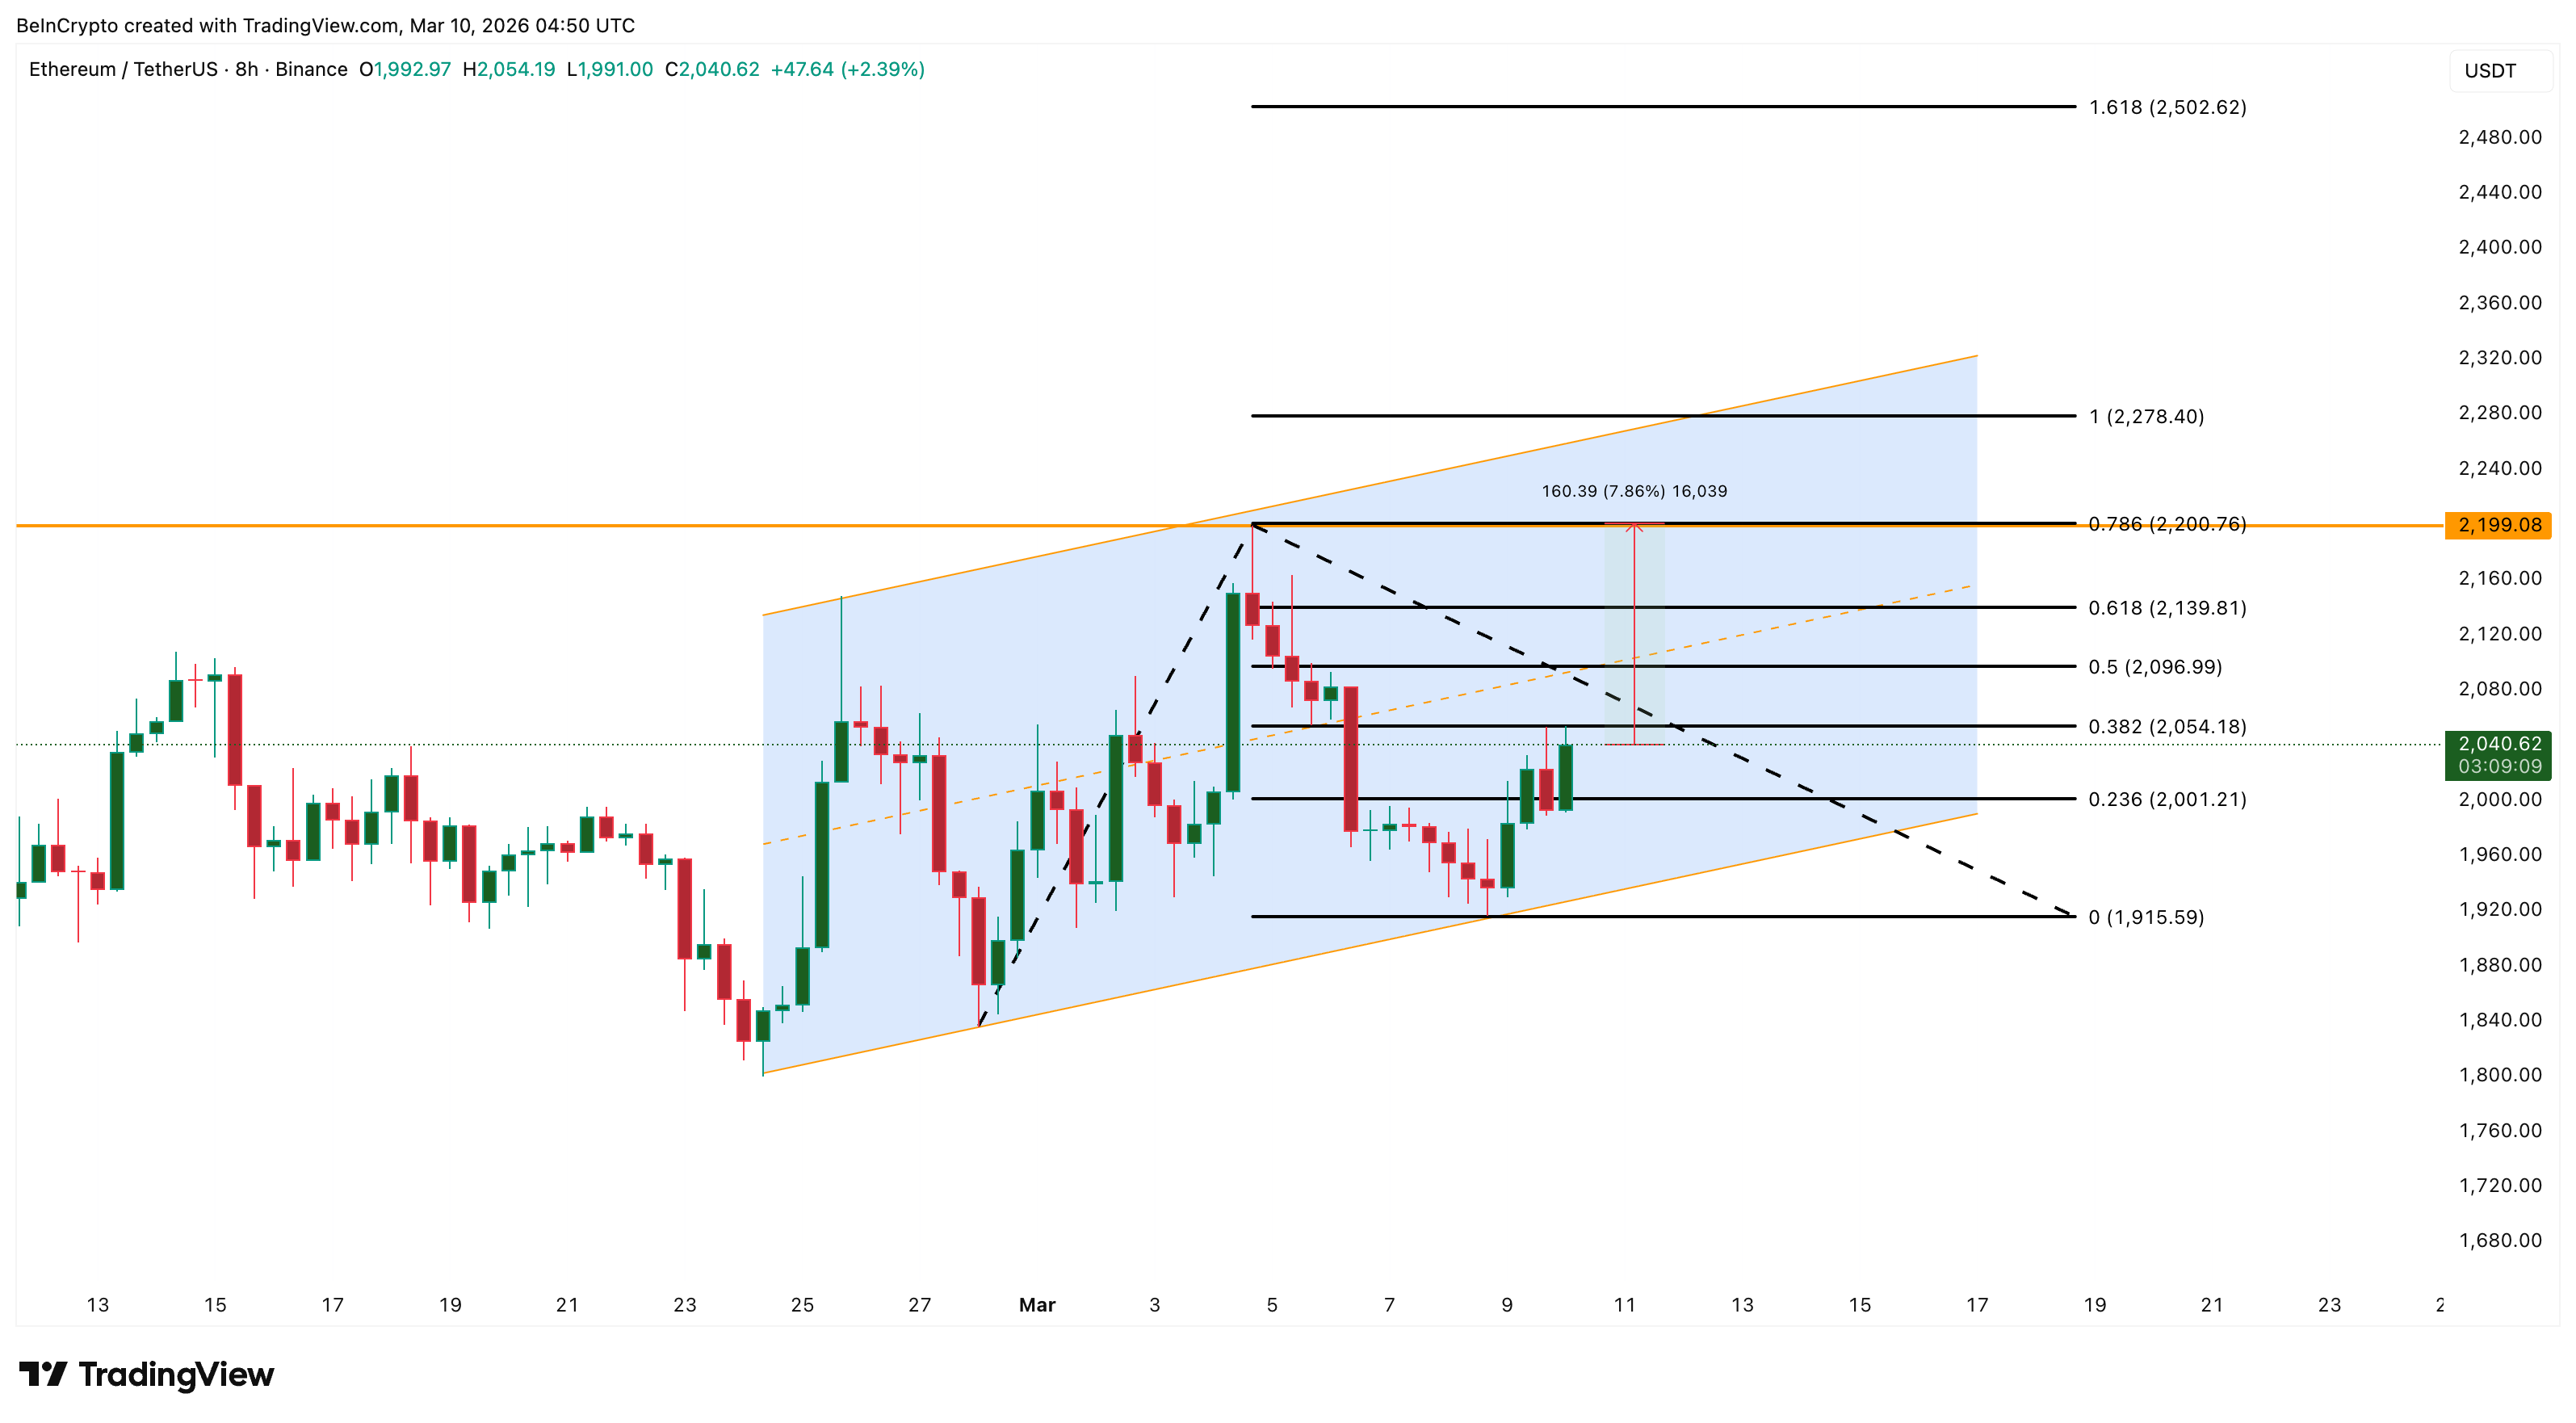 Ethereum Price Analysis: TradingView
For now, Ethereum’s latest rebound appears technically valid, but weaker on-chain support suggests the rally may face heavier resistance than the previous attempt.
Recommended Articles


