


GBP/USD Price Forecast: Eyes 50-day EMA barrier near 1.3500 despite ongoing bearish bias
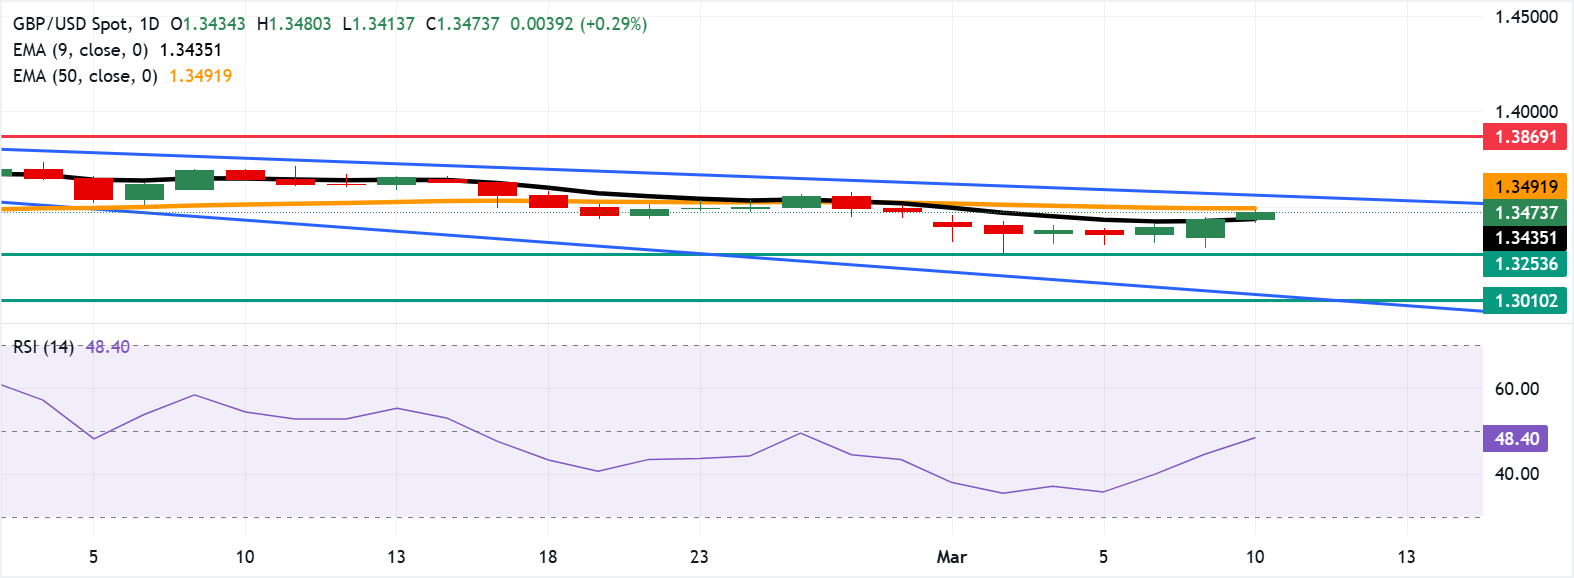
- GBP/USD may find primary support at the nine-day EMA of 1.3433.
- The 14-day Relative Strength Index rebounds from near-oversold levels but remains below the 50 mark.
- The primary barrier lies at the 50-day EMA of 1.3492.
GBP/USD extends its gains for the third successive session, trading around 1.3480 during the early European hours on Tuesday. The pair holds a mildly bearish short-term bias as price sits just below the 50-day Exponential Moving Average (EMA) while remaining above the faster nine-day moving average, which has turned lower and tracks the recent series of lower highs.
Additionally, the technical analysis of the daily chart indicates an ongoing bearish bias, as the pair trades within a descending channel pattern. Momentum signals confirm fading upside pressure, with the 14-day Relative Strength Index (RSI), a momentum indicator, recovering from near-oversold territory but still holding below the 50 line, indicating that bounces remain corrective within a softening daily structure.
The immediate support lies at the nine-day EMA of 1.3433. A break below this level would weaken the short-term price momentum and expose the next support at the reversal zone around 1.3350. Further declines would put downward pressure on the GBP/USD pair, pushing it toward the descending channel around 1.3050, followed by the 11-month low at 1.3010.
On the upside, the primary barrier is seen at the 50-day EMA at 1.3492. Further advances above these averages would improve the momentum and expose the upper descending channel boundary around 1.3590. A break above the channel would support the bullish bias and support the GBP/USD pair to test the 1.3869, the highest since September 2021, reached on January 27.
(The technical analysis of this story was written with the help of an AI tool.)
Pound Sterling Price Today
The table below shows the percentage change of British Pound (GBP) against listed major currencies today. British Pound was the strongest against the US Dollar.
| USD | EUR | GBP | JPY | CAD | AUD | NZD | CHF | |
|---|---|---|---|---|---|---|---|---|
| USD | -0.19% | -0.31% | -0.20% | -0.12% | -0.52% | -0.09% | -0.23% | |
| EUR | 0.19% | -0.09% | 0.00% | 0.07% | -0.32% | 0.10% | -0.02% | |
| GBP | 0.31% | 0.09% | 0.04% | 0.15% | -0.23% | 0.19% | 0.08% | |
| JPY | 0.20% | 0.00% | -0.04% | 0.09% | -0.31% | 0.12% | 0.01% | |
| CAD | 0.12% | -0.07% | -0.15% | -0.09% | -0.40% | 0.03% | -0.07% | |
| AUD | 0.52% | 0.32% | 0.23% | 0.31% | 0.40% | 0.41% | 0.31% | |
| NZD | 0.09% | -0.10% | -0.19% | -0.12% | -0.03% | -0.41% | -0.10% | |
| CHF | 0.23% | 0.02% | -0.08% | -0.01% | 0.07% | -0.31% | 0.10% |
The heat map shows percentage changes of major currencies against each other. The base currency is picked from the left column, while the quote currency is picked from the top row. For example, if you pick the British Pound from the left column and move along the horizontal line to the US Dollar, the percentage change displayed in the box will represent GBP (base)/USD (quote).
Recommended Articles


