


Expert Flags $63,000 Bitcoin Risk While Charts Eye 18% Rally — Which Comes First?


Bitcoin price is approaching a critical decision zone. One analyst warns the market cannot afford to lose the $63,000 zone ($63,700 to be exact), a break that could trigger a deeper decline.
Yet at the same time, the daily chart is quietly forming a bullish cup-and-handle pattern that points to a rally toward $88,000. With bullish structure and rising risk levels colliding, the next move could define Bitcoin’s short-term trend.
Expert Flags $63,700 Risk Even as a Bullish Setup Forms
The warning comes from Alphractal founder Joao Wedson, who recently highlighted $63,700 as a critical on-chain structural level for Bitcoin. The analysis states that losing that level could trigger a broader redistribution phase in the market.
If the level breaks, Wedson identifies a few potential downside zones: $57,000 and $52,400 being the nearest ones. He also notes that these levels adjust daily based on investor activity across the blockchain, meaning these dynamic thresholds can move around a bit.
However, the Bitcoin price chart currently tells a different story.
On the daily timeframe, Bitcoin appears to be shaping a cup-and-handle formation that began forming around February 8 and completed its cup phase near March 4. The market is now consolidating within the handle portion of the pattern.
If Bitcoin breaks the neckline near $74,500, the pattern projects a potential 18% rally toward the $88,100 region.
Want more token insights like this? Sign up for Editor Harsh Notariya’s Daily Crypto Newsletter here.
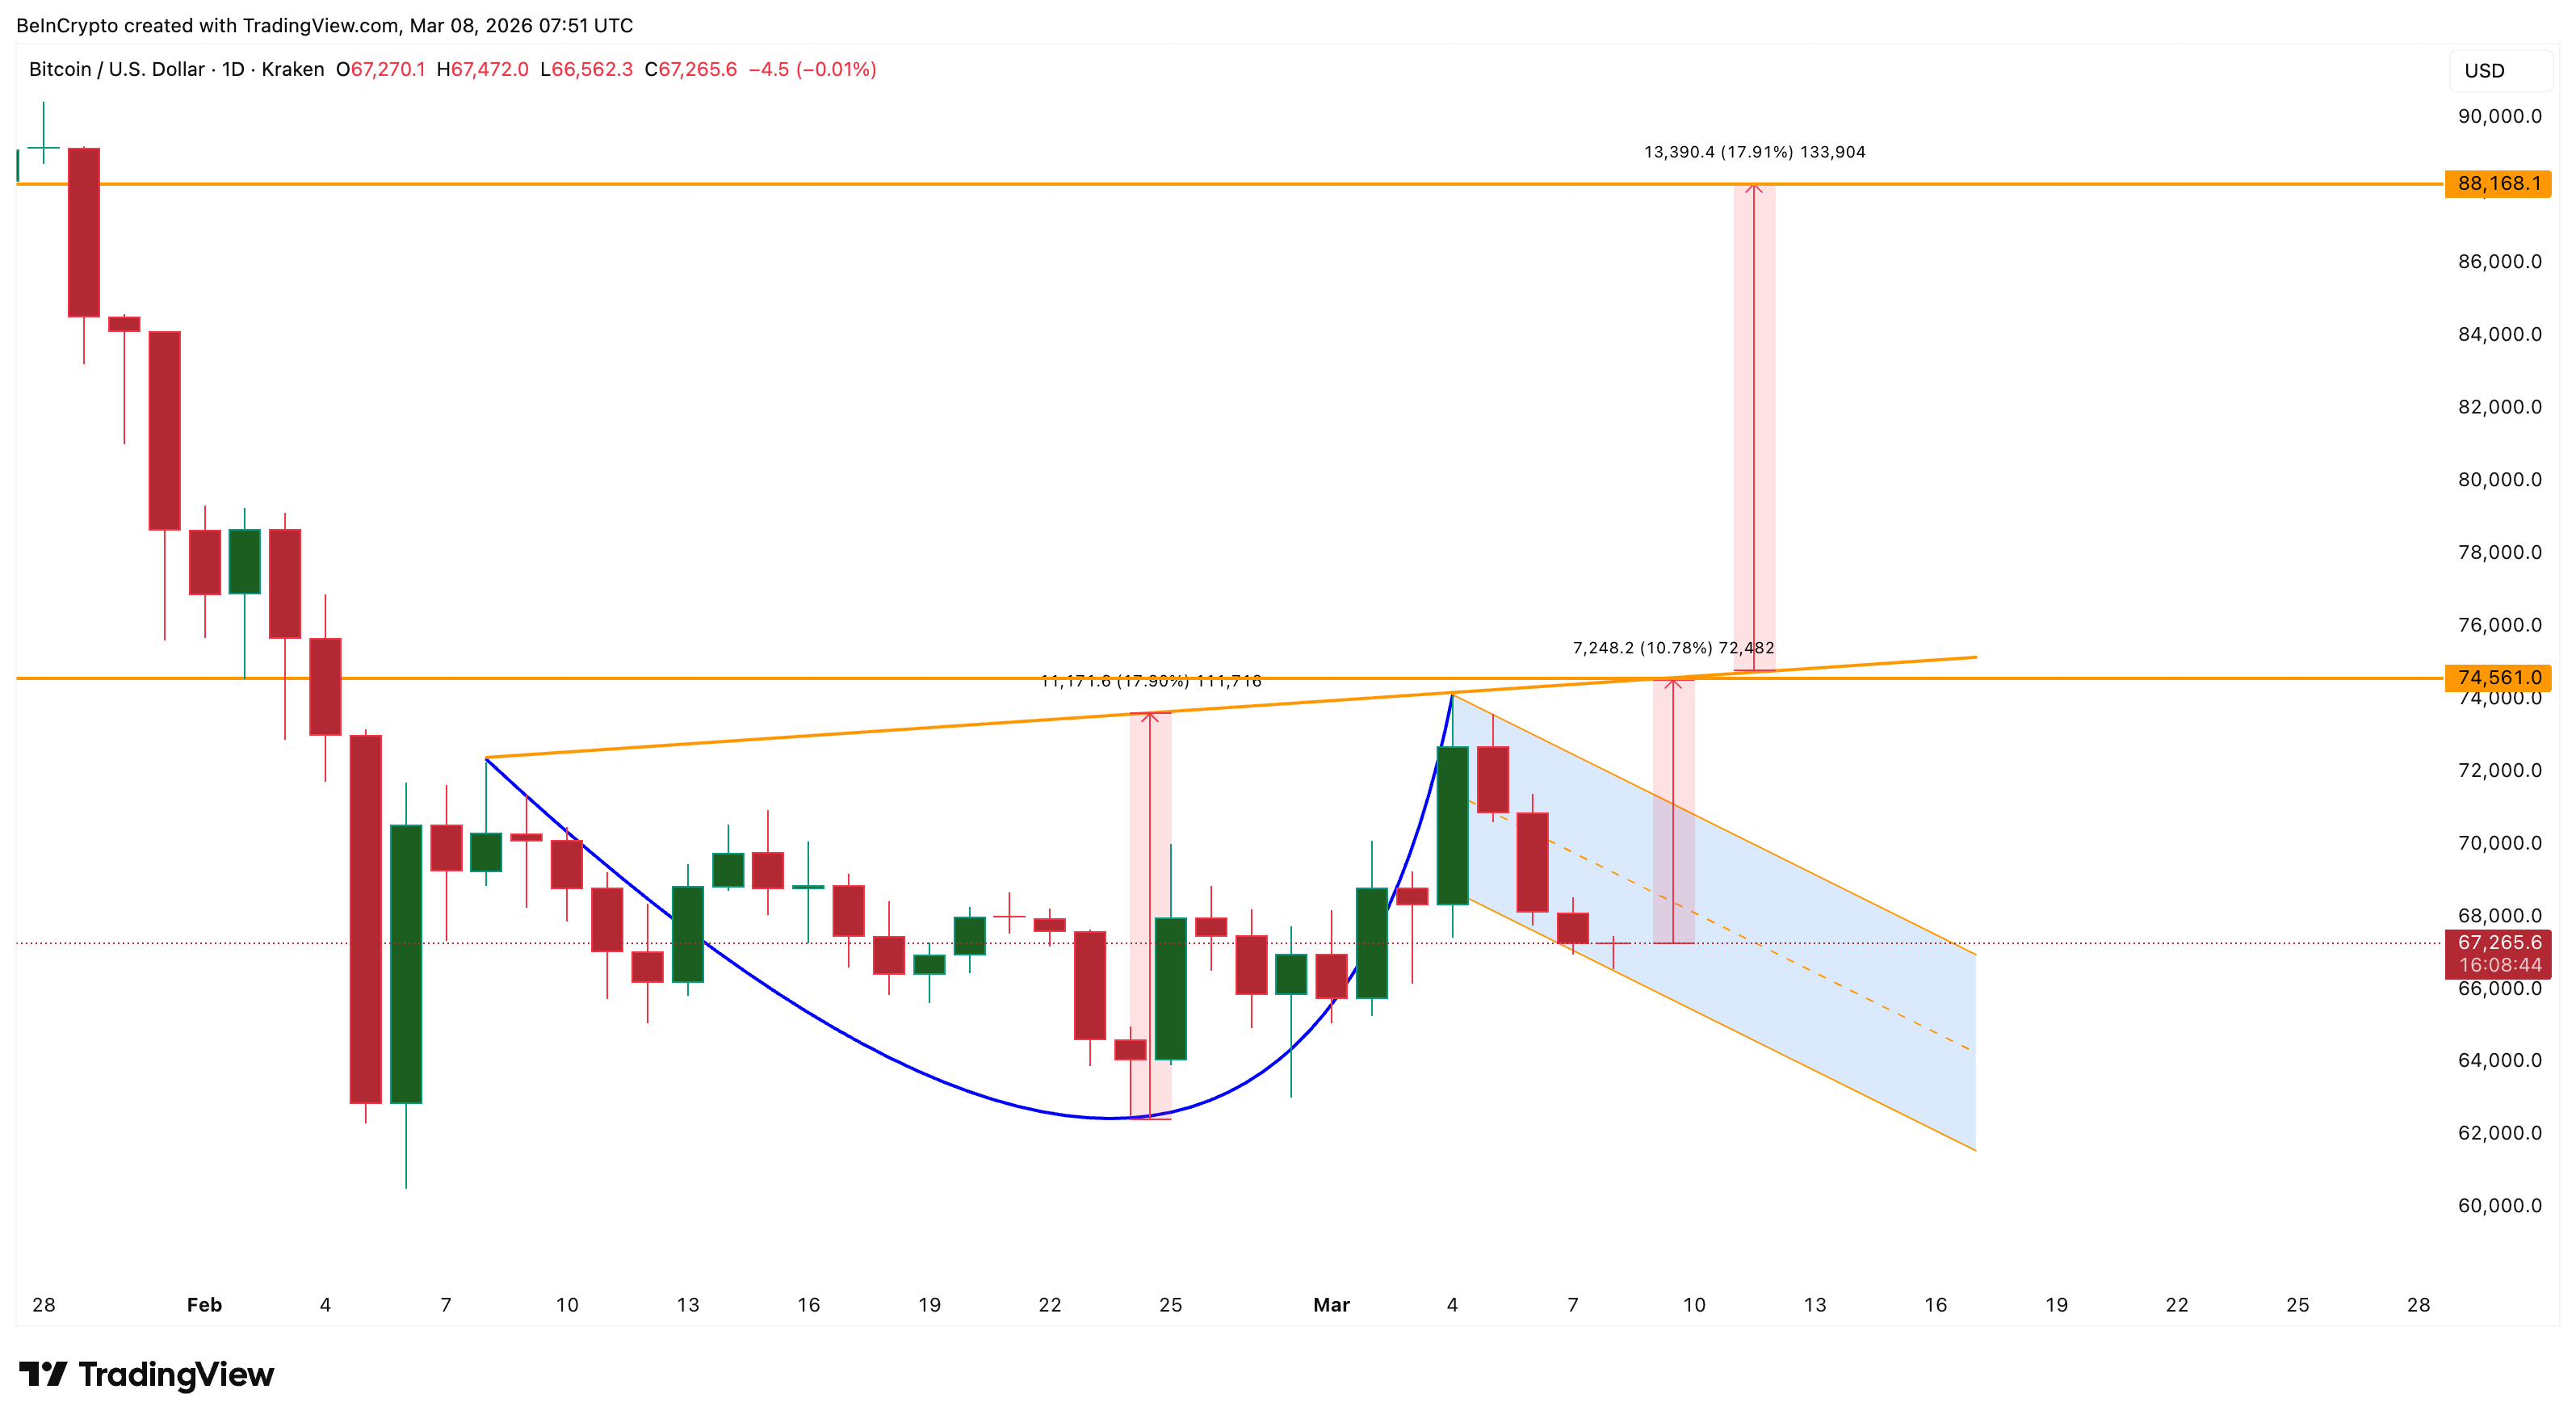
This creates a key contradiction: the bullish breakout sits over 10% above current prices, while the critical support level flagged by the expert analyst lies only a few levels below
So while the chart structure looks constructive, the closer risk level could determine the market’s next move. To get a deeper sense of things, we now move on-chain.
Whales and Mid-Term Holders Are Accumulating
On-chain activity currently leans bullish.
One of the strongest signals comes from Bitcoin’s Holder Net Position Change, which tracks accumulation by wallets holding coins for 155 days or longer. When this metric rises, it typically signals investors are choosing to hold rather than sell.
Since February 8, when the cup formation began developing, this metric has increased sharply. The 30-day net position change moved from roughly 5,434 BTC to more than 41,107 BTC by March 7. That’s a 650% rise, while the cup formed.
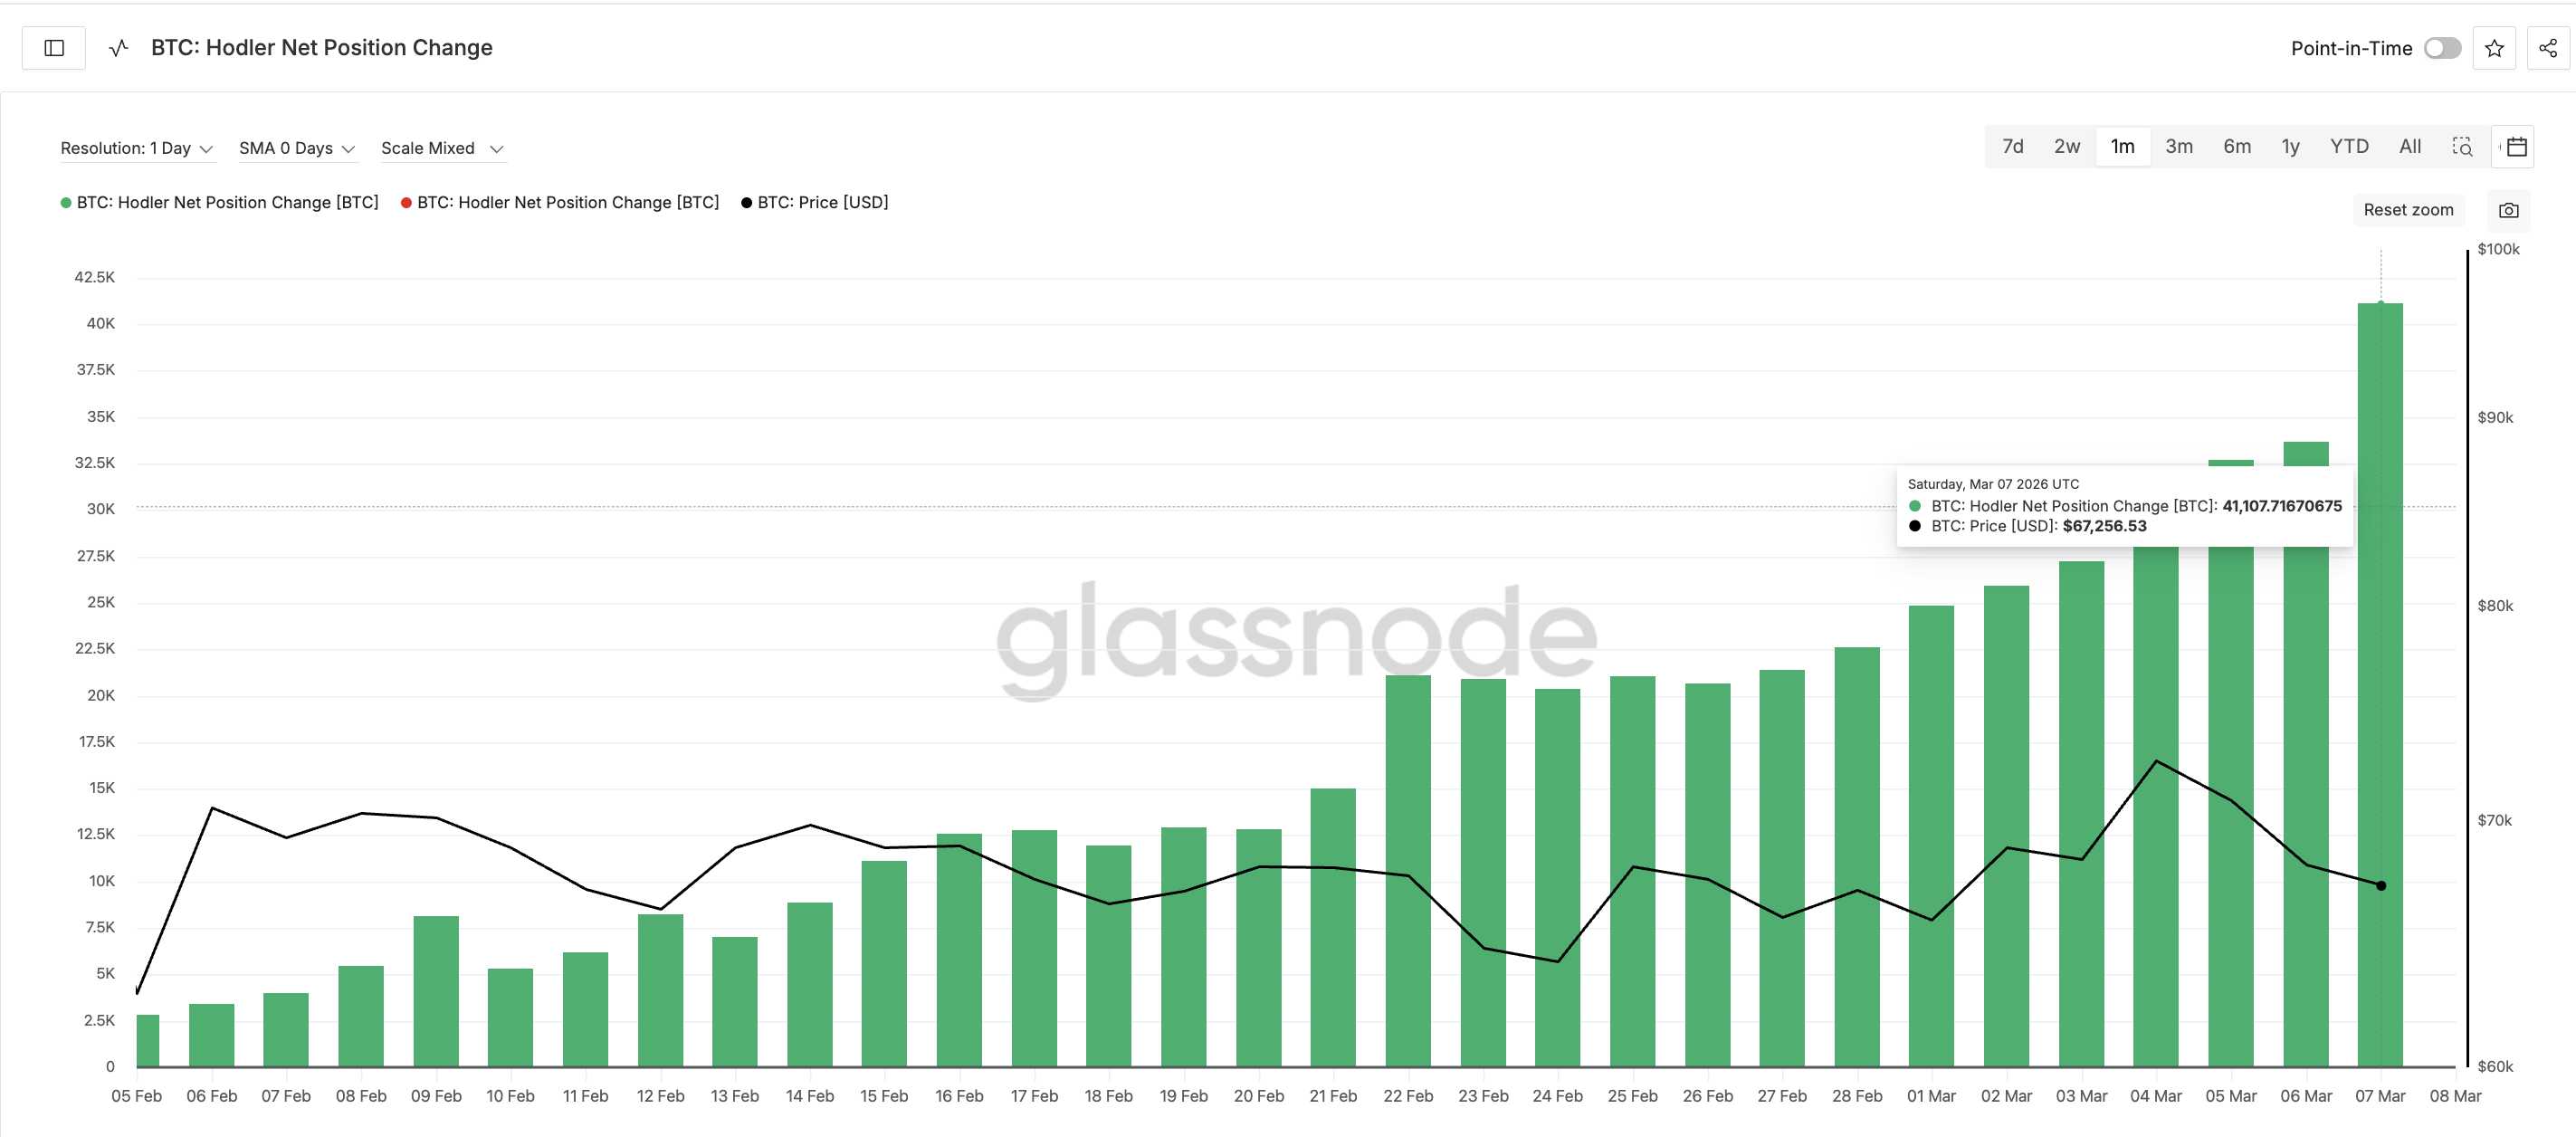
This sharp rise suggests that mid-to-long-term holders have been accumulating during Bitcoin’s consolidation, reinforcing the idea that investors are positioning for a potential breakout or at least a rebound.
Whale behavior also supports this view.
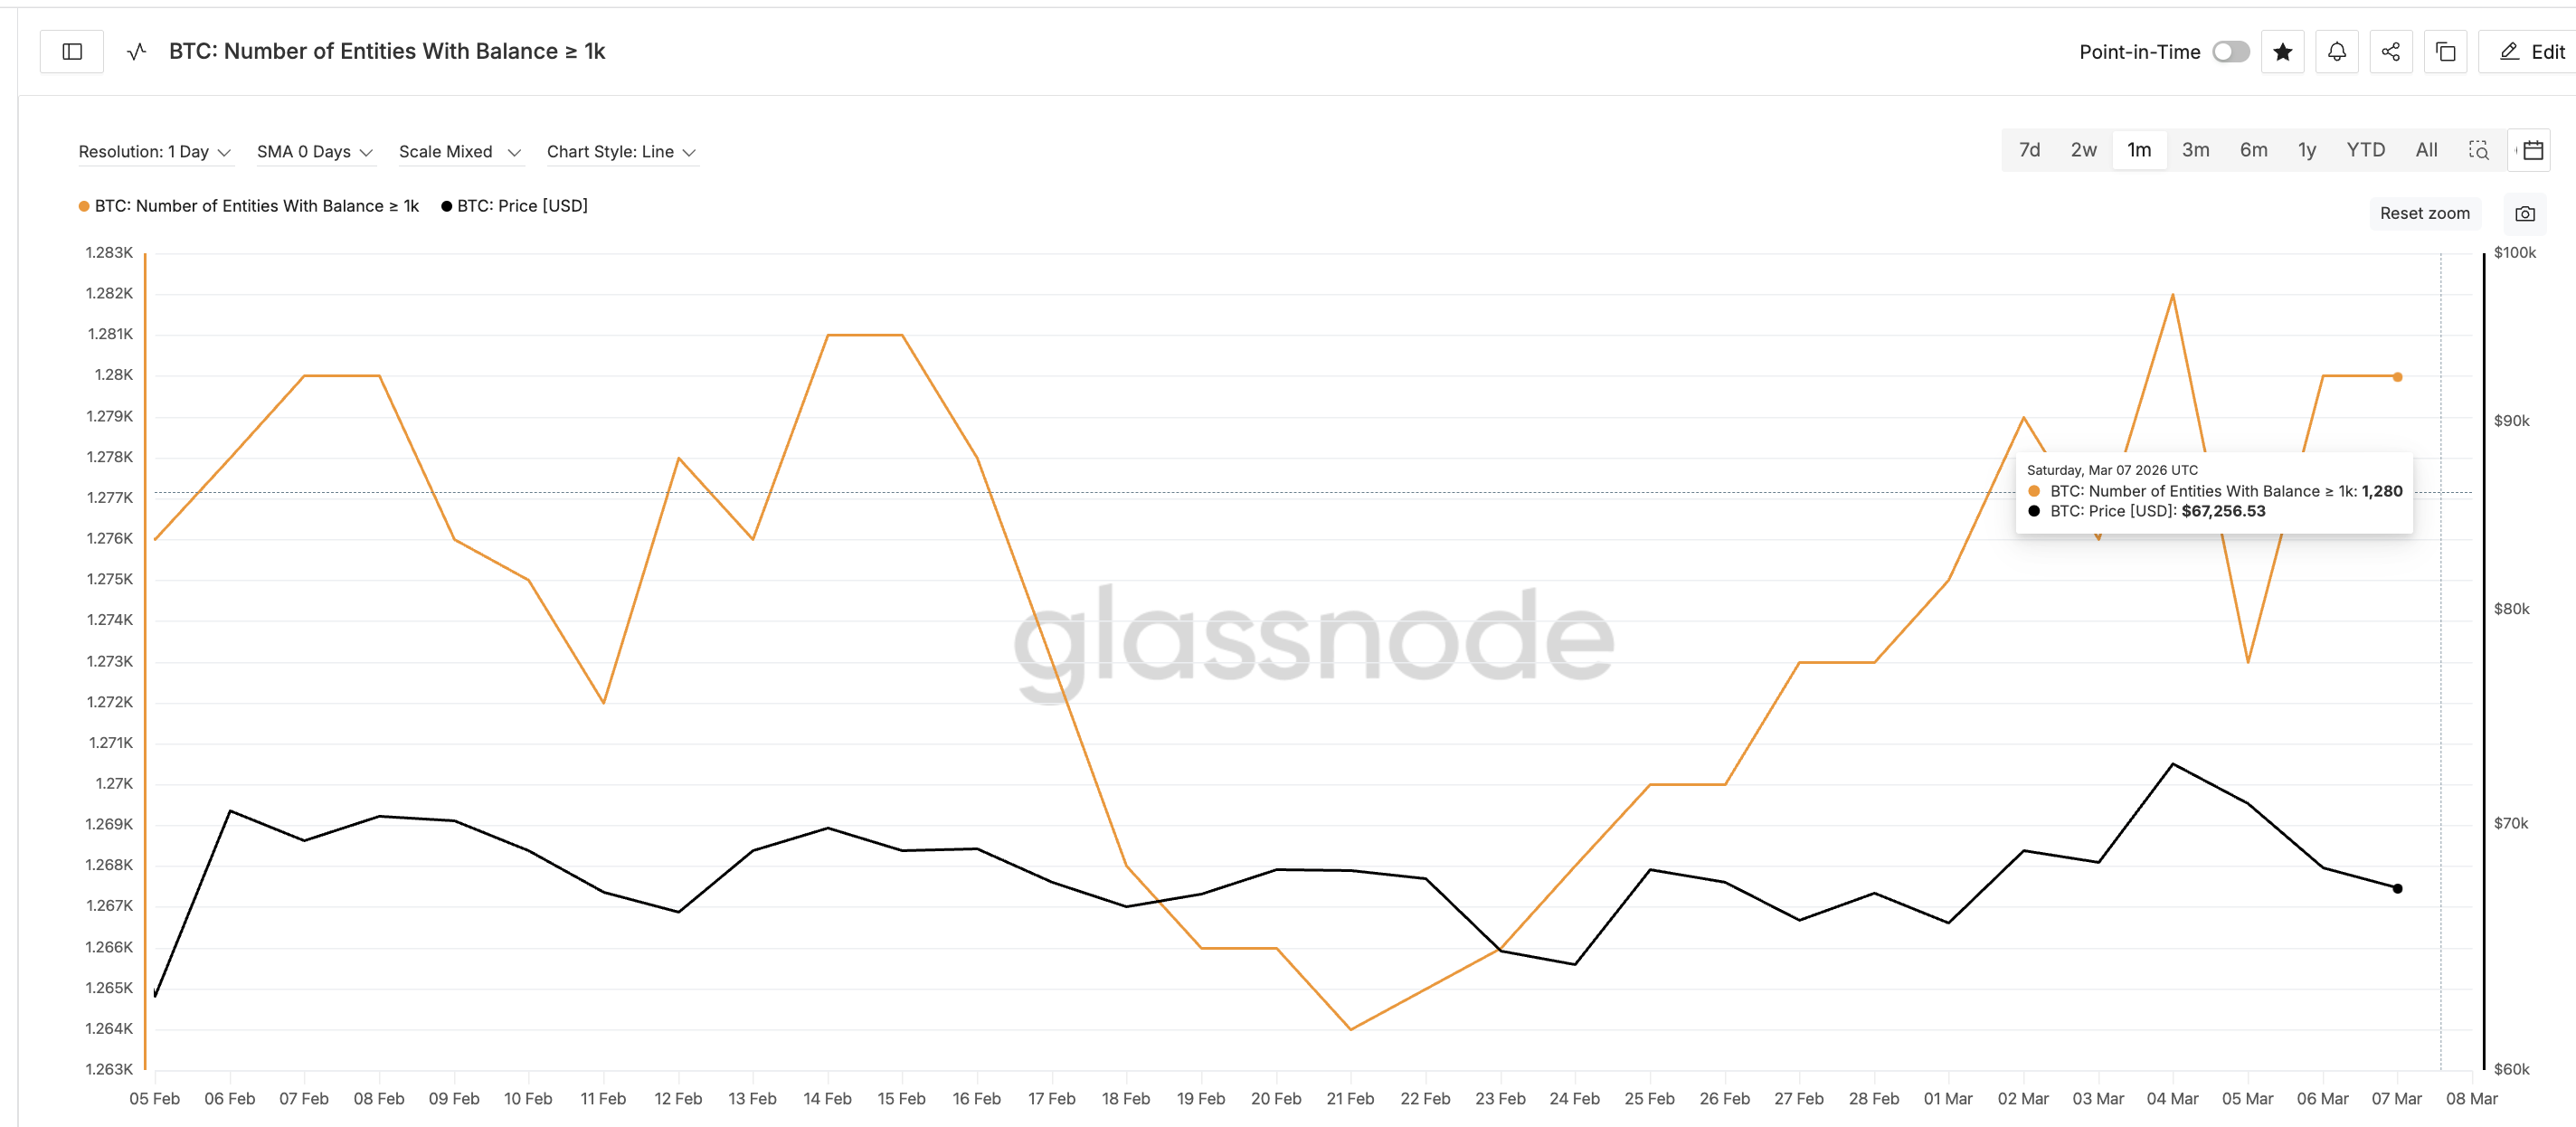
The number of Bitcoin entities holding at least 1,000 BTC has gradually increased since February 21. During that period, the count rose from 1,264 addresses to around 1,280, approaching the highest levels seen, month-on-month.
Despite the short-term pullback between March 4 and March 5 (where the whale address count dipped a bit), the overall trend in whale addresses continued rising.
Taken together, both metrics suggest that larger investors and committed holders are quietly adding exposure, aligning with the bullish chart pattern. However, not every long-term cohort shares the same optimism.
Some Long-Term Bitcoin Holders Are Quietly Reducing Exposure
While whales and mid-term holders are accumulating, another group appears to be moving in the opposite direction.
Data from Bitcoin HODL Waves, which track how long coins have remained dormant, shows that the 3-year to 5-year holder cohort has been declining.
This group held roughly 11.49% of Bitcoin’s circulating supply on February 5. By March 7, that share had fallen to about 10.94%
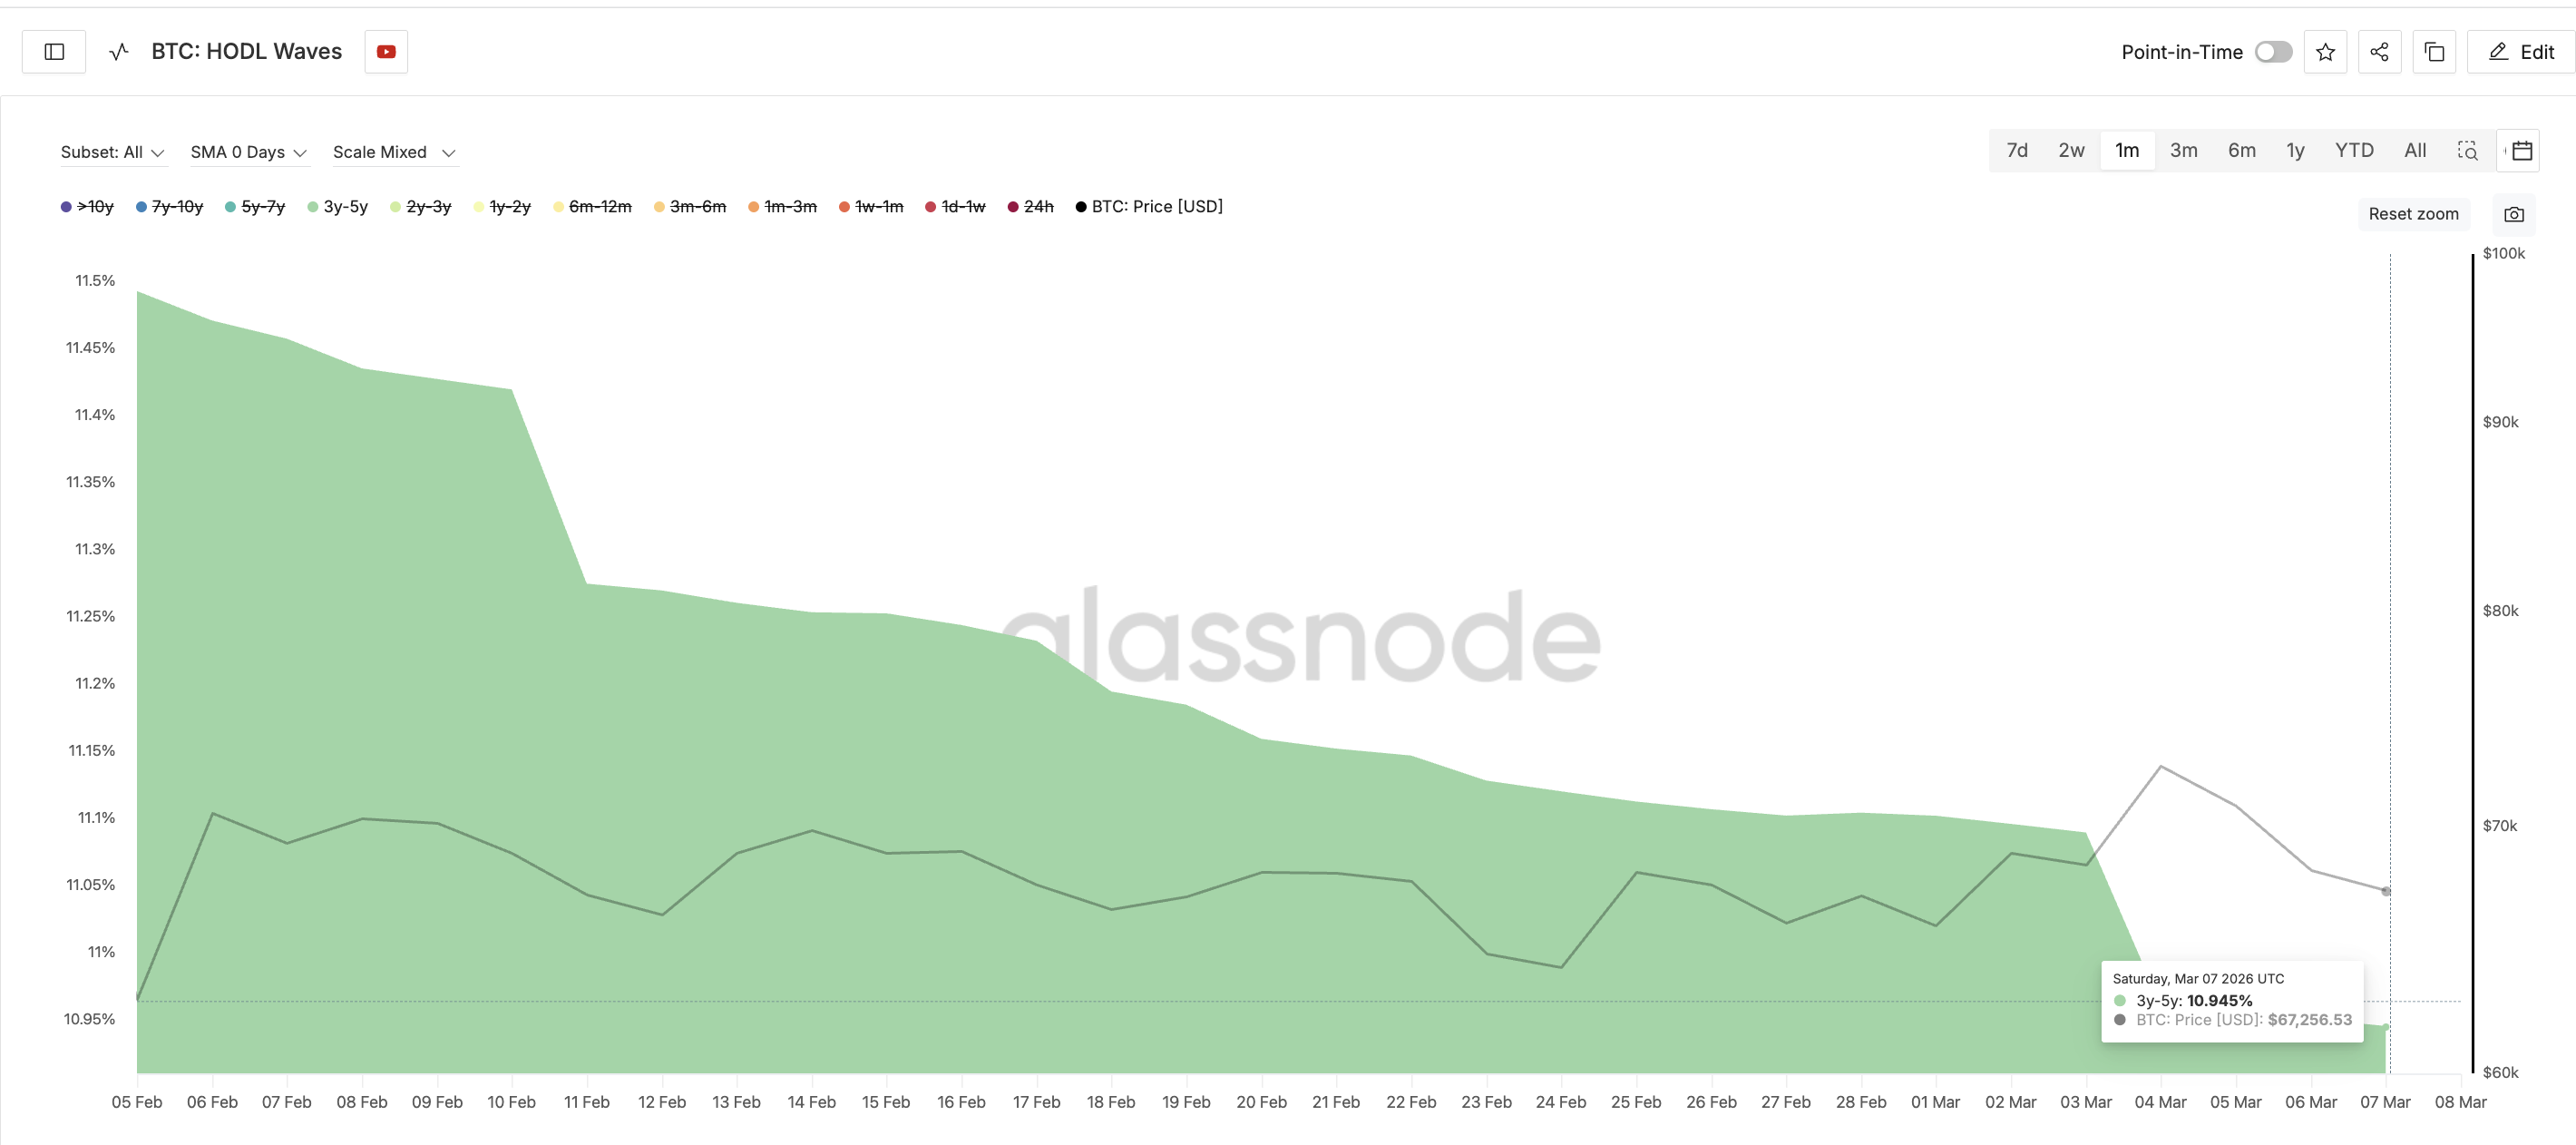
Although the percentage change looks small, it represents a meaningful shift when applied to Bitcoin’s fixed supply. A decline in this cohort indicates that some older coins are re-entering circulation, suggesting that a portion of longer-term holders may be distributing.
This creates an unusual dynamic. While whales and mid-term holders are accumulating, older holders appear less convinced about adding further exposure, introducing a subtle source of supply pressure.
That divergence makes the key support levels highlighted by Wedson even more relevant.
Why the $63,000 Level Could Decide the Next Bitcoin Price Move
A broader Fibonacci retracement analysis from the late-January decline to the March rally also highlights the on-chain levels flagged by Wedson. These levels might not be evident at first glance, as the cup structure leans bullish. These levels become clearer when the broader 33% BTC decline between Jan. 28 and Feb. 6 is considered.
The chart reveals a support zone around $63,300. This closely aligns with the $63,700 level flagged by the Alphractal analysis (courtesy of the dynamic nature of the thresholds).
If those supports fail, the next Fibonacci levels appear near $56,700 (Wedson’s $57,000 level) and $52,000 (Wedson’s $52,400 zone), matching the downside zones highlighted in the expert’s warning.
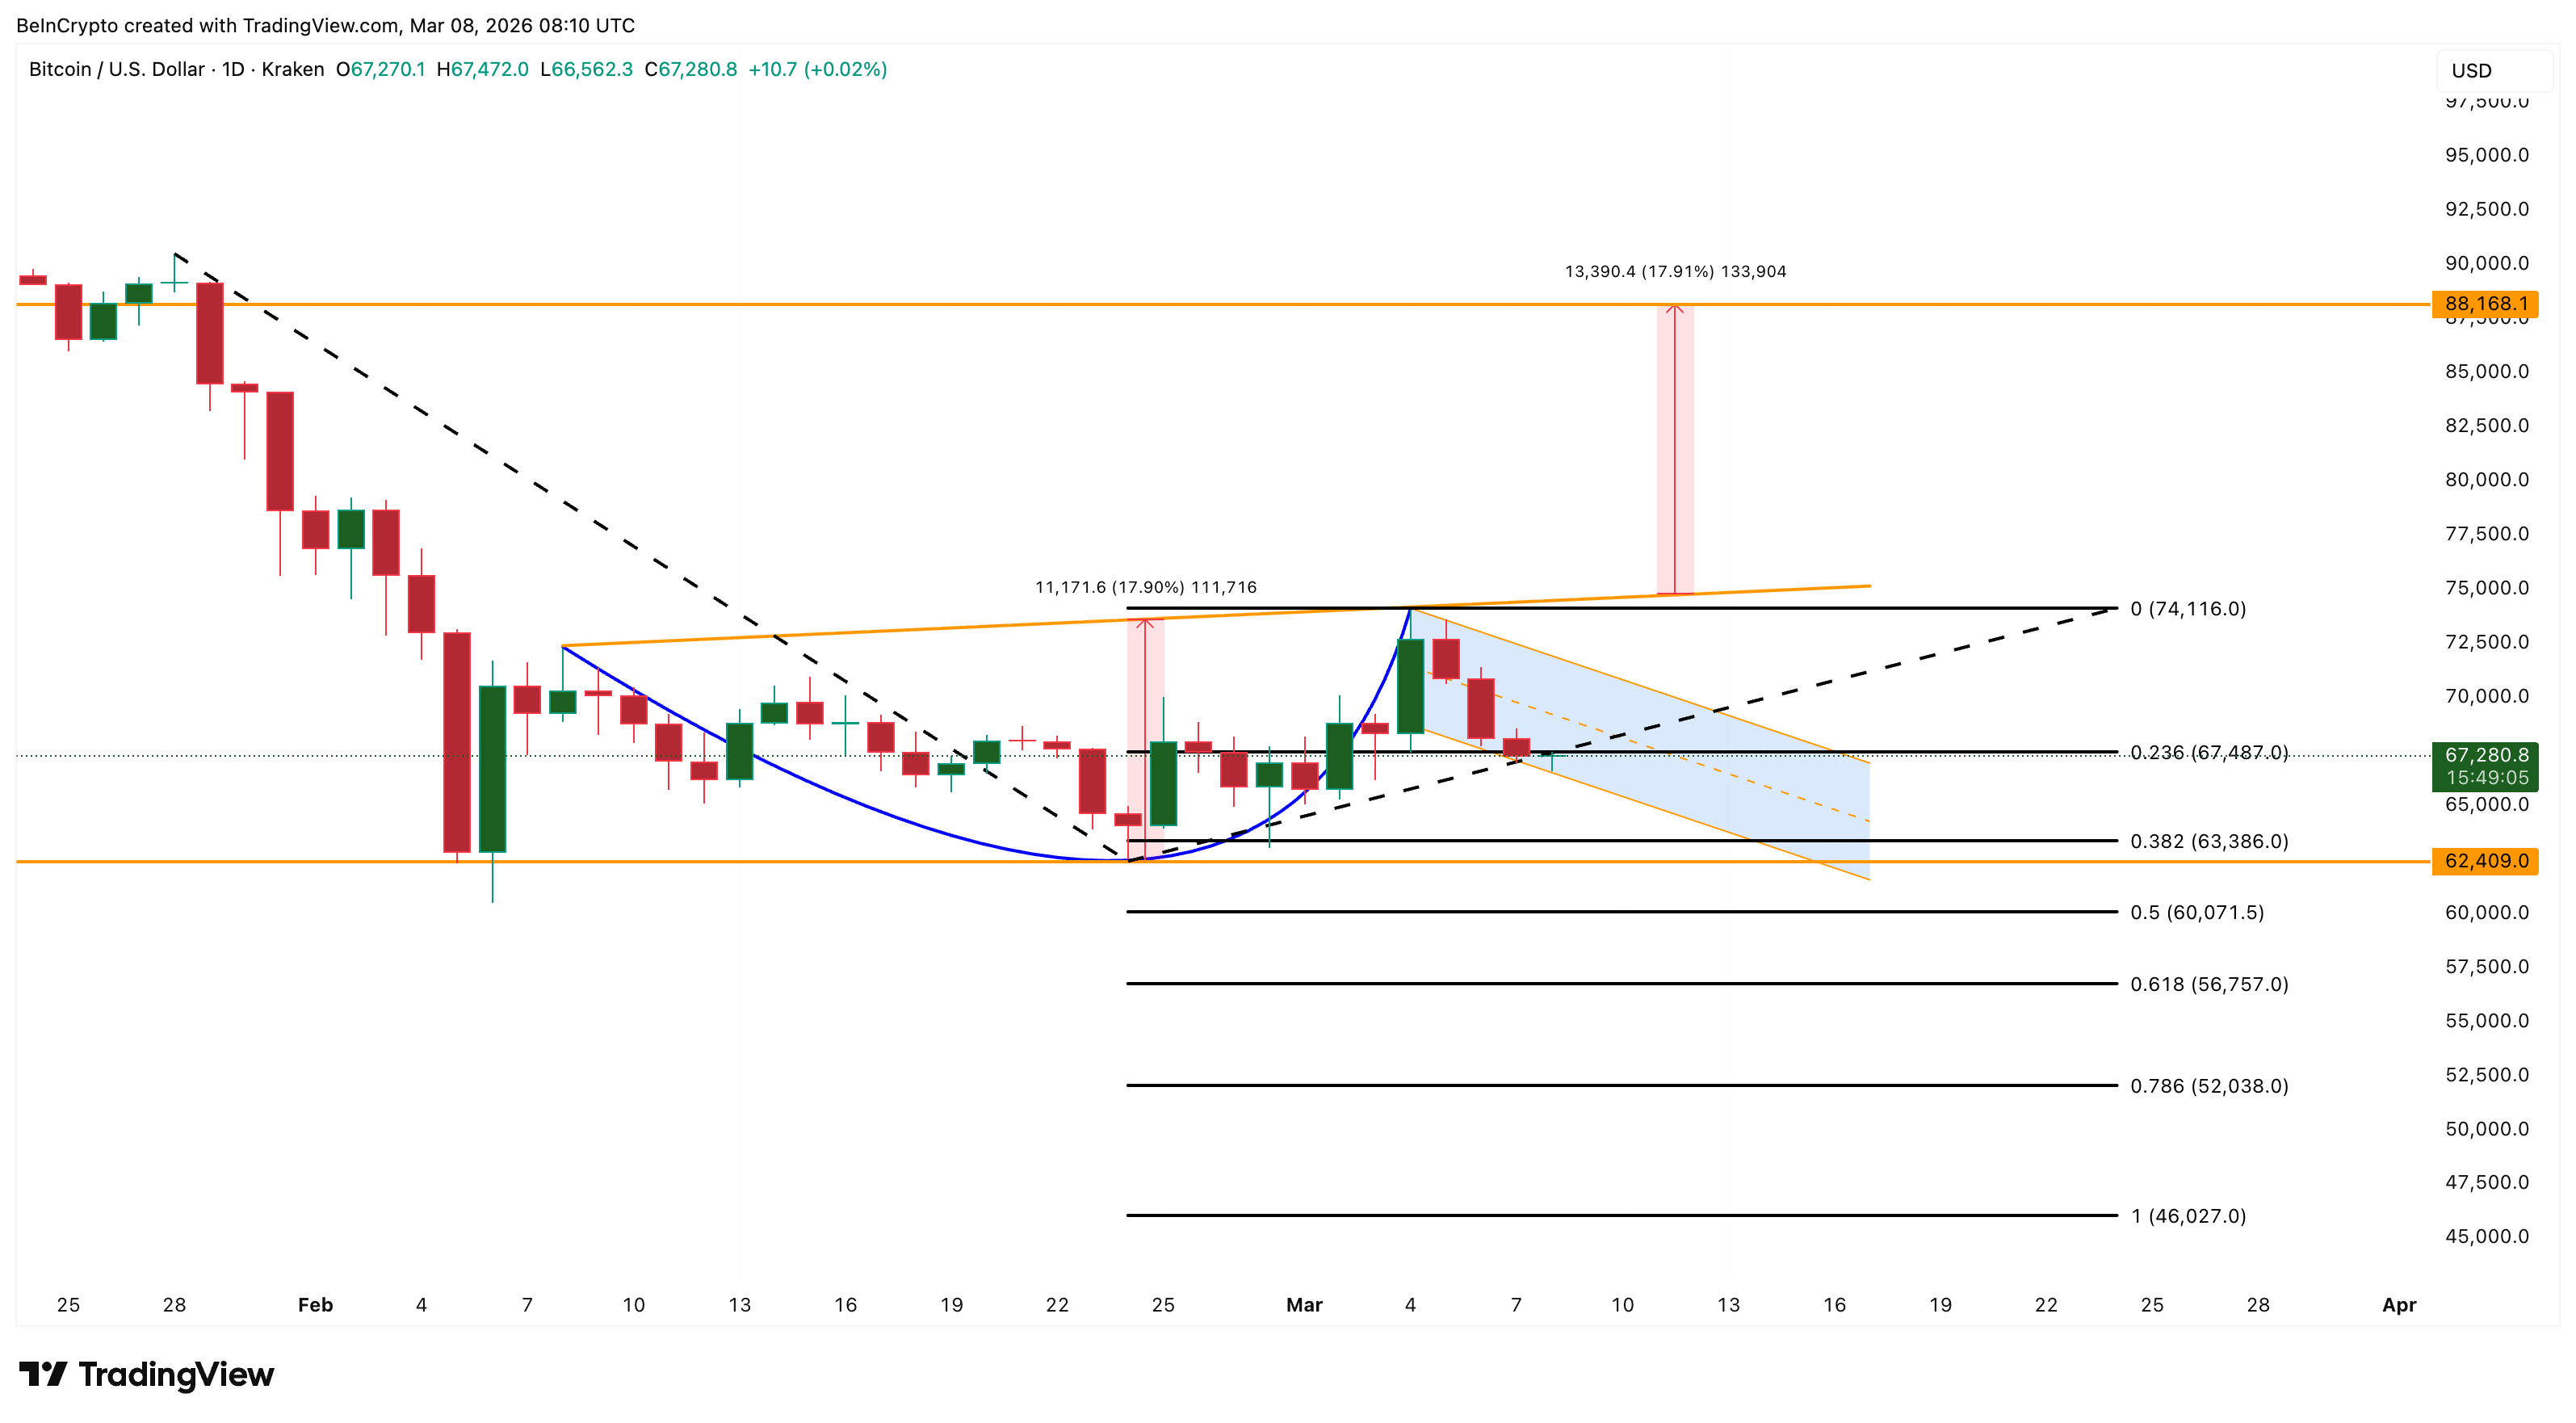
In other words, both the on-chain analysis and the broader technical structure converge around the same critical region. For Bitcoin to regain strong bullish momentum, the market would need to reclaim the neckline near $74,100. That move could confirm the cup-and-handle breakout and push the Bitcoin price toward the $88,100 target.
Until then, the Bitcoin price remains caught between accumulating whales, cautious long-term holders, and a weak support zone.
Whether the $63,000 support zone holds or breaks may determine whether the next move is a rally toward new highs—or a deeper correction first.
* The content presented above, whether from a third party or not, is considered as general advice only. This article should not be construed as containing investment advice, investment recommendations, an offer of or solicitation for any transactions in financial instruments.


