


NVIDIA Price Rebounds Ahead of GPU Technology Conference With $225 in Sight
The NVIDIA price is attempting to rebuild momentum after a sharp early-March drop temporarily disrupted the stock’s breakout structure. The chipmaker fell from its post-earnings high near $197 to an intraday low around $174 on March 2 as broader market volatility and geopolitical tensions triggered a pullback across technology stocks.
Since then, buyers have stepped back in. NVIDIA rebounded to an intraday high near $184 on March 4 and closed at $183, with pre-market trading hovering near $182–$183 on March 5. The recovery places the NVIDIA shares back near several important technical triggers that could reopen the path toward $225. However, institutional participation still needs strengthening before the bounce can fully regain traction.
NVIDIA Stabilizes Above Key Institutional Price Level
The rebound from $174 has allowed Nvidia to reclaim an important institutional benchmark: the monthly volume-weighted average price (VWAP).
The VWAP represents the average price investors paid during a given period, adjusted for trading volume. Because large funds often execute trades around this level, reclaiming it can indicate that institutional positioning is stabilizing after a sell-off.
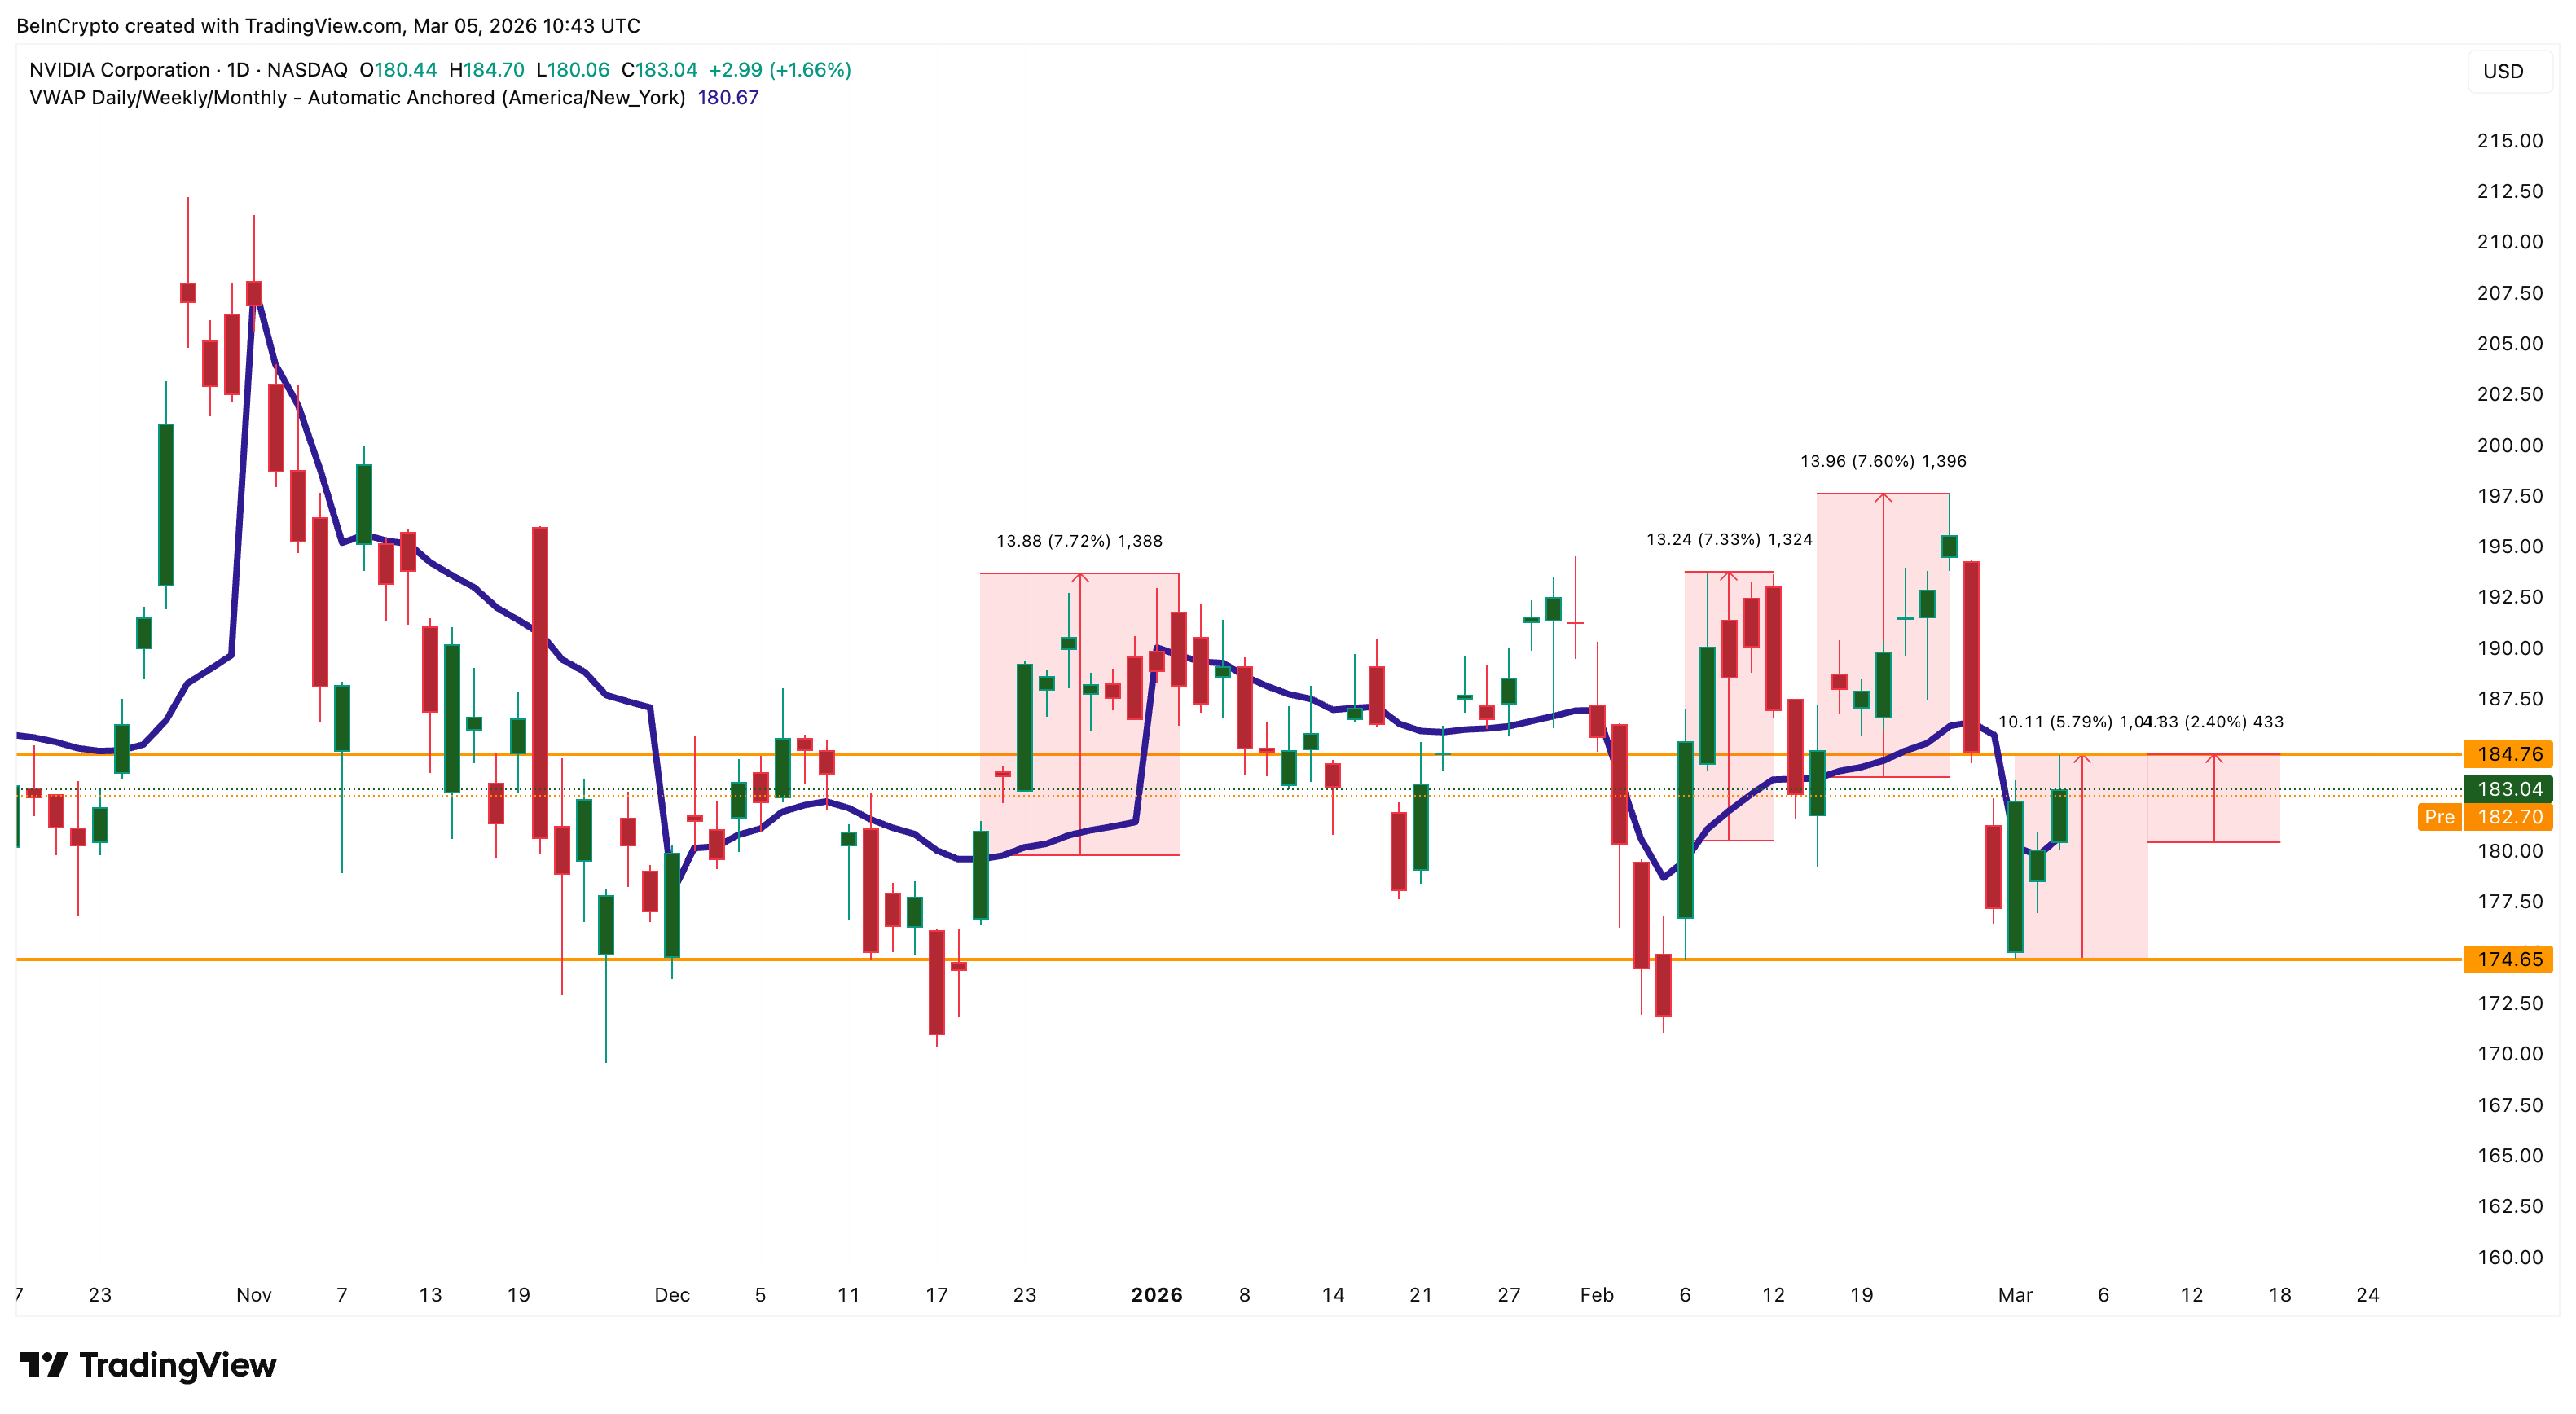
NVIDIA’s price has moved back above the monthly VWAP, suggesting that buyers have regained short-term control of the trend. Historically, similar recoveries above this level have produced follow-through rallies of roughly 7% to 8% within weeks.
 NVIDIA Reclaims VWAP: TradingView
After reclaiming the VWAP, NVDA has only risen about 2% so far. This shows that the VWAP push might just have some more legroom.
The timing is also notable. The rebound comes just days before Nvidia’s annual GPU Technology Conference (GTC), scheduled for March 16–19. The event is widely viewed as one of the most important gatherings in the artificial-intelligence industry, where the company typically outlines updates on its AI ecosystem and hardware roadmap.
Investors will particularly watch for developments around Nvidia’s Blackwell architecture, the company’s newest generation of AI chips designed to power large-scale data-center workloads. If the current recovery continues, the next technical trigger lies just overhead.
50-Day Moving Average Could Trigger Nvidia’s Next Rally Phase
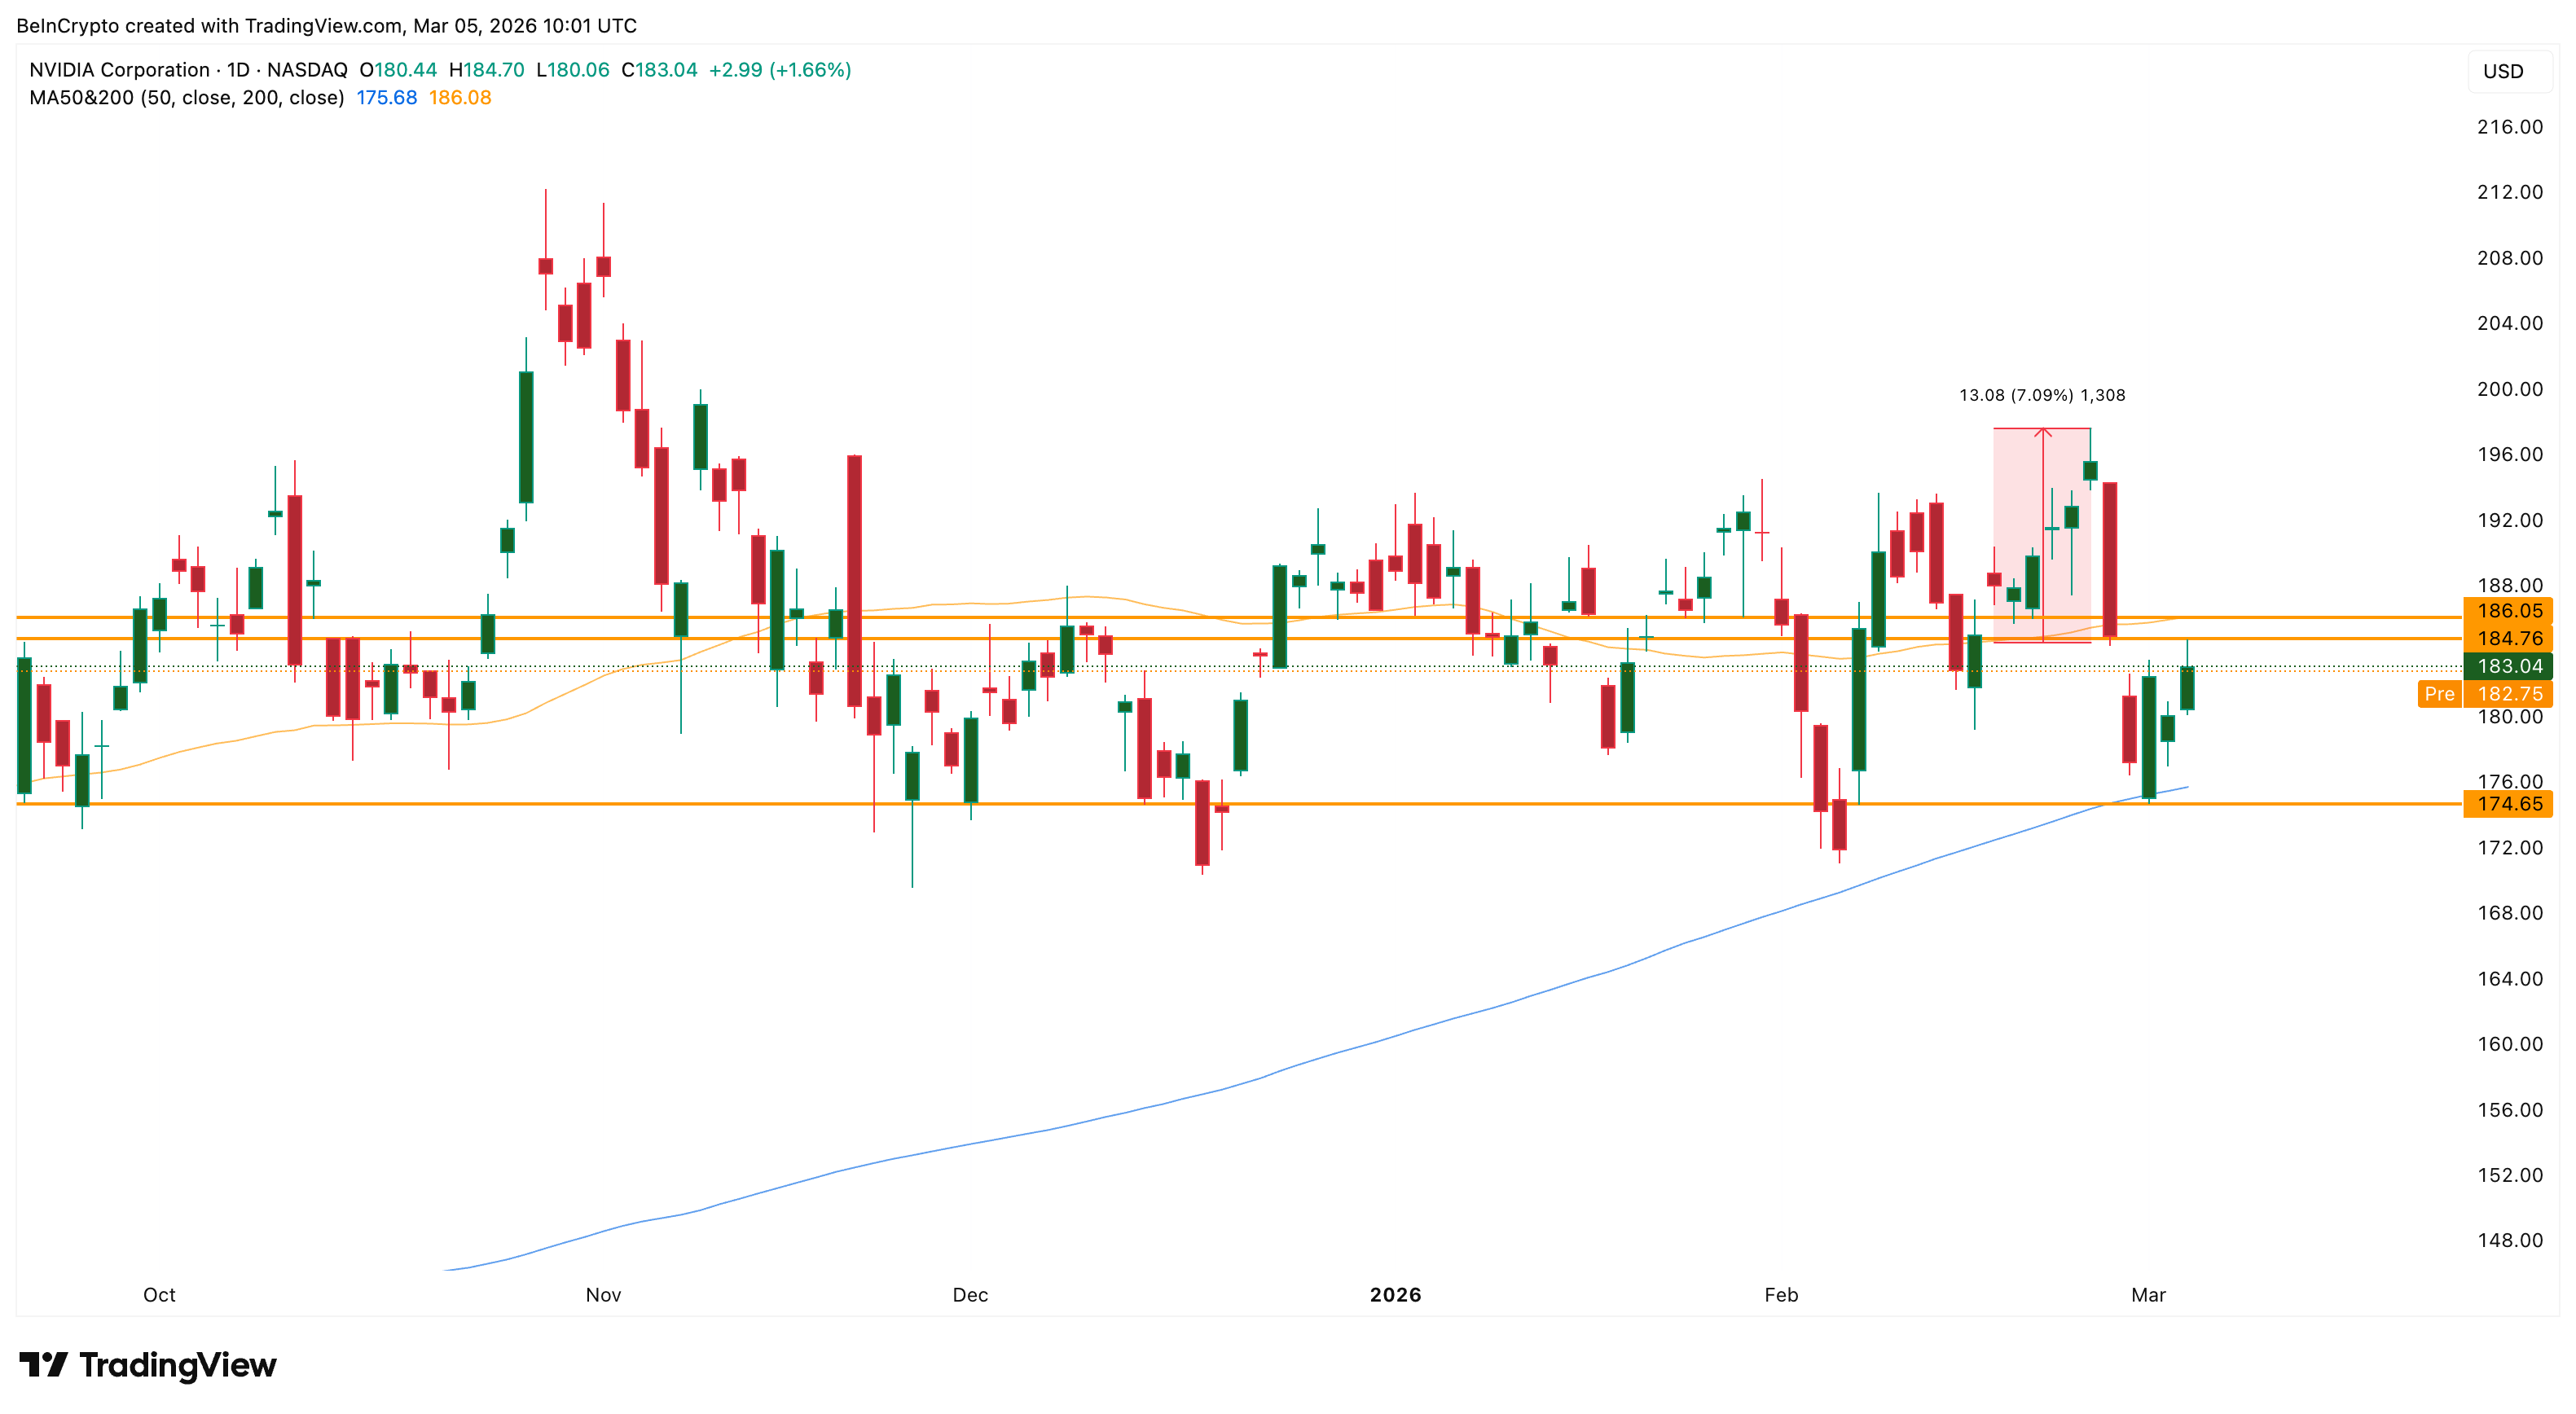
The 50-day moving average currently sits near $186, placing Nvidia below a key short-term trend signal by less than 2%.
A clean close above this level would confirm that the recent rebound has regained momentum. The same level triggered a similar move in mid-February, when Nvidia broke above the moving average and quickly rallied toward the post-result high with a 7% upswing.
 Moving Average Reclaim: TradingView
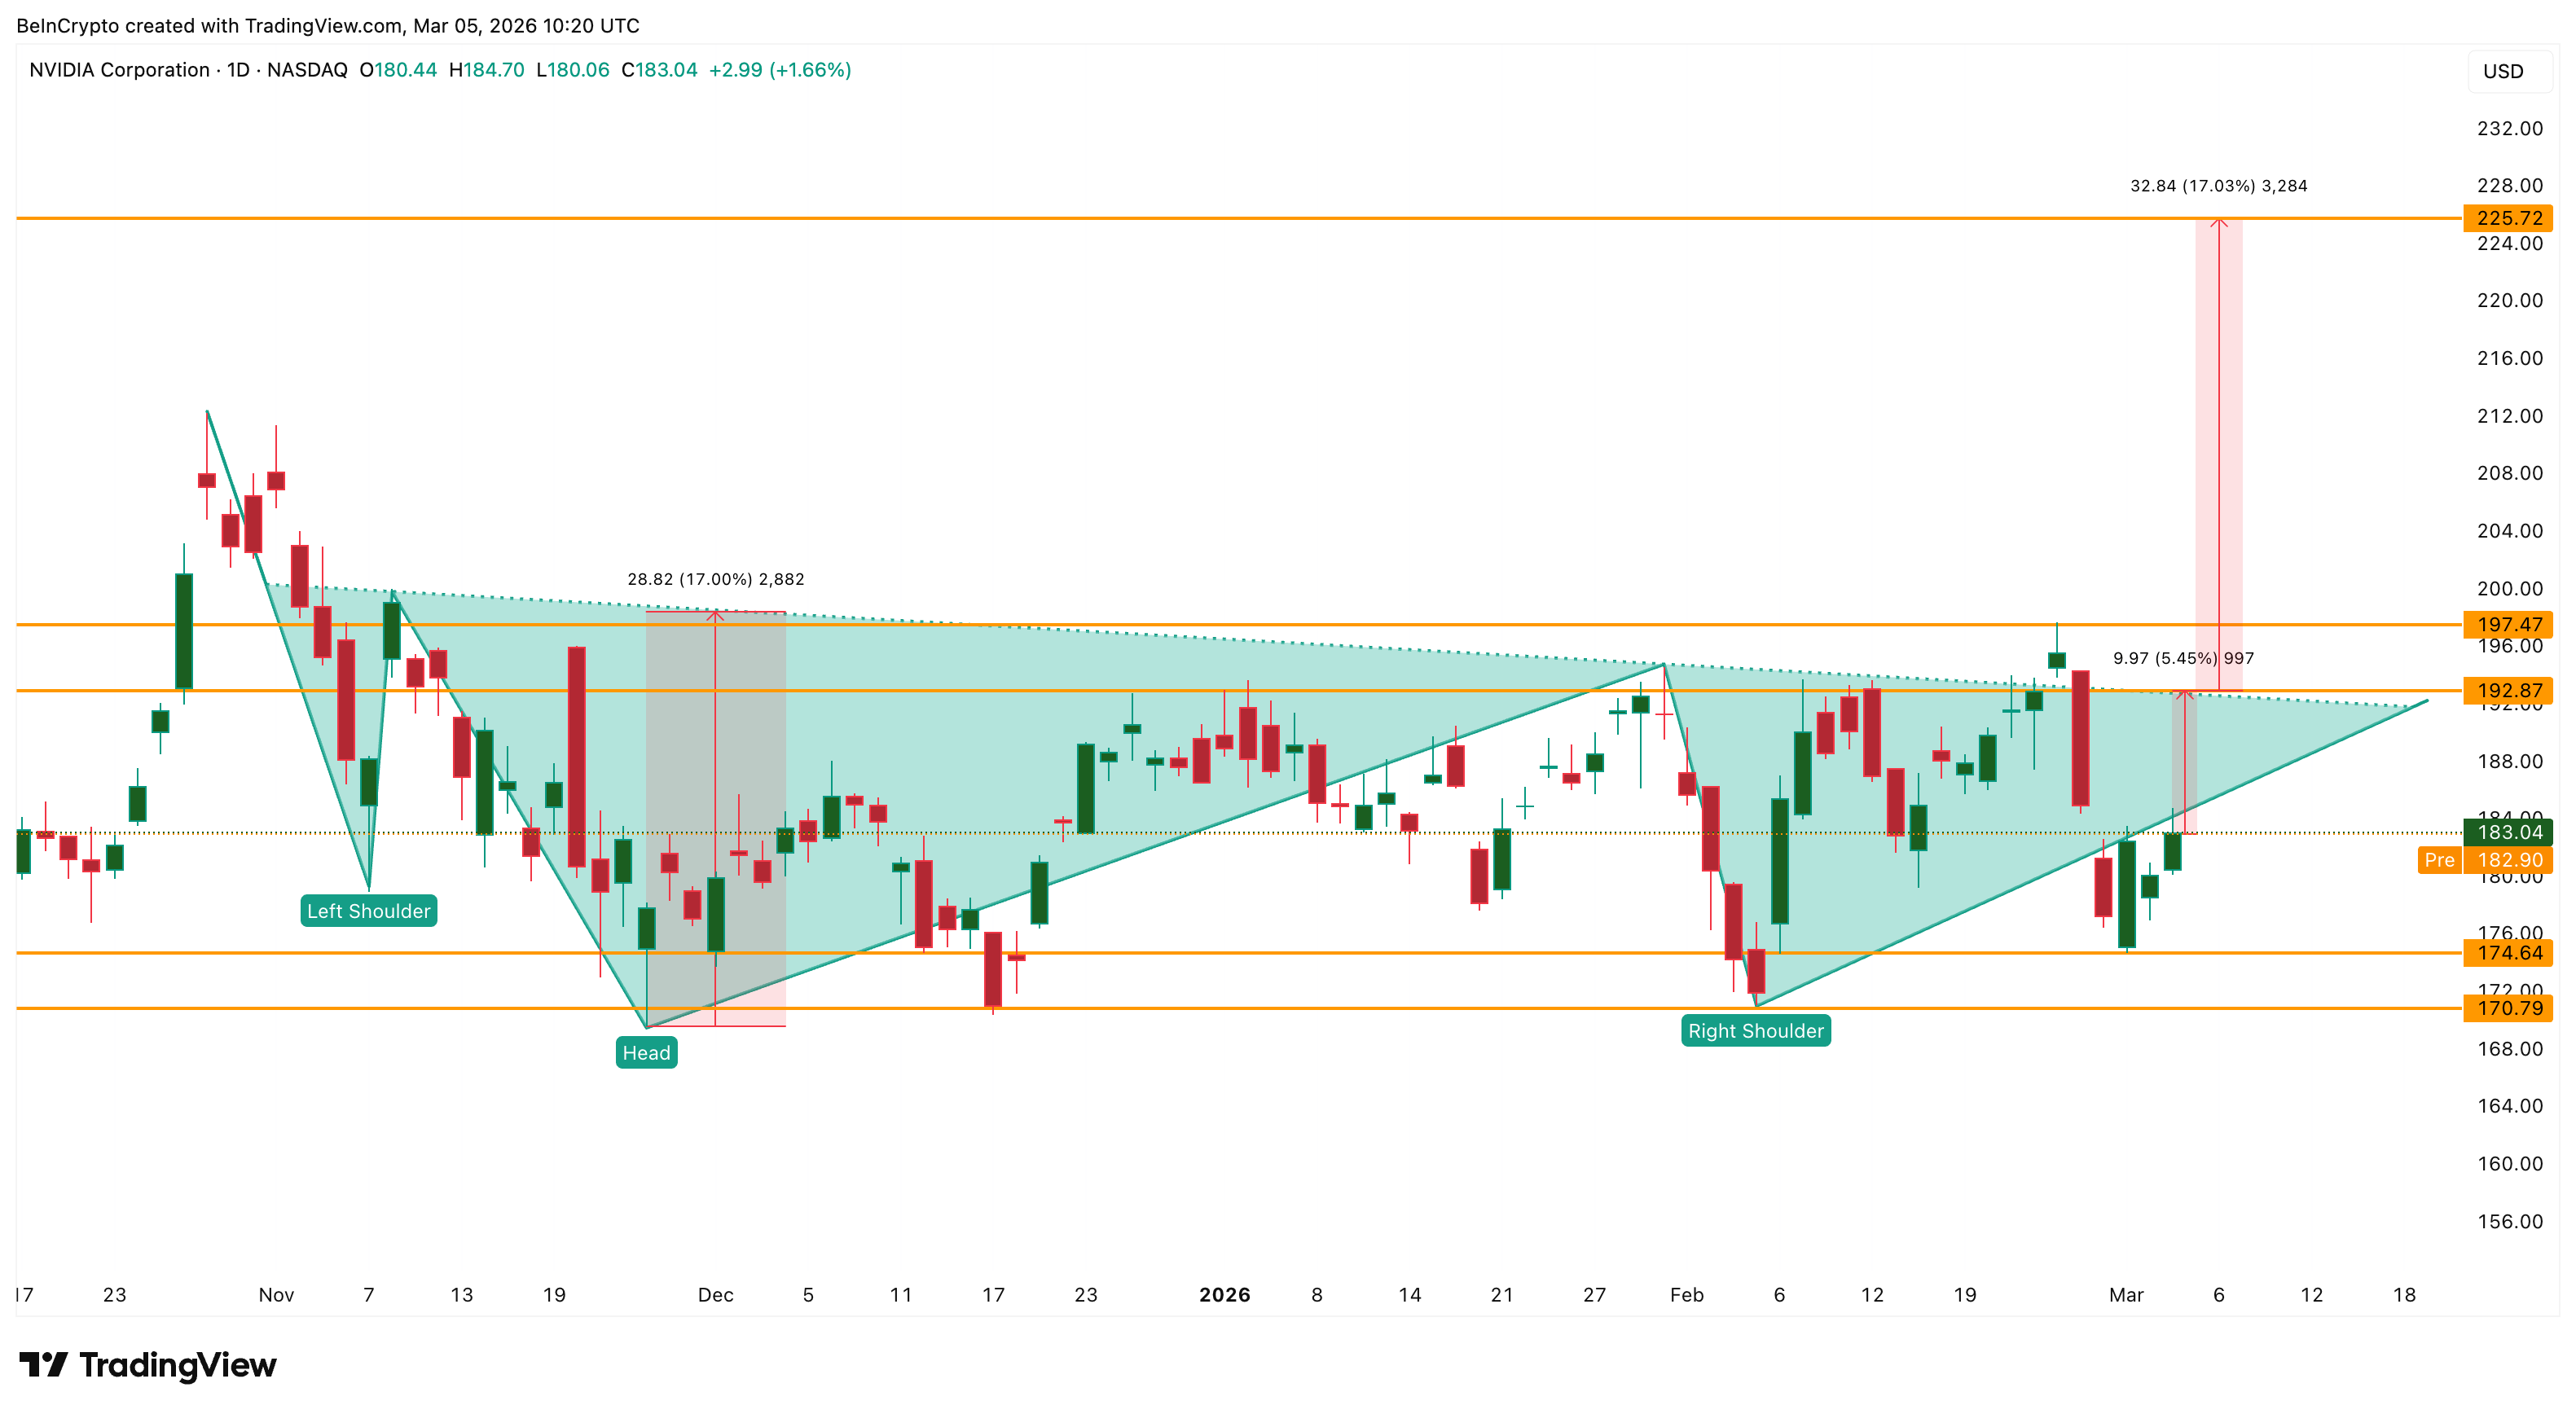
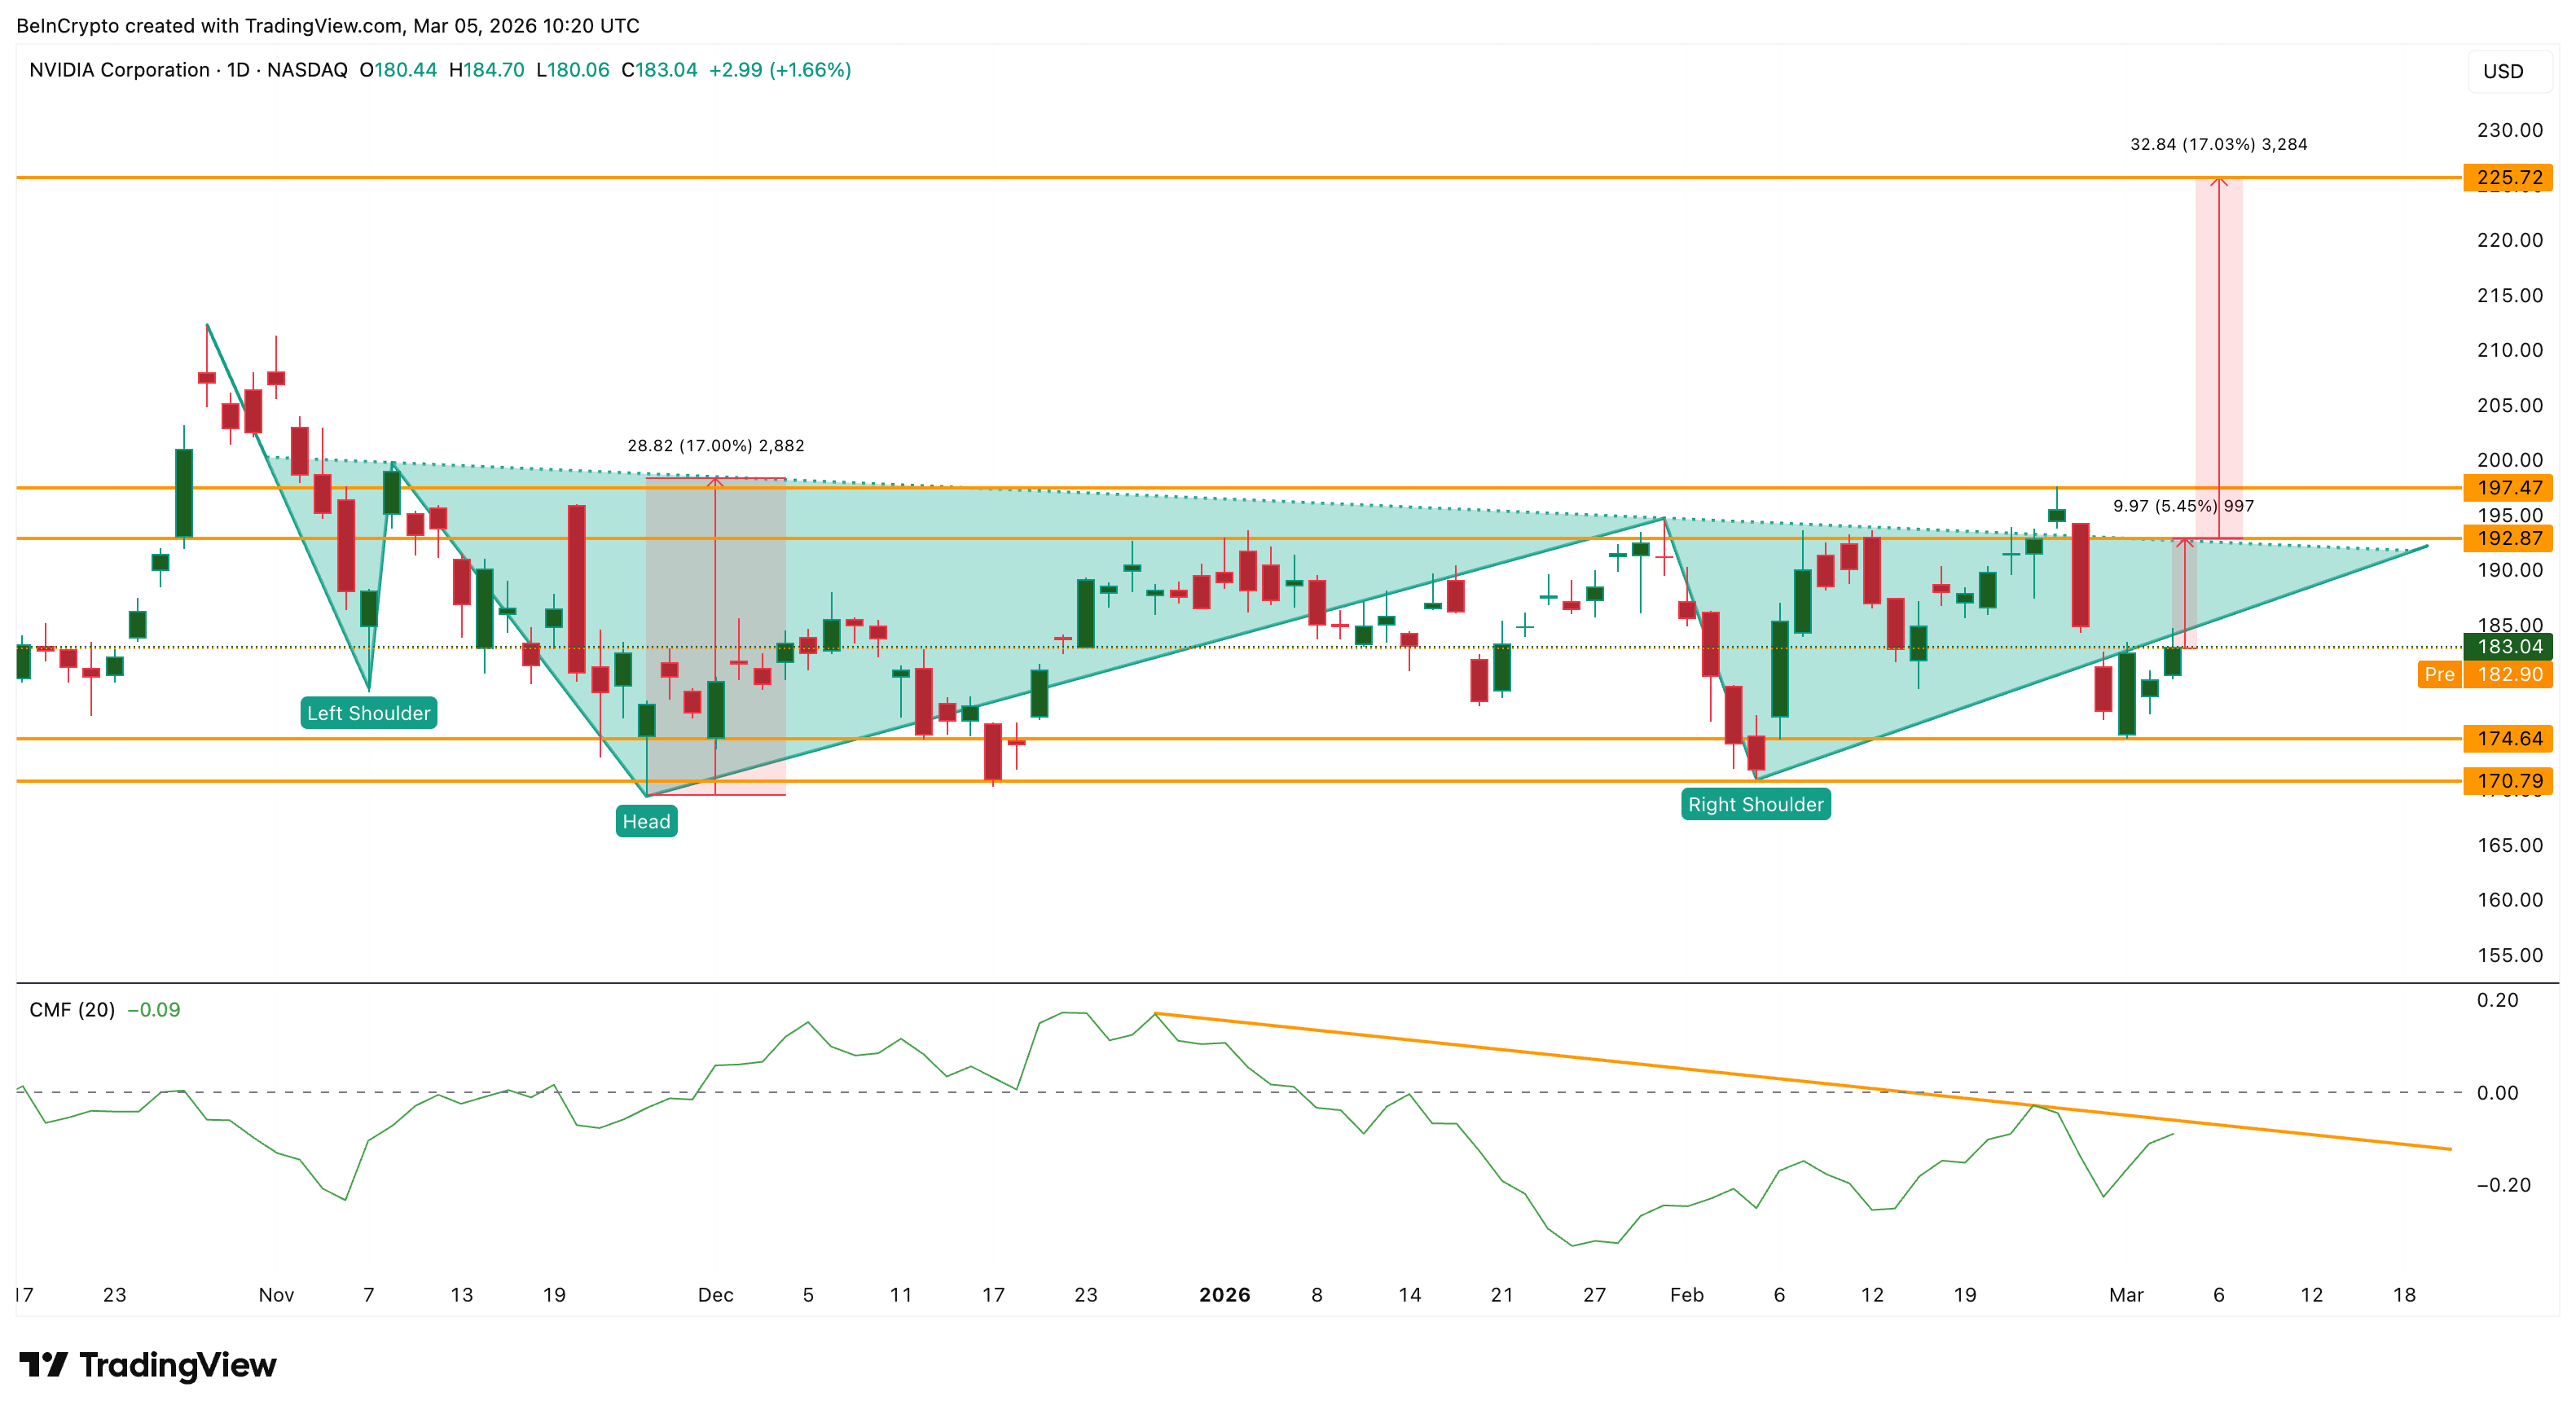
Although the rally eventually stalled following the company’s earnings release, the current setup shows a comparable structure forming again. A move above the moving average could attract momentum buyers and push the price toward the next resistance cluster near $192, which also aligns with the neckline of the inverse head-and-shoulders structure.
 Stock Pattern: TradingView
Yes, the NVIDIA price still managed to hold this bullish market structure despite dipping to $174 on March 2. Now that the bounce has resumed, the neckline at $192 becomes a key factor again. That is why the moving average move expectation is critical — to help the stock breach the neckline.
Institutional Momentum Still Needs Confirmation
While Nvidia’s price has already reclaimed the volume-weighted average price (VWAP), institutional momentum has not fully confirmed the move.
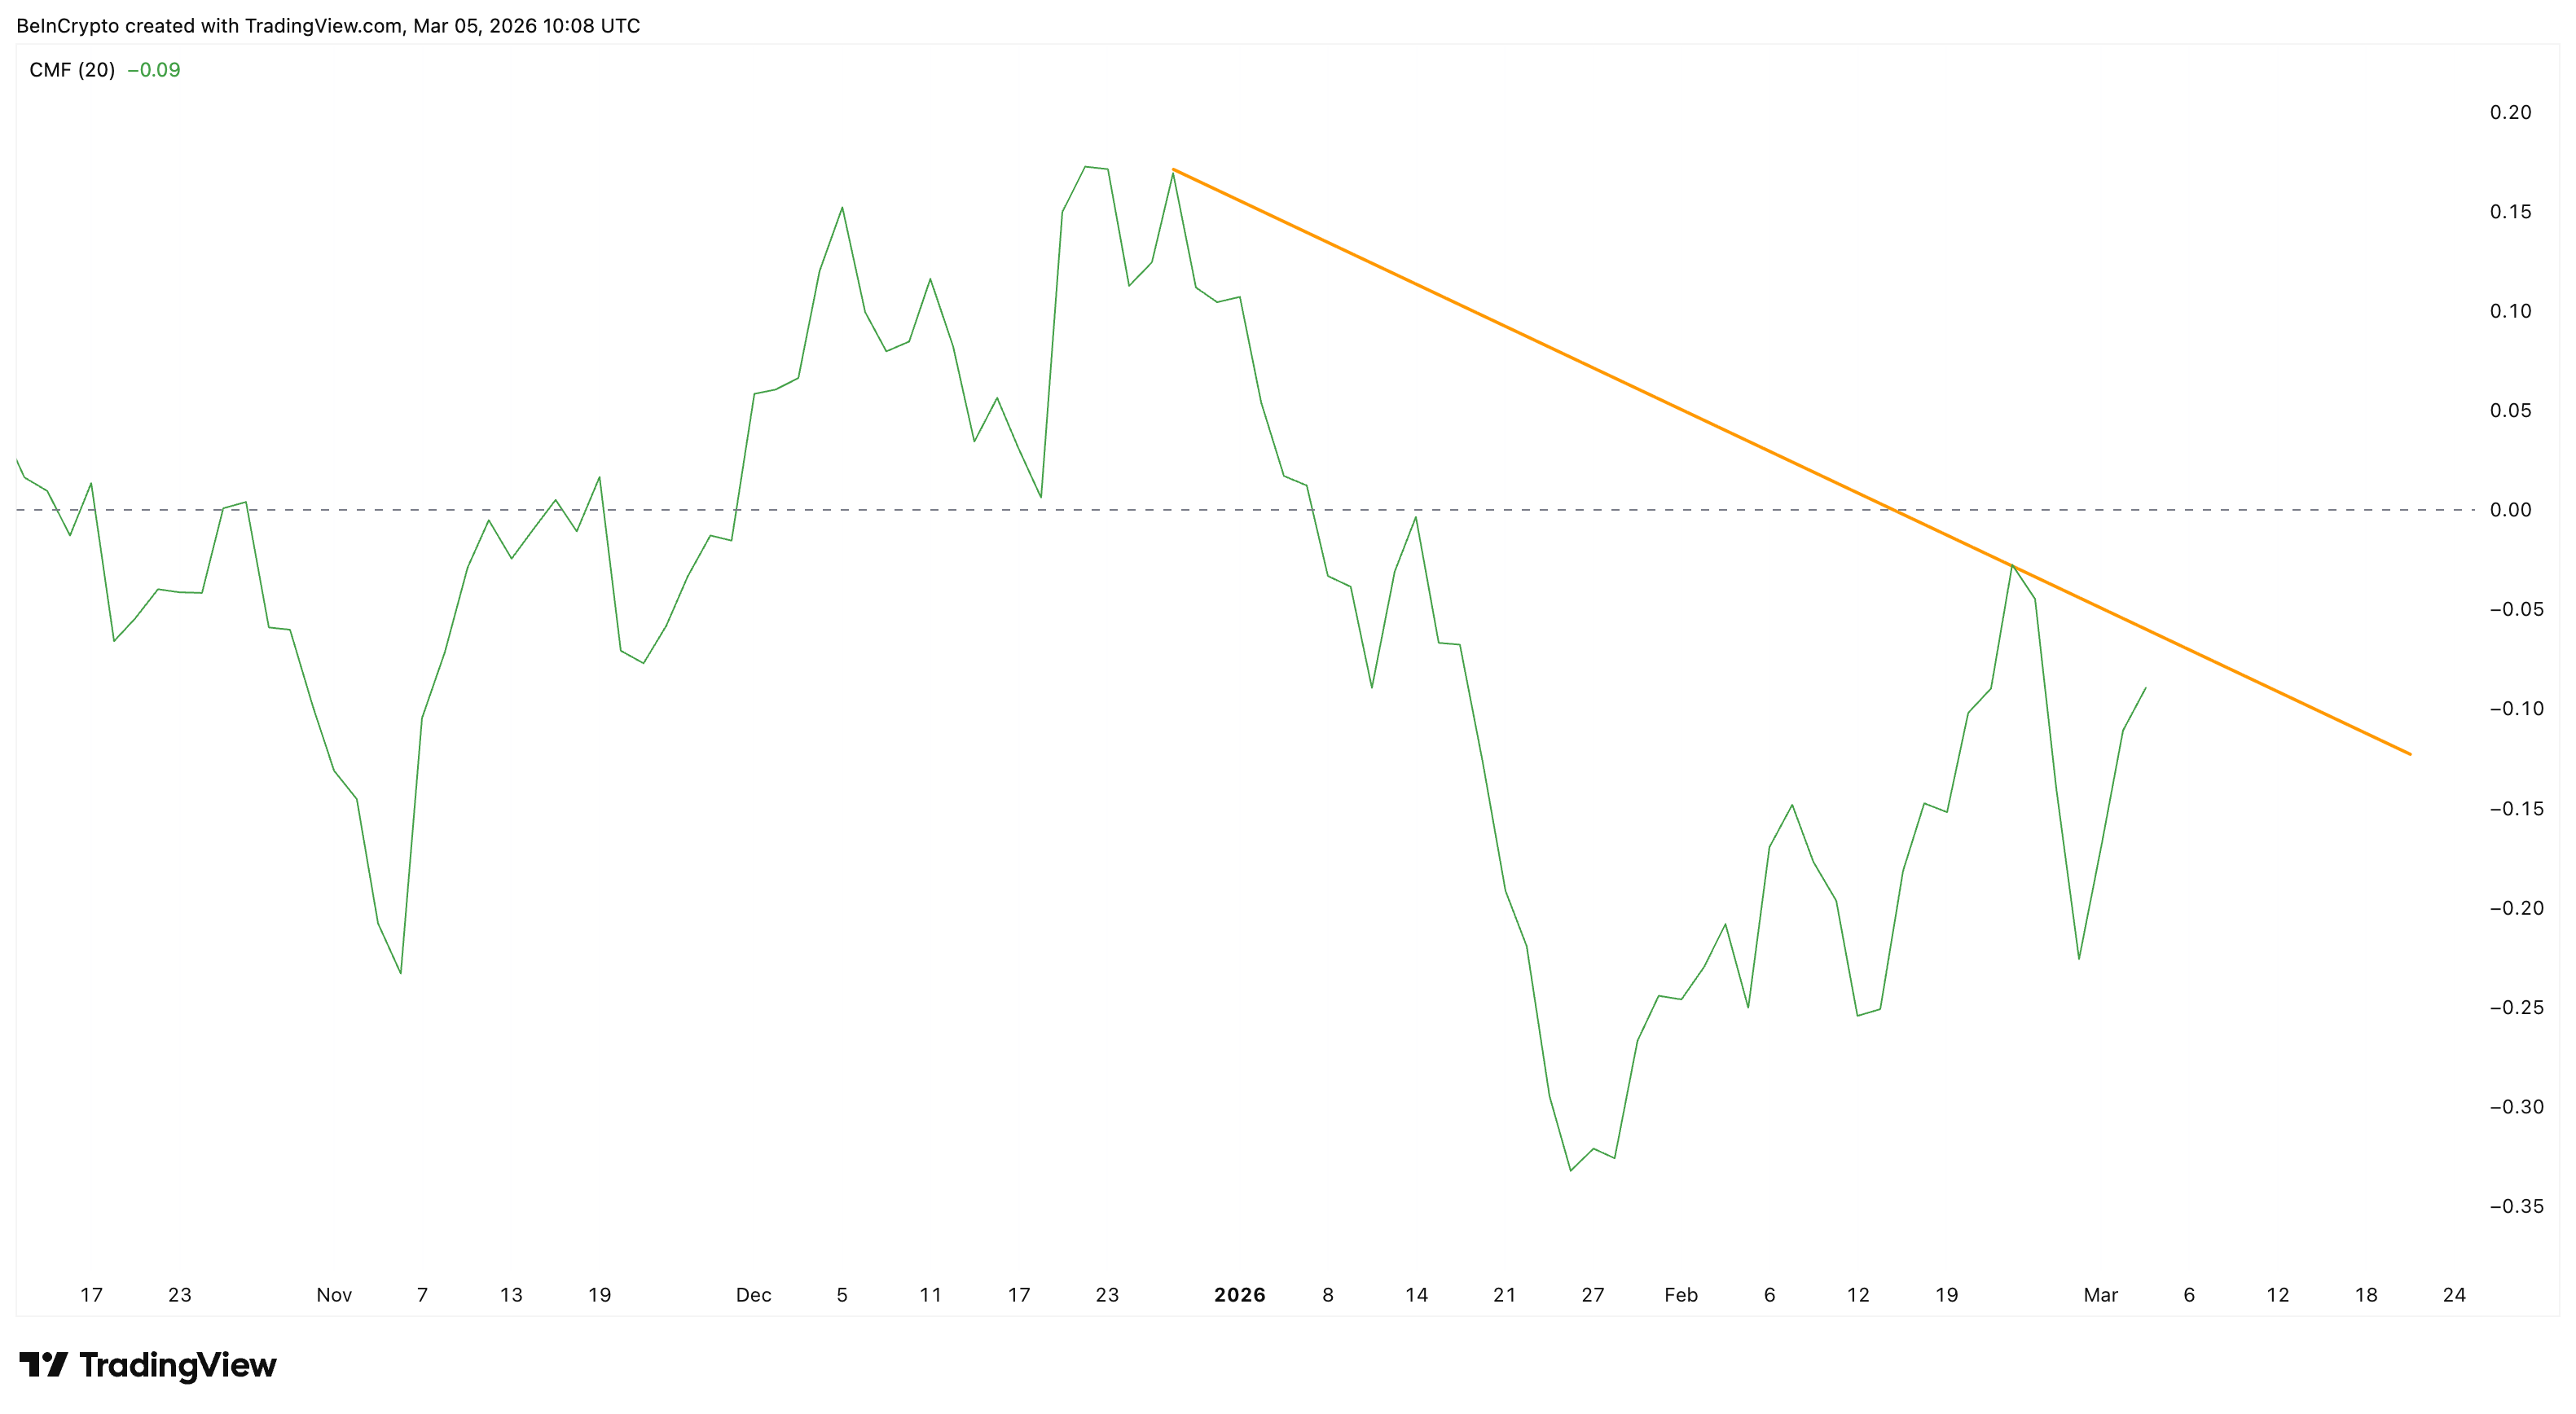
The Chaikin Money Flow (CMF), a momentum indicator that tracks capital entering or leaving an asset based on price and volume, remains below the neutral zero line. It also continues to trade beneath a descending trendline connecting the highs formed since late December.
This creates an important divergence, but not on the current chart, but between two indicators. Price has already recovered above the VWAP (from earlier), indicating that the average traded price of institutional activity is rising, but the CMF suggests that the intensity of those inflows has not yet strengthened.
 CMF Movement: TradingView
In other words, price has stabilized, but momentum from large investors still needs to improve. A similar pattern appeared during Nvidia’s previous attempt to break above $197 in late February. While the result-driven buzz helped the NVDA price push past the pattern neckline, confirming a breakout, weak institutional flows spoiled the rally.
 NVIDIA Price Structure: TradingView
The rally stalled as the CMF remained below the zero level (and also the trendline), showing that institutional flows were not strong enough to sustain the move.
For the current recovery to gain traction, the CMF would need to break above both its descending trendline and the zero level. That move would signal that institutional demand is strengthening alongside the improving price structure.
NVIDIA Price Target of $225 Surfaces, But Key Resistances Need to Break
If buying pressure continues to build, Nvidia’s next challenge will be clearing resistance near $192, the neckline. This level is roughly 5.4% above the current price. A breakout above it would likely bring the previous results-driven peak near $197 back into focus.
Beyond that point, the path toward higher targets opens quickly.
A sustained move above $197 could push Nvidia toward $211 and eventually toward the $225 region, a level that aligns with the projected move from the broader pattern. In a stronger rally scenario, the Nvidia stock price could even approach $236, representing the next major upside extension.
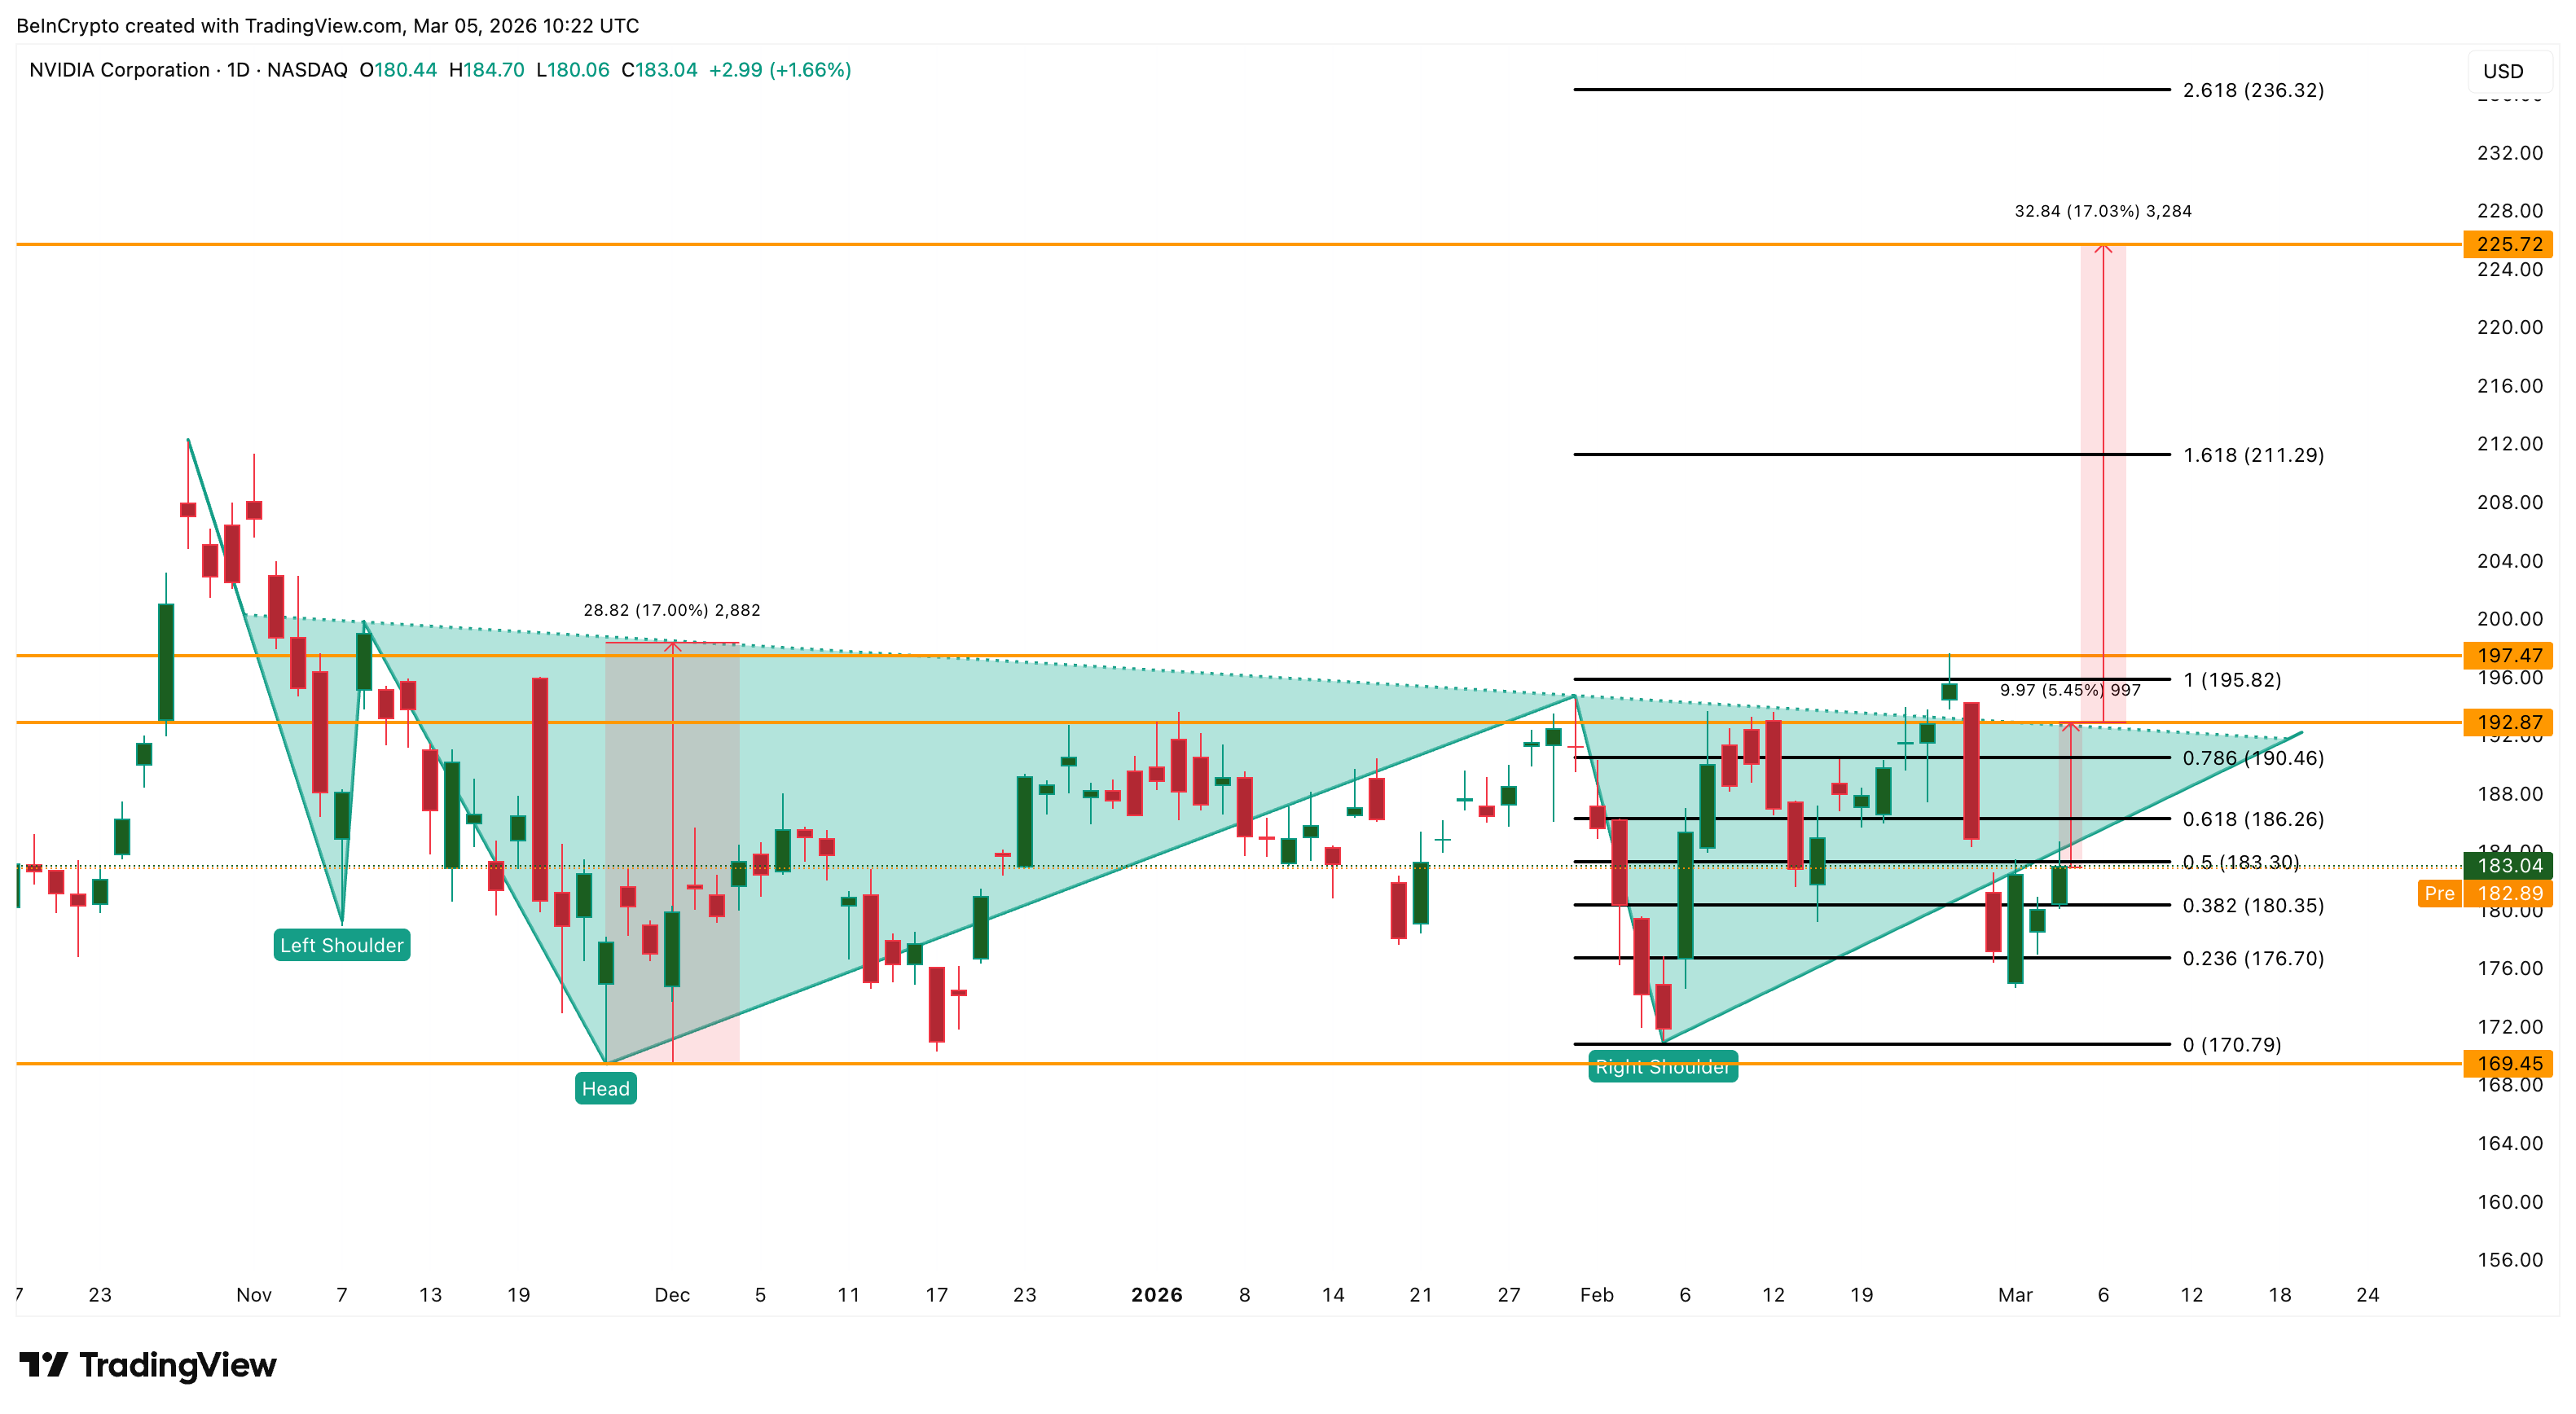 NVIDIA Price Analysis: TradingView
However, downside risks remain if the recovery stalls. Immediate support sits near $176, while the broader structure would weaken if Nvidia falls below $170. A break under $169 would invalidate the current setup entirely and signal that sellers have regained control.
For now, Nvidia’s rebound has reopened the possibility of another attempt toward the $225 region. But whether that path materializes will depend largely on whether institutional demand strengthens enough to confirm the move in the coming sessions.
Recommended Articles


