


Solana’s Reversal Setup Holds, Yet One Rising Metric Carries a 7–10% Warning


Solana price has been under pressure for weeks. The token is still down roughly 13% over the past month, reflecting the broader weakness across the crypto market. Yet beneath the surface, a potential reversal structure is quietly building. A bullish divergence on the chart has already triggered a rebound attempt, and long-term holders appear to be positioning for an extended recovery.
However, another metric is rising at the same time. Historically, that metric has preceded corrections of roughly 7% to 10% in Solana’s price. If the pattern repeats, the current rebound could remain choppy before a sustained recovery begins. Understanding which force wins this battle requires looking at the chart first.
Solana’s Bullish Divergence Appears as Long-Term Holders Increase Accumulation
The first sign of a potential reversal comes from Solana’s momentum structure.
Between January 28 and March 1, Solana’s price formed a lower low. During the same period, the Relative Strength Index (RSI) formed a higher low. The RSI measures momentum by comparing recent gains and losses. When price declines but RSI rises, it creates a bullish divergence. This pattern often appears when selling pressure begins to weaken during a downtrend.
After the divergence appeared, Solana attempted a rebound. The price climbed roughly 10% before losing momentum again as broader market volatility returned. Importantly, the structure remains intact because Solana is still trading above the swing low printed on March 1.
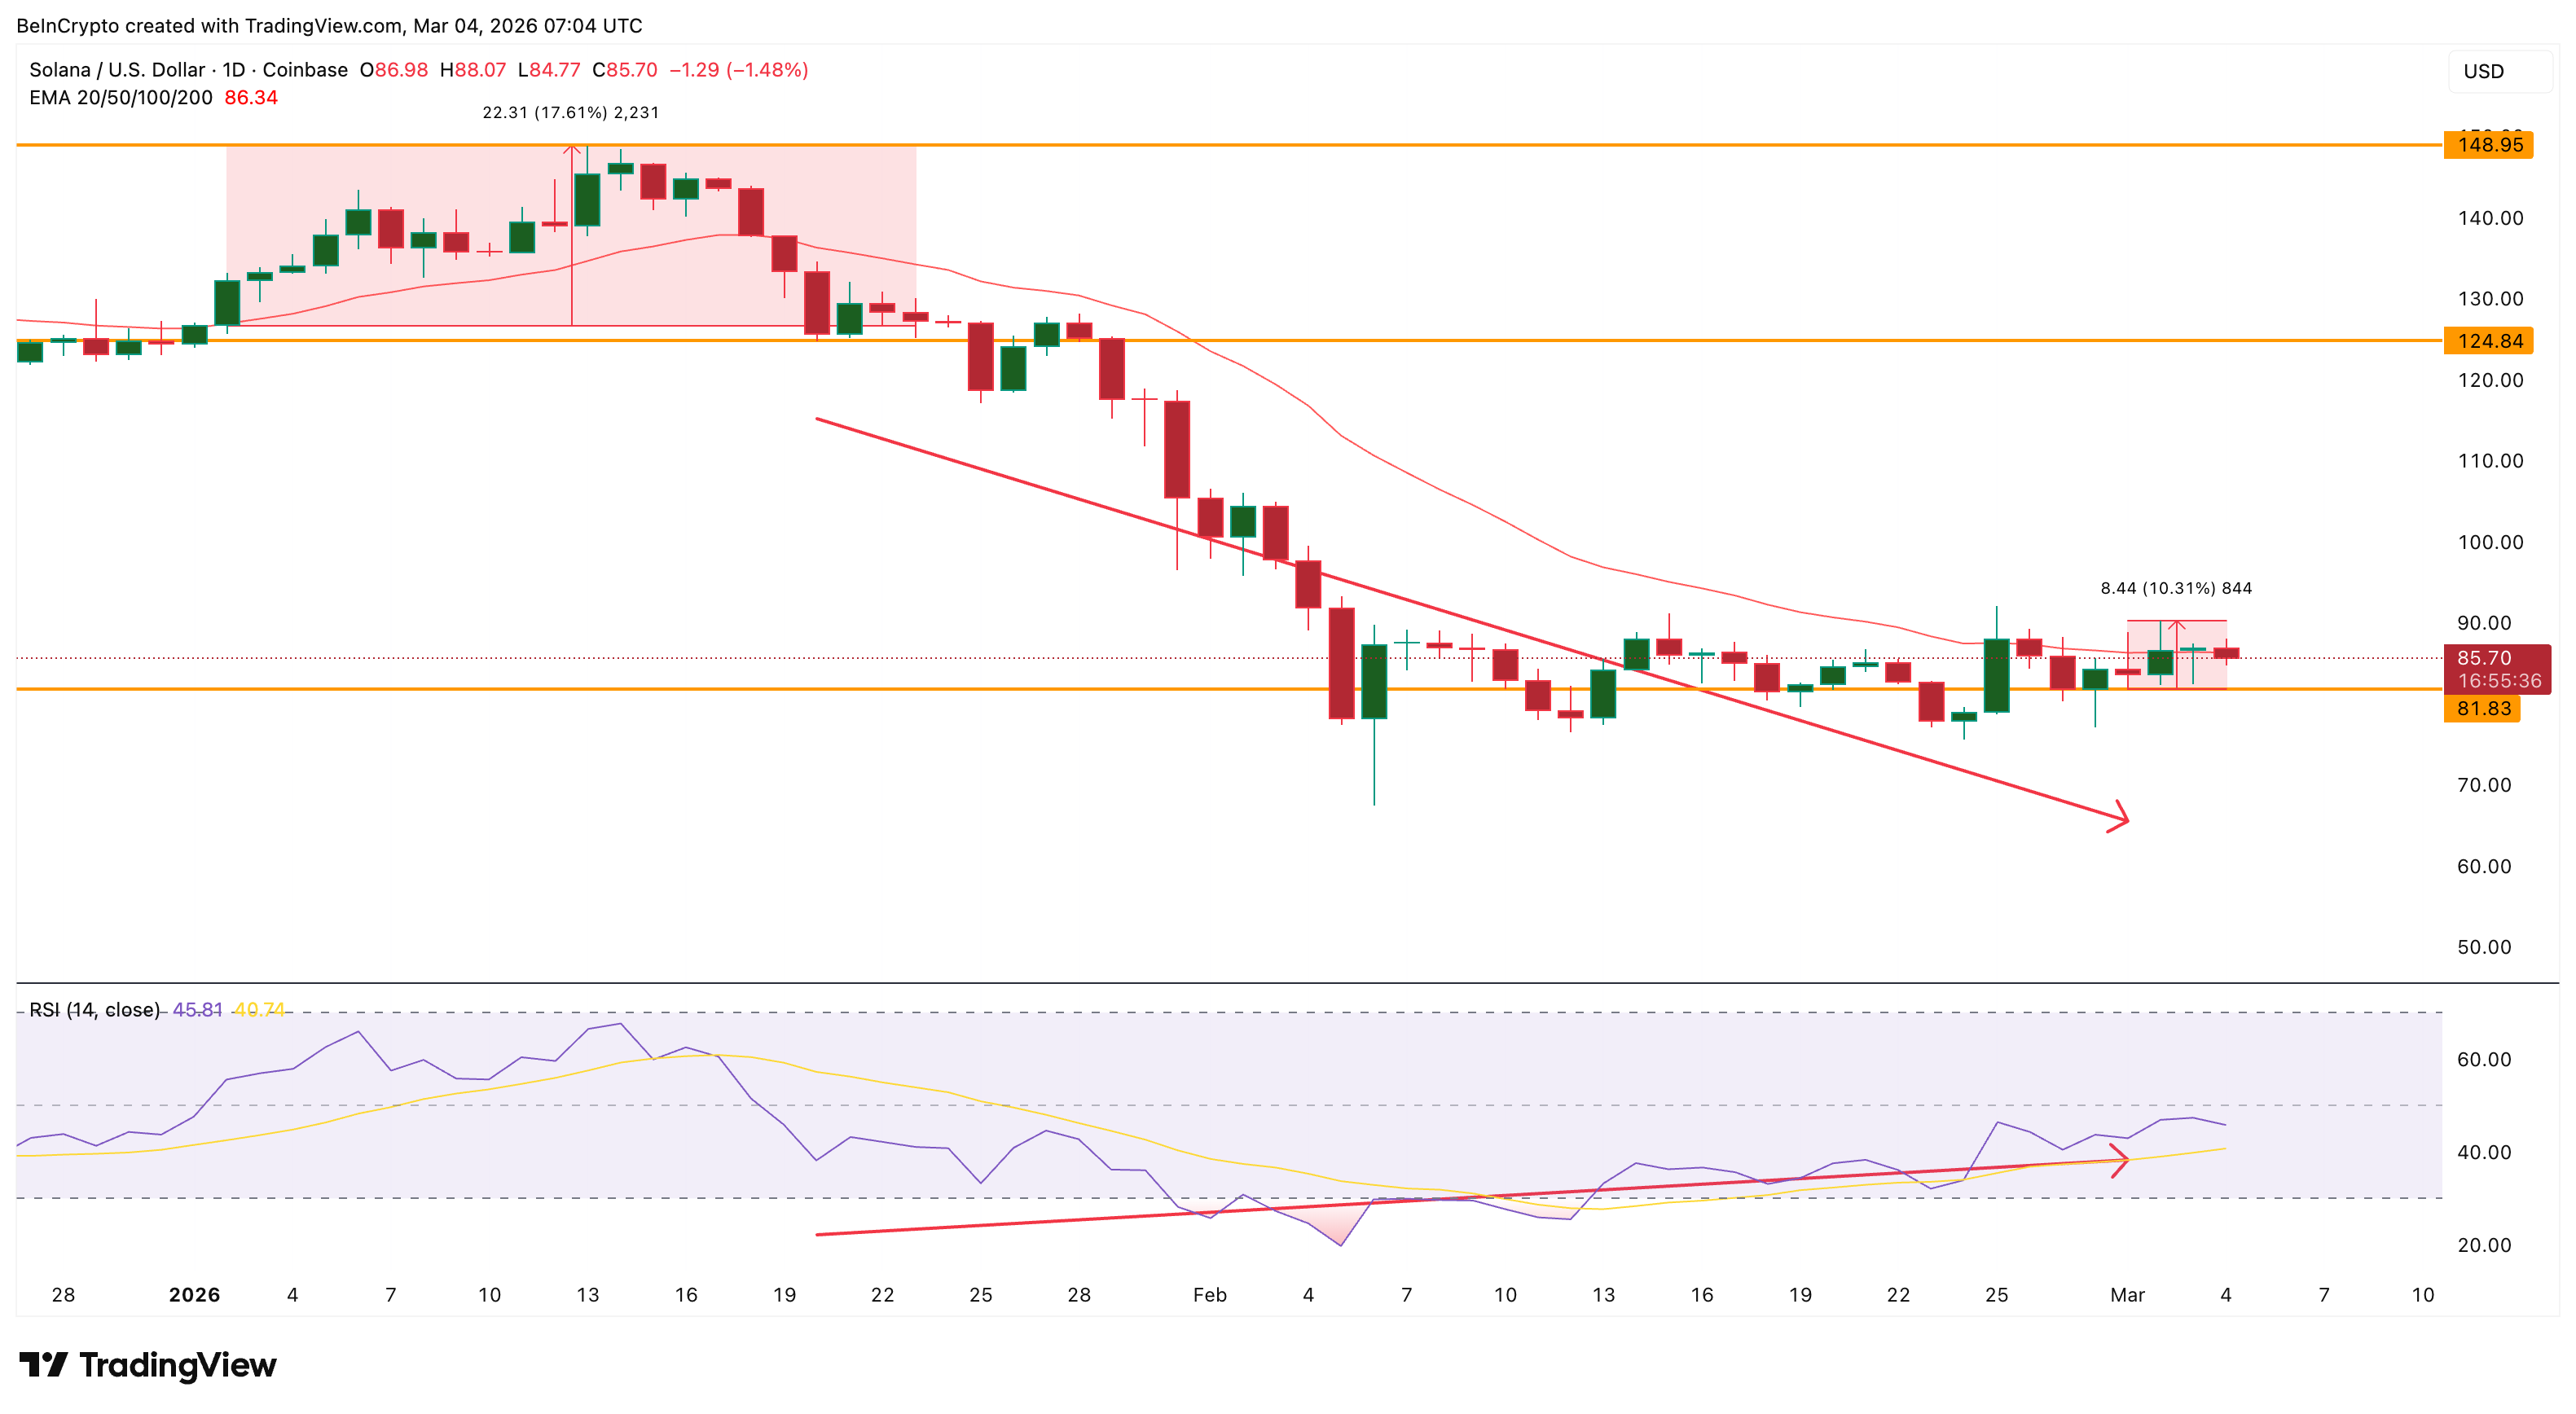
The recent price action is also flirting with the 20-day Exponential Moving Average (EMA). The EMA is a trend indicator that helps traders identify short-term momentum shifts. An EMA reclaim was seen in early January, when Solana went on to rally roughly 17%, reaching a local high near $148. If the current rebound manages to reclaim this level cleanly, it could again strengthen the case for a broader recovery.
On-chain data also shows long-term holders supporting this setup.
The Hodler Net Position Change metric tracks whether investors holding coins for at least 155 days are accumulating or distributing.
Since the divergence appeared on March 1, this metric has strengthened noticeably. Long-term holders increased their net position change from 642,906 SOL to 819,114 SOL by March 3. That represents an increase of roughly 27% in just two days.
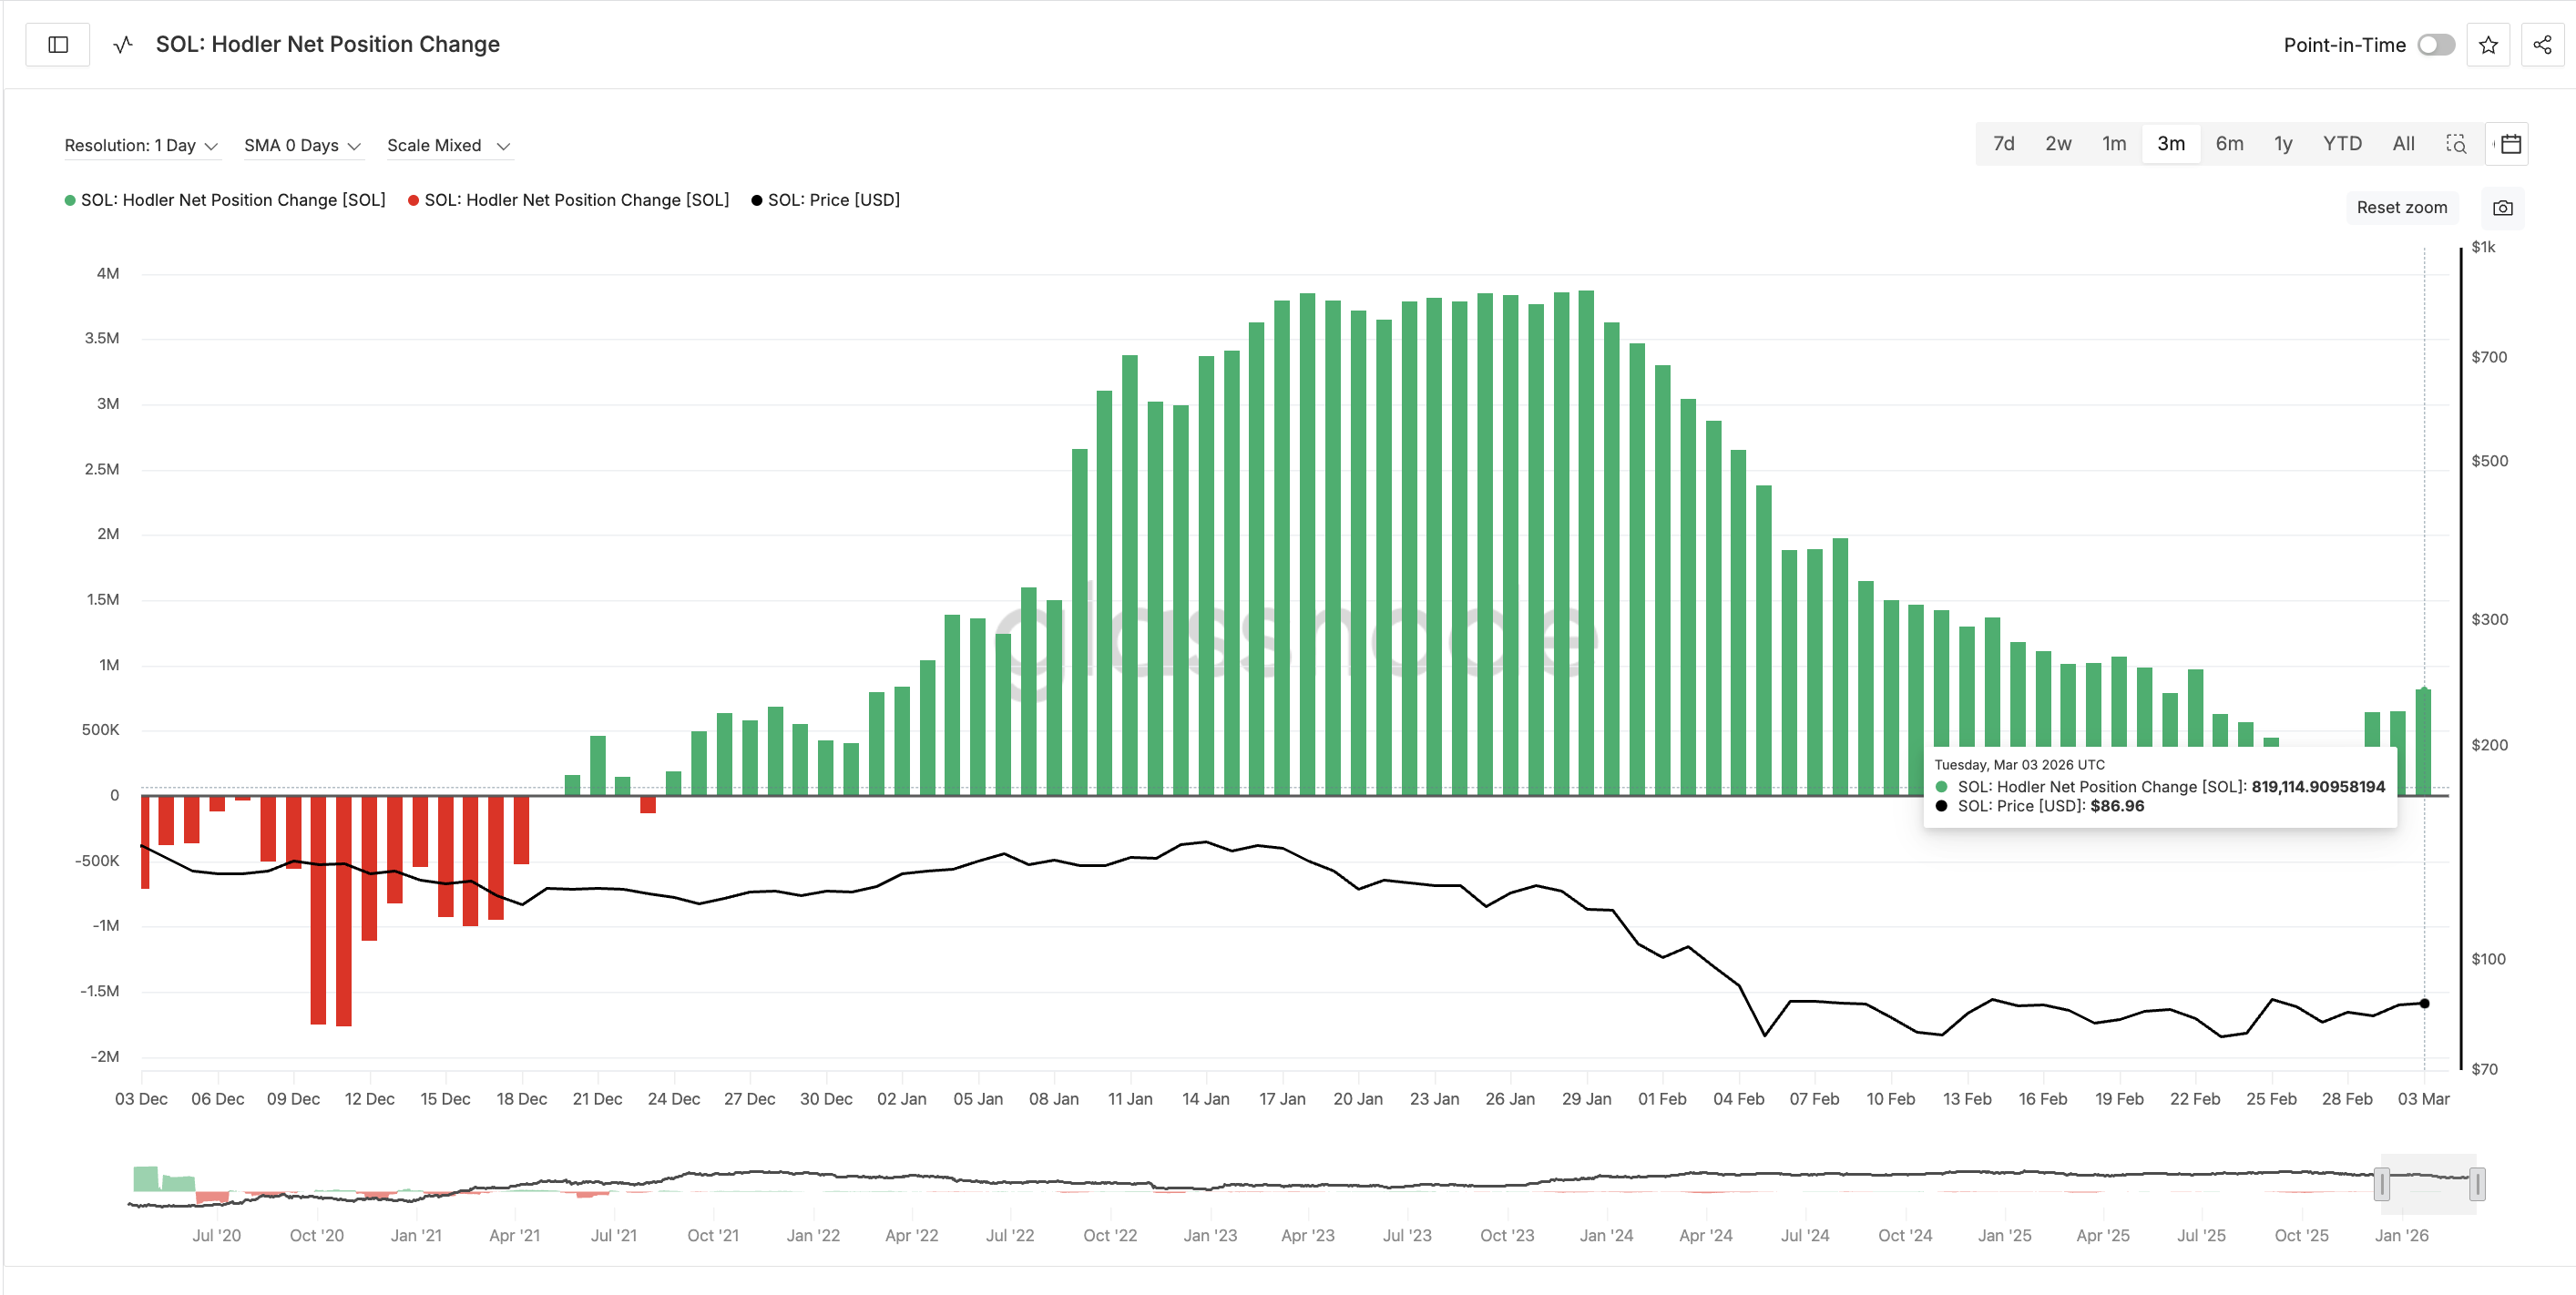
This rise suggests that experienced investors are adding exposure despite the market’s choppy conditions. But accumulation alone does not guarantee a smooth rebound. Another metric is moving in the opposite direction.
Rising Short-Term Holder Metric Has Historically Preceded Corrections
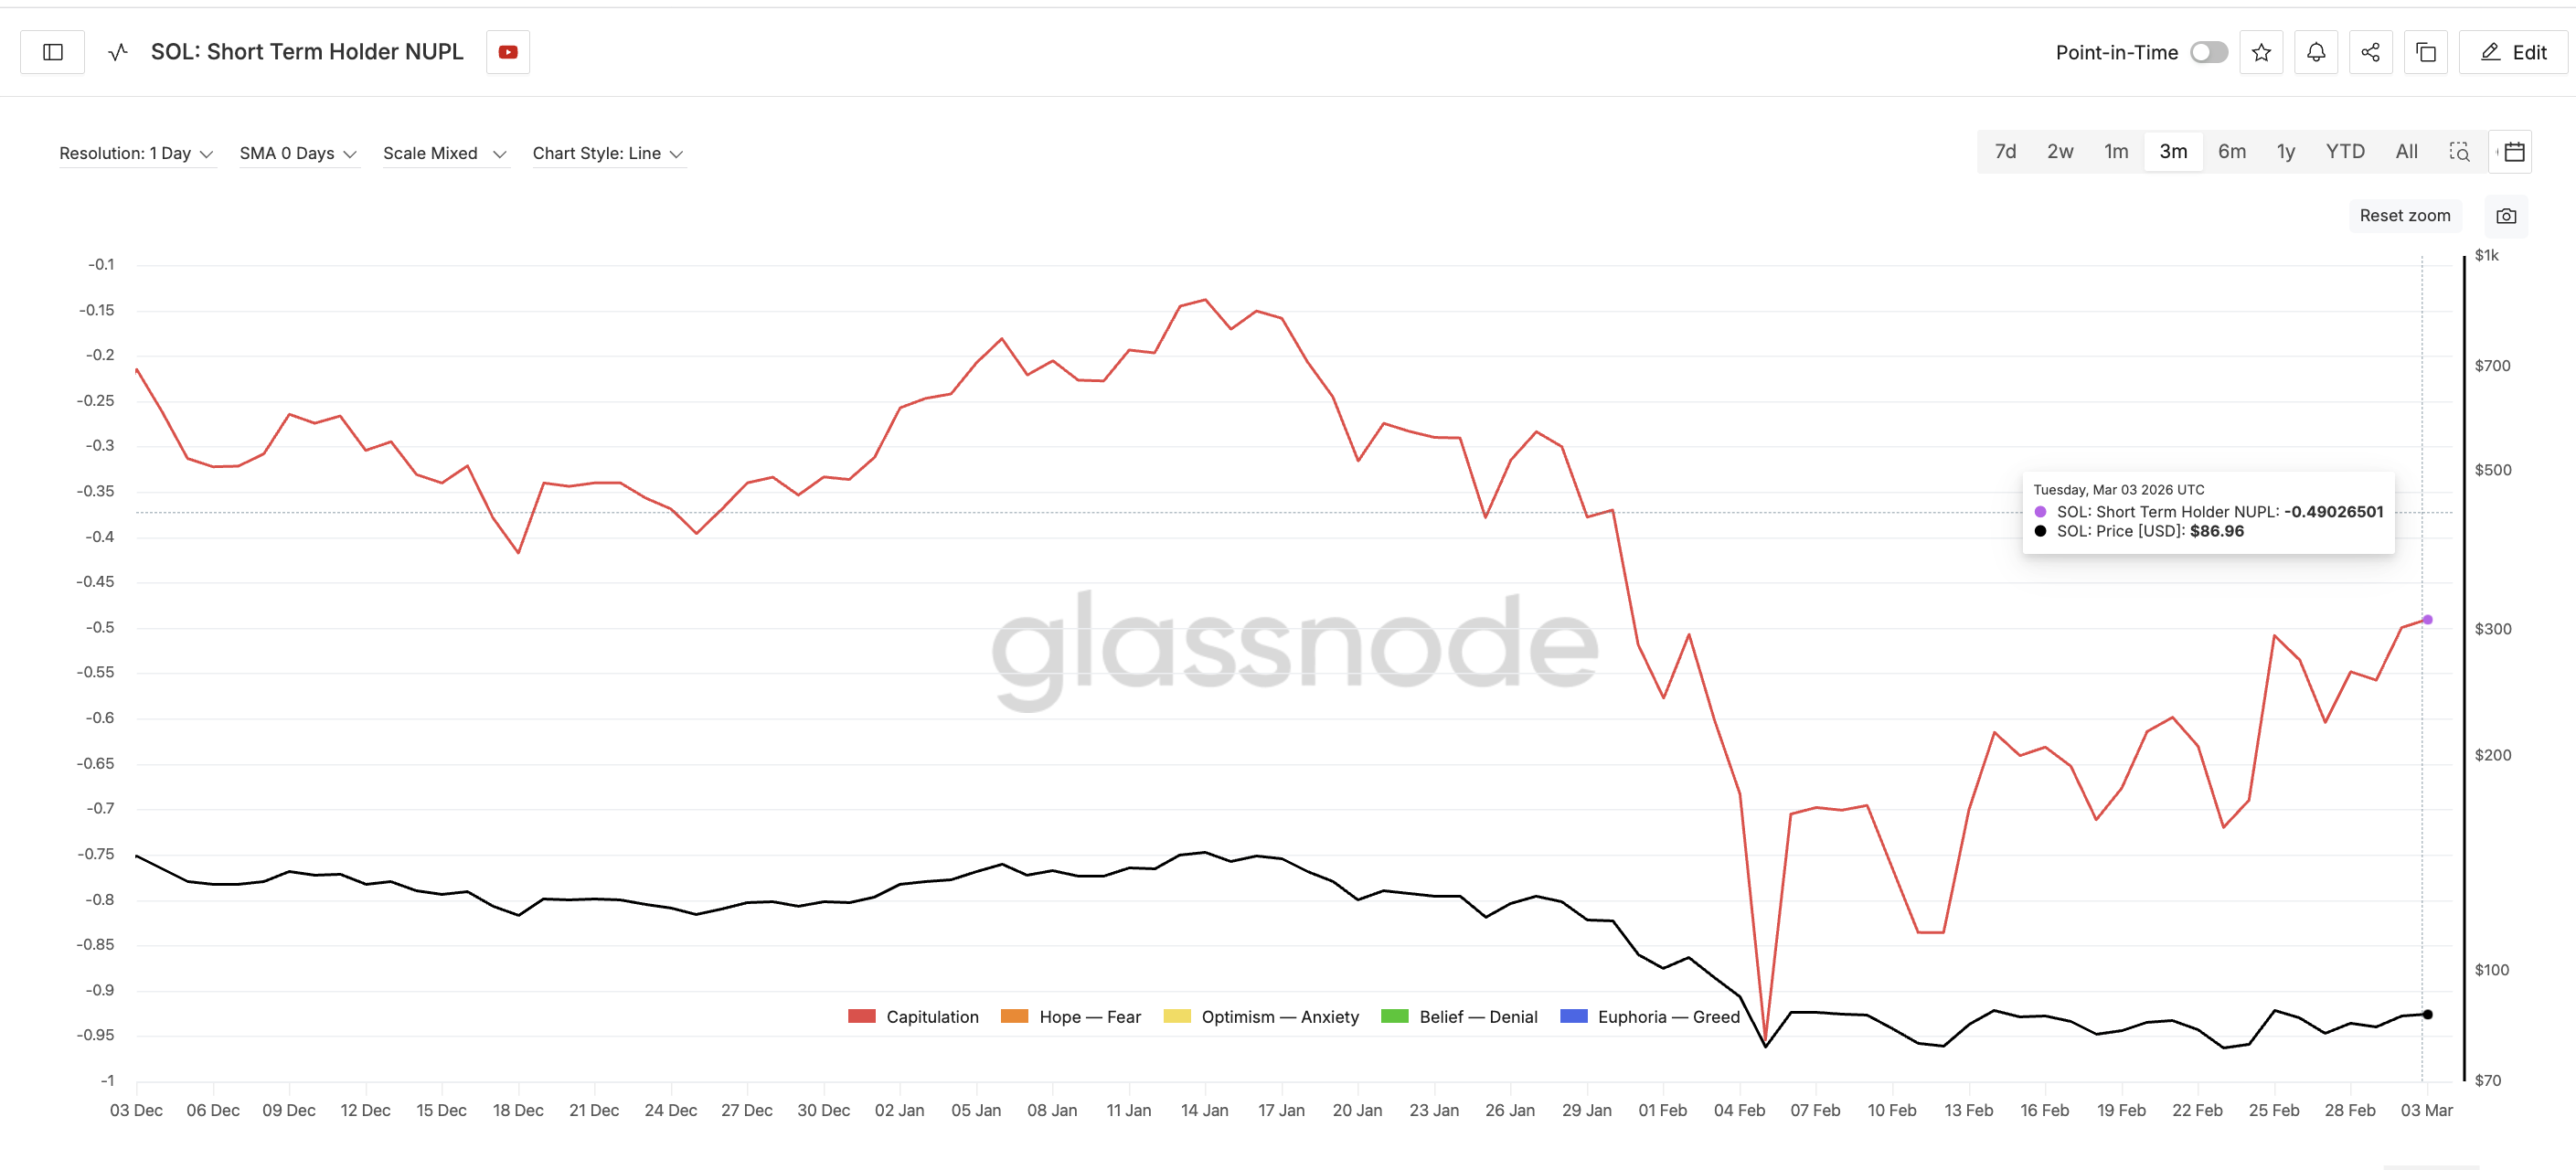
While long-term investors are accumulating, short-term traders are approaching a critical psychological point. This is visible through the Short-Term Holder Net Unrealized Profit/Loss (NUPL) metric.
NUPL measures whether holders are sitting on unrealized profits or losses. When the metric rises, it means losses are shrinking, and traders are moving closer to breakeven levels. Since February 23, Solana’s short-term holder NUPL has risen from −0.71 to −0.49, a recovery of roughly 31%.
Want more token insights like this? Sign up for Editor Harsh Notariya’s Daily Crypto Newsletter here.
Even though the metric remains in the capitulation zone, the shrinking losses can create an incentive for traders to exit positions once the price rebounds. History shows how this dynamic can affect Solana’s price.
On February 24, when the short-term holder NUPL climbed to around −0.50, Solana traded near $88. Within three days, the price dropped to $82, a decline of roughly 7%.
A similar event occurred earlier in February. On February 6, Solana traded near $87 when the short-term holder NUPL rose toward −0.70. Within six days, the price dropped to $78, a fall of nearly 10%.
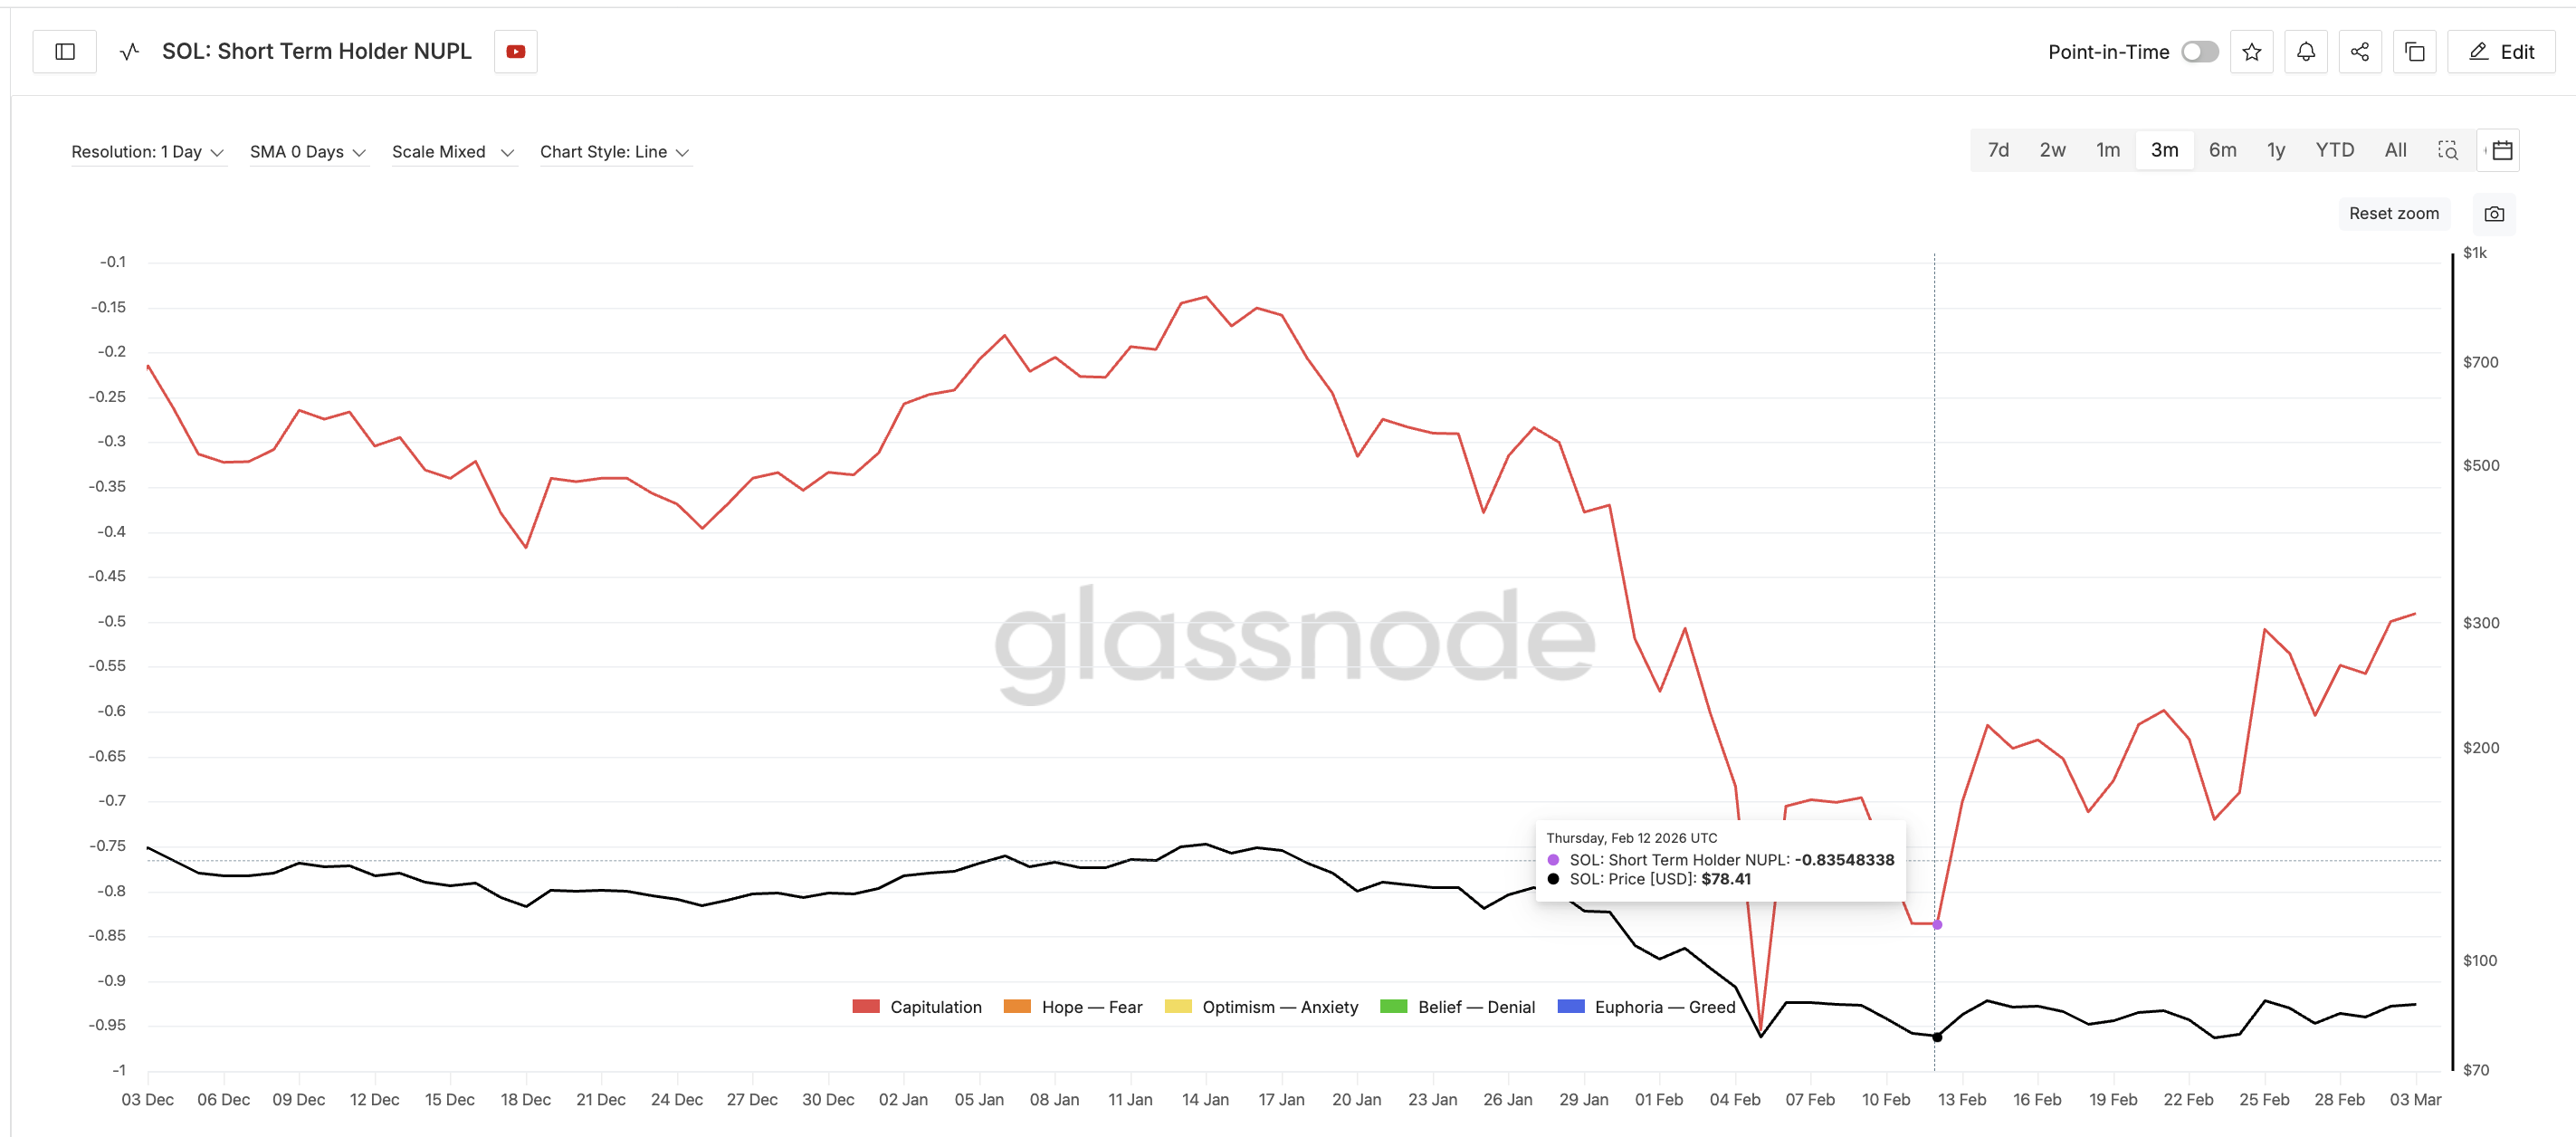
These historical reactions explain why the rising NUPL metric carries a warning. It does not mean traders are taking profits. Instead, many speculative participants who bought at higher levels may sell simply to reduce losses once the SOL price rebounds.
That dynamic becomes even more important when combined with supply distribution data.
A Major SOL Supply Cluster Could Amplify Selling Pressure
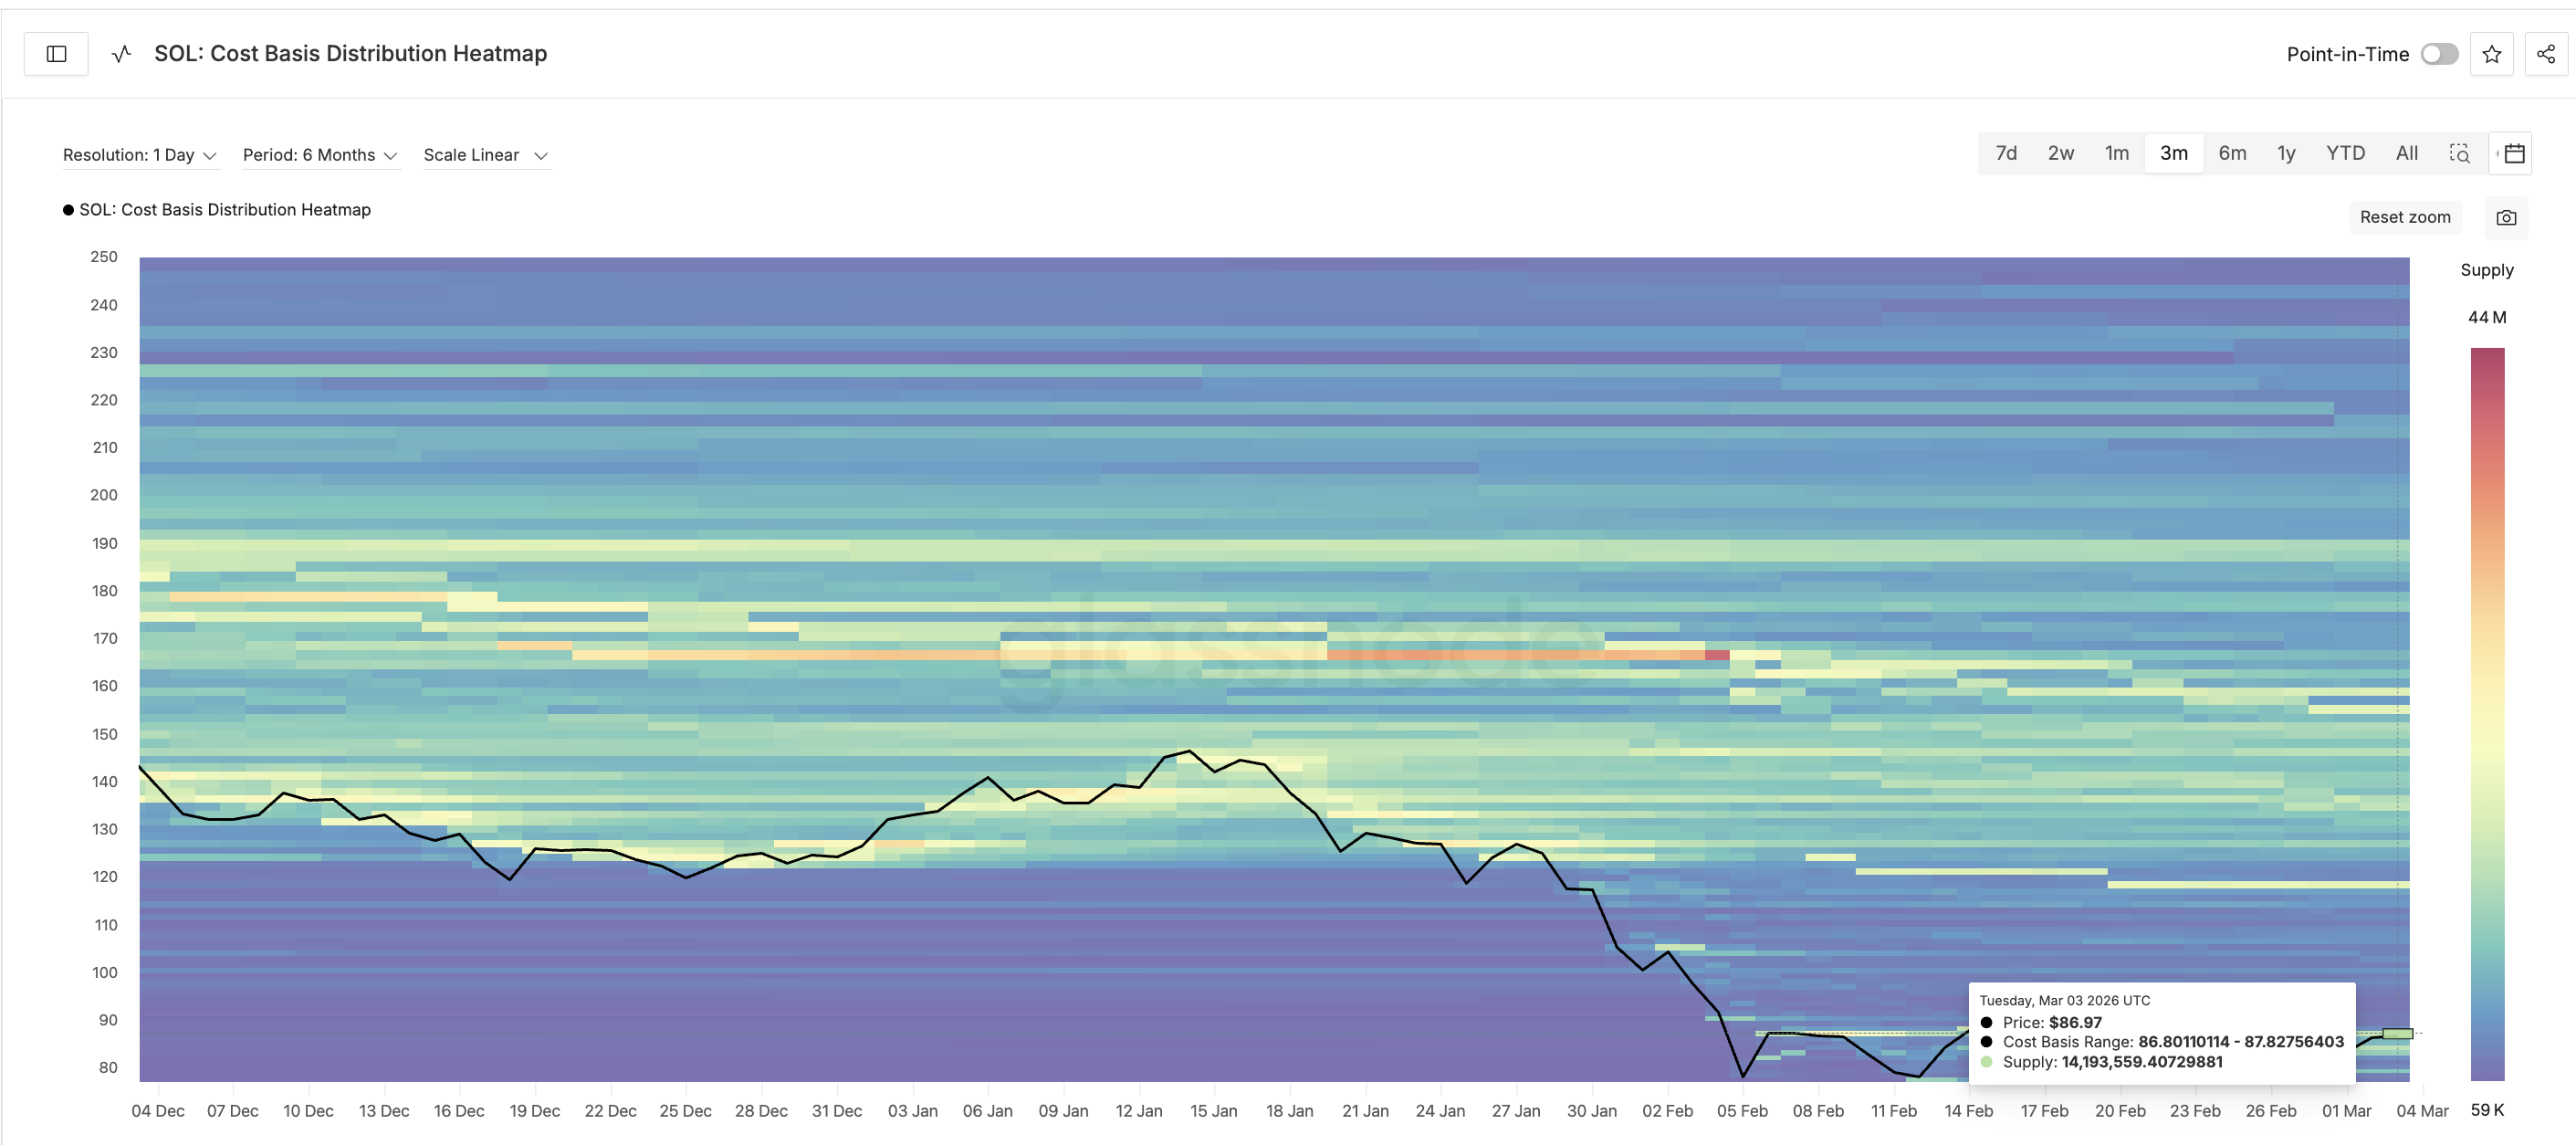
Cost basis distribution helps identify where large groups of investors acquired their tokens. This data reveals a significant cluster between $86.80 and $87.80 ($86-$88 zone), where approximately 14.19 million SOL was accumulated.
Cost basis represents the average price investors paid for their holdings. When price approaches these levels, traders who bought earlier often sell to exit their positions near breakeven. Because short-term holders are already approaching loss-reduction territory, this cluster could act as a powerful resistance zone.
If Solana rebounds toward this range, traders who are trying to reduce losses may sell into the rally. That behavior could reinforce the historical 7–10% pullback pattern seen earlier this month. In other words, the supply cluster and the rising short-term holder NUPL are pointing to the same risk.
But the Solana price chart itself provides the clearest roadmap for what happens next.
The $86–$89 Zone Now Decides the Next Solana Price Move
Solana is currently trading near $83, placing it just below the key resistance zone identified by cost-basis data.
The first hurdle sits near $86, which also aligns with the 20-day EMA. A decisive close above $86 would suggest buyers are gaining strength.
However, the more important level lies slightly higher.
A sustained move above $89 would signal that Solana has cleared the nearest supply cluster without triggering heavy selling. If that happens, the price could extend toward $92, $96, and potentially $101. But failure to break this resistance would support the historical NUPL pattern.
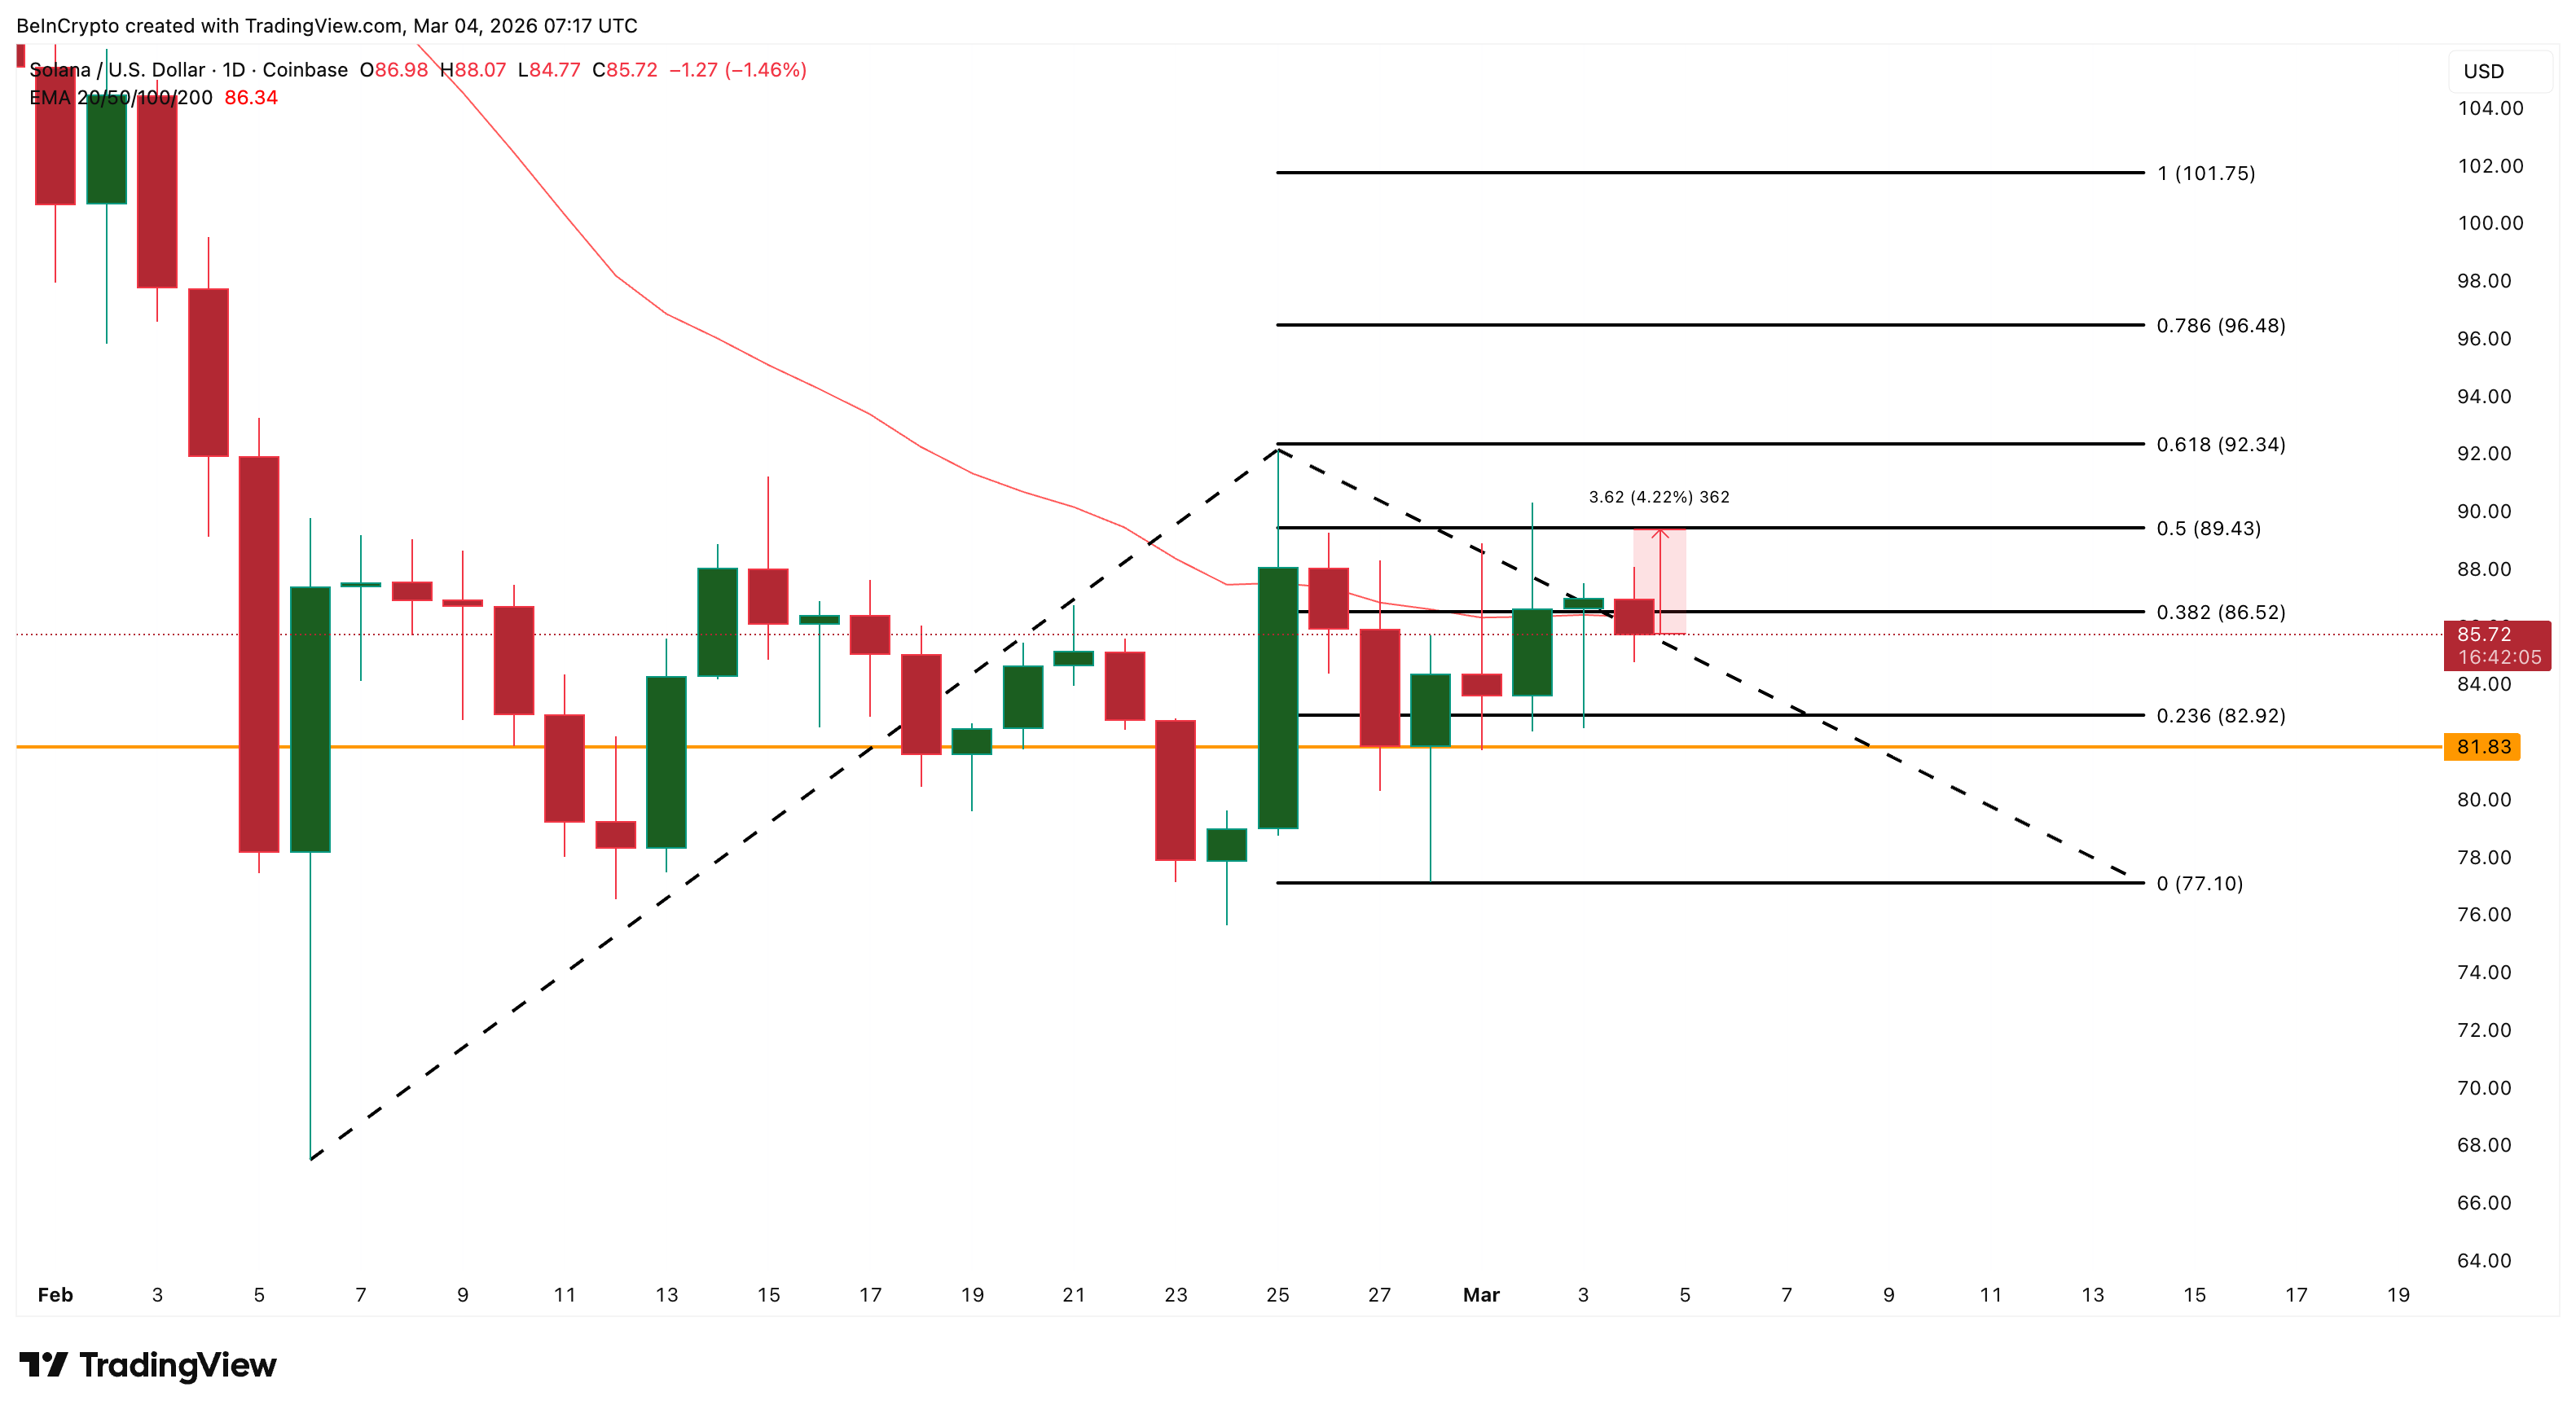
If Solana loses support near $82, the Solana price could quickly revisit $77. A decline of that size would represent roughly a 7–10% correction, closely matching the pullbacks seen earlier this month.
For now, Solana’s reversal structure remains intact. But as history shows, the path higher may not be smooth.
* The content presented above, whether from a third party or not, is considered as general advice only. This article should not be construed as containing investment advice, investment recommendations, an offer of or solicitation for any transactions in financial instruments.


