


Gold holds near one-month lows ahead of Fed decision as higher-for-longer rates weigh
- Gold holds near one-month lows ahead of the Federal Reserve monetary policy announcement.
- Higher-for-longer rate expectations and elevated yields weigh on the non-yielding metal.
- XAU/USD trades below key SMAs on the 4-hour chart, with momentum indicators pointing to sustained downside pressure.
Gold (XAU/USD) trades on the back foot on Wednesday, consolidating near one-month lows as traders refrain from directional bets ahead of the Federal Reserve’s (Fed) monetary policy announcement due later in the American session at 18:00 GMT. At the time of writing, XAU/USD is trading around $4,565, down nearly 3% so far this week.
Higher-for-longer interest rate expectations continue to dominate price action amid mounting inflation risks from rising Oil prices linked to ongoing tensions in the Middle East, as elevated US Treasury yields weigh on demand for the non-yielding metal.
The Fed is widely expected to leave borrowing costs unchanged in the 3.50%-3.75% range for a third straight meeting. With the outcome largely priced in, attention is firmly on guidance from Fed Chair Jerome Powell and how policymakers assess the impact of renewed inflation pressure.
Although rate cut bets for this year have been largely priced out, according to the CME FedWatch Tool, markets remain focused on whether the Fed’s dot plot projection of one cut will materialize, as policymakers navigate the trade-off between stubborn inflation and downside risks to growth and employment.
The next directional move in Gold will likely hinge on Powell’s tone and the market’s interpretation of the policy outlook. A hawkish stance, highlighting upside risks to inflation, could push yields higher and extend the metal’s downside. Conversely, any indication that policymakers remain open to rate cuts later this year may offer some relief to Gold.
However, any meaningful recovery is likely to remain limited as the US-Iran war shows no signs of a near-term resolution, with talks stalled and supply through the Strait of Hormuz severely disrupted under a dual blockade, keeping Oil prices elevated.
On the geopolitical front, a report from the Wall Street Journal said US President Donald Trump has instructed aides to prepare for an extended blockade of Iran, while CNN reported that Tehran is expected to submit a revised peace proposal in the coming days after US officials expressed skepticism over its earlier offer, which left nuclear negotiations for a later stage.
Technical analysis: XAU/USD struggles below SMA cluster as sellers retain control
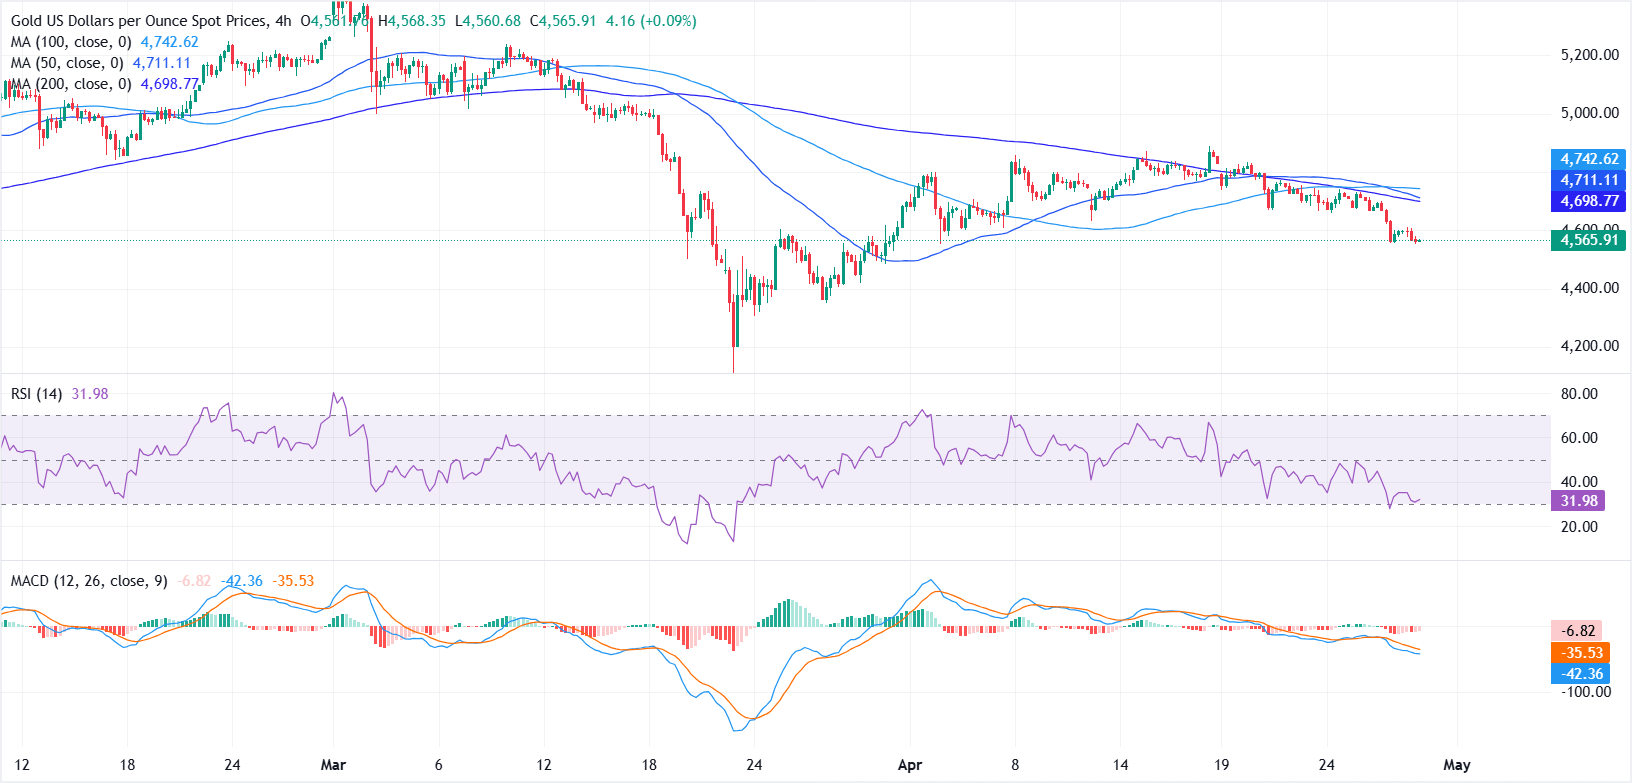
In the 4-hour chart, XAU/USD is extending a bearish phase as price holds well below the 200-period, 50-period and 100-period Simple Moving Averages (SMAs) clustered between roughly $4,698 and $4,742.
This configuration suggests a market trading under a dense band of overhead supply, while the Relative Strength Index (14), hovering near 31, hints at emerging oversold conditions and the negative Moving Average Convergence Divergence (MACD) reading reinforces persistent downside momentum.
On the upside, initial resistance is aligned with the 200-period SMA at about $4,698, followed by the 50-period SMA near $4,711 and the 100-period SMA around $4,742, which together define a layered cap that bulls would need to reclaim to ease the current bearish pressure.
On the downside, immediate support is located in the $4,550-$4,500 zone. A sustained break below this region could expose the metal to deeper losses.
(The technical analysis of this story was written with the help of an AI tool.)
Fed FAQs
Monetary policy in the US is shaped by the Federal Reserve (Fed). The Fed has two mandates: to achieve price stability and foster full employment. Its primary tool to achieve these goals is by adjusting interest rates. When prices are rising too quickly and inflation is above the Fed’s 2% target, it raises interest rates, increasing borrowing costs throughout the economy. This results in a stronger US Dollar (USD) as it makes the US a more attractive place for international investors to park their money. When inflation falls below 2% or the Unemployment Rate is too high, the Fed may lower interest rates to encourage borrowing, which weighs on the Greenback.
The Federal Reserve (Fed) holds eight policy meetings a year, where the Federal Open Market Committee (FOMC) assesses economic conditions and makes monetary policy decisions. The FOMC is attended by twelve Fed officials – the seven members of the Board of Governors, the president of the Federal Reserve Bank of New York, and four of the remaining eleven regional Reserve Bank presidents, who serve one-year terms on a rotating basis.
In extreme situations, the Federal Reserve may resort to a policy named Quantitative Easing (QE). QE is the process by which the Fed substantially increases the flow of credit in a stuck financial system. It is a non-standard policy measure used during crises or when inflation is extremely low. It was the Fed’s weapon of choice during the Great Financial Crisis in 2008. It involves the Fed printing more Dollars and using them to buy high grade bonds from financial institutions. QE usually weakens the US Dollar.
Quantitative tightening (QT) is the reverse process of QE, whereby the Federal Reserve stops buying bonds from financial institutions and does not reinvest the principal from the bonds it holds maturing, to purchase new bonds. It is usually positive for the value of the US Dollar.
Recommended Articles


