


Goldman Sachs Group Inc Stock (GS) Moved Up by 3.13% on Apr 17: What Signal Does It Send?
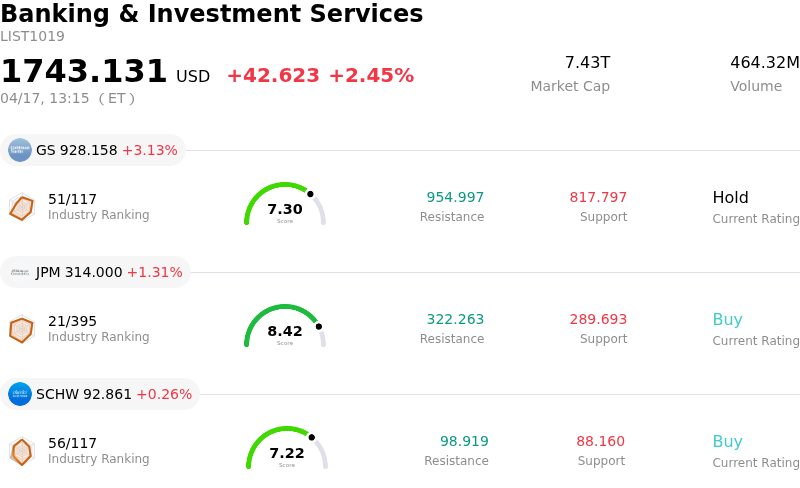
Goldman Sachs Group Inc (GS) moved up by 3.13%. The Banking & Investment Services sector is up by 2.45%. The company outperformed the industry. Top 3 stocks by turnover in the sector: Goldman Sachs Group Inc (GS) up 3.13%; JPMorgan Chase & Co (JPM) up 1.31%; Charles Schwab Corp (SCHW) up 0.26%.
What is driving Goldman Sachs Group Inc (GS)’s stock price up today?
Goldman Sachs Group Inc. (GS) shares saw an upward movement today, indicating positive market sentiment towards the financial giant. This increase is primarily attributed to a more thorough market digestion and appreciation of the company's robust first-quarter 2026 financial results, which were released earlier this week.
The company reported strong performance for the quarter, with net revenues surpassing analyst expectations. Overall net revenues climbed significantly, and diluted earnings per common share considerably exceeded forecasts from Wall Street analysts. Key drivers for this strong financial showing included exceptional growth in Global Banking & Markets, specifically a notable increase in investment banking fees, largely fueled by a rise in mergers and acquisitions volumes. The equities segment also delivered a robust performance, contributing substantially to the firm's top line.
Despite an initial mixed reaction in the immediate aftermath of the earnings release, as some market participants focused on specific areas of weakness such as fixed income trading, the broader picture of the company's financial health appears to be resonating positively. The market is now likely weighing the overall strength, significant beats on both revenue and earnings per share, and strong returns on equity. Furthermore, the declaration of a quarterly dividend by the board of directors also signals confidence in the company's financial stability and commitment to shareholder returns.
Analyst sentiment remains largely positive, with several firms revising their price targets upwards following the strong earnings report, suggesting continued upside potential for the stock. This collective re-evaluation of the company's fundamental performance and future outlook is a significant factor in today's positive share price movement.
Technical Analysis of Goldman Sachs Group Inc (GS)
Technically, Goldman Sachs Group Inc (GS) shows a MACD (12,26,9) value of [7.03], indicating a buy signal. The RSI at 59.86 suggests neutral condition and the Williams %R at -21.38 suggests oversold condition. Please monitor closely.
Fundamental Analysis of Goldman Sachs Group Inc (GS)
Goldman Sachs Group Inc (GS) is in the Banking & Investment Services industry. Its latest annual revenue is $117.10B, ranking 2 in the industry. The net profit is $16.30B, ranking 1 in the industry. Company Profile
Over the past month, multiple analysts have rated the company as Hold, with an average price target of $929.28, a high of $1050.00, and a low of $614.29.
More details about Goldman Sachs Group Inc (GS)
Company Specific Risks:
- Increased provisions for credit losses in Q1 2026 were higher than anticipated, compressing net interest income margins due to macroeconomic uncertainty, single-name impairments, and portfolio growth.
- Goldman Sachs disclosed a slight decline in its investment banking fee backlog, indicating potential future headwinds for a key revenue-generating segment.
- Despite an overall earnings beat, the firm experienced underperformance in fixed income (FICC) revenue and Asset & Wealth Management revenue against some analyst expectations.
- CEO commentary highlighted significant macroeconomic and geopolitical headwinds, including the war in Iran, rising crude oil prices, AI-driven disruption narratives, and private credit liquidity pressures, which could delay M&A activity and impact future growth.
Recommended Articles


