




AAVE Price Drops 75% From August Peak – What’s Next For the Altcoin?


Aave (AAVE) trades near $91 after shedding almost 75% of its value since the August 2025 peak. The coin is now retesting long-term support, with the descending daily trendline flipping from resistance to tentative support.
The setup offers a binary picture. Bulls see a potential 49% move toward $135 if support holds. Bears point to a confirmed weekly double top and rising exchange supply weighing on price.
Exchange Inflows Spike as AAVE Supply Builds on Exchanges
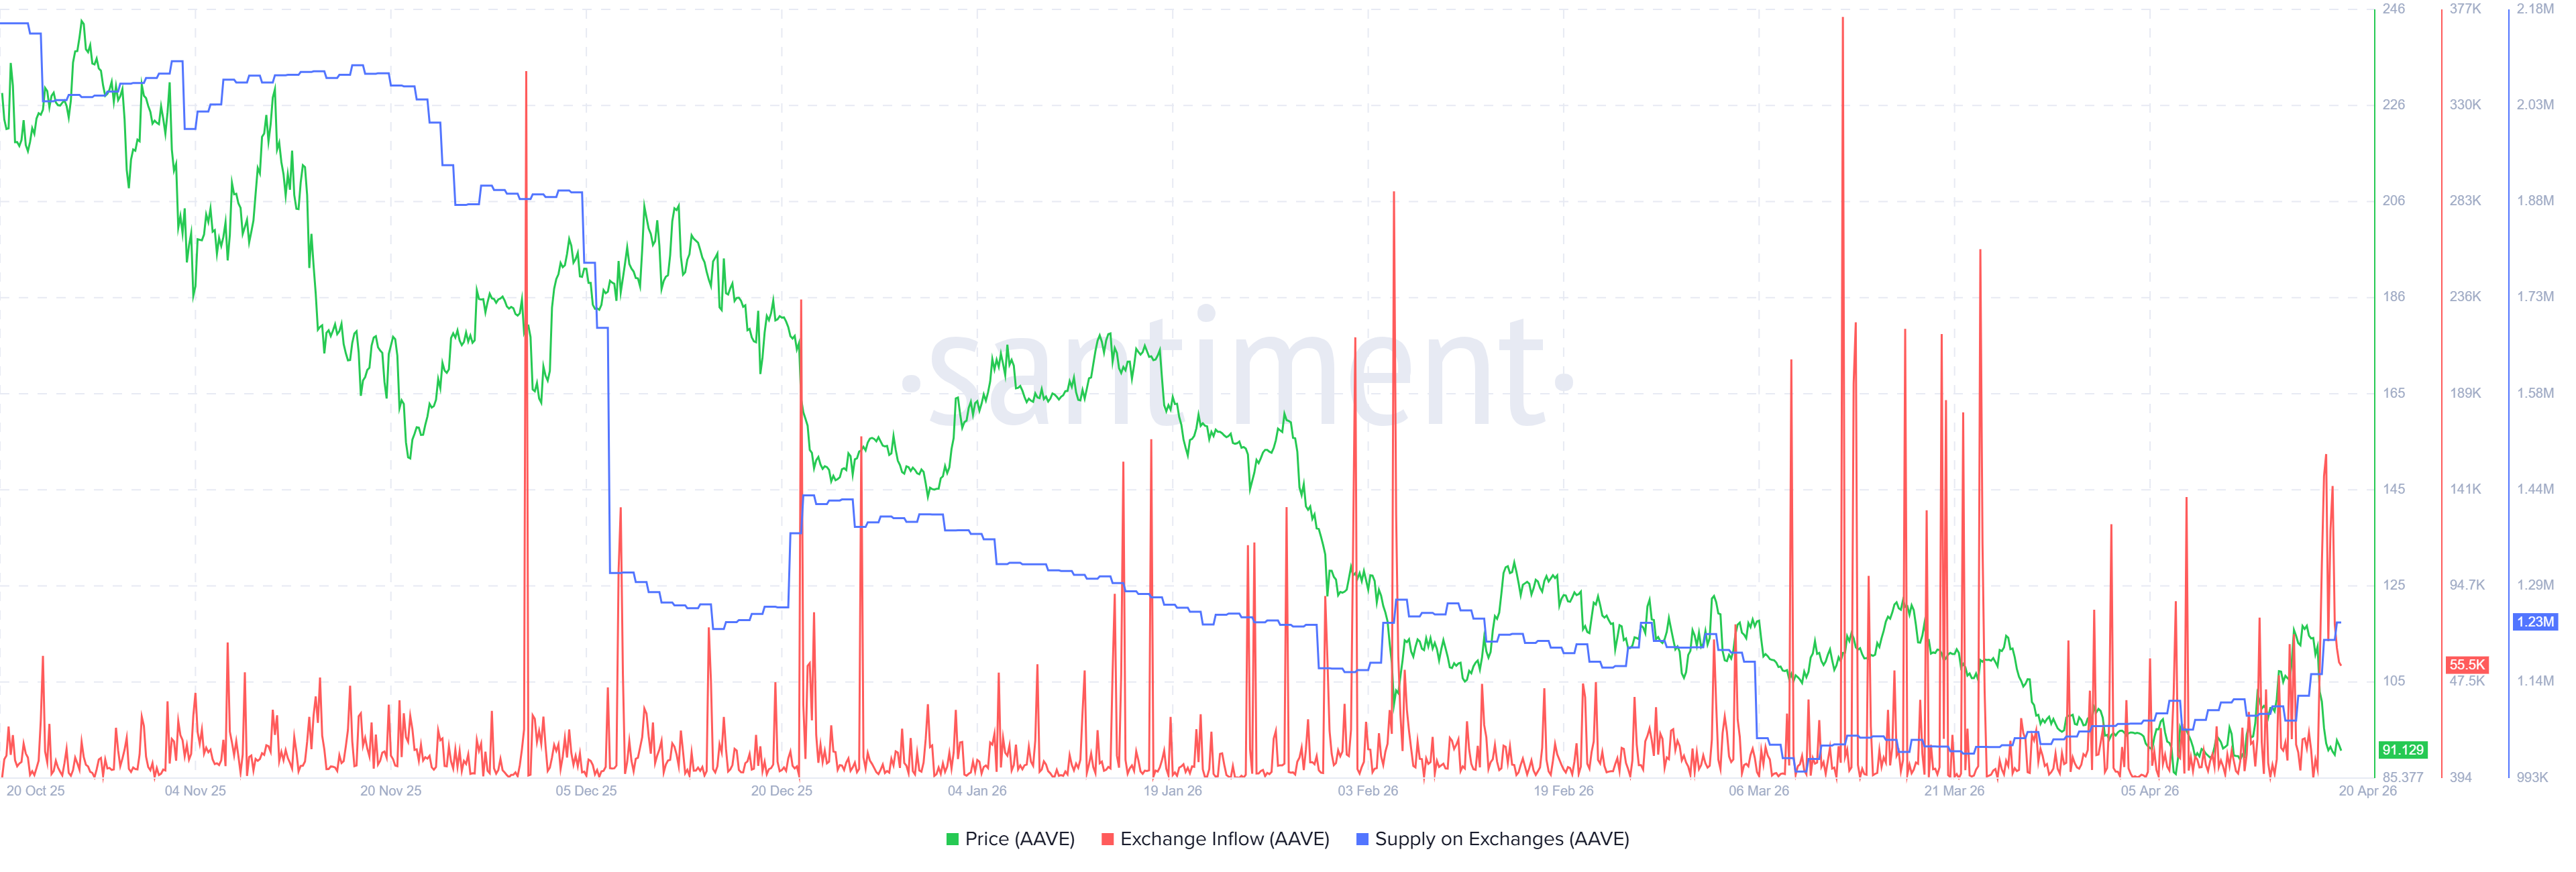
Santiment data shows AAVE exchange inflows spiked over the past two days. The reading marks the largest inflow cluster since March 2026. It lined up closely with the recent sell-off from $112 back toward $90.
Supply on exchanges has also climbed steadily since early April. The metric first rose alongside the push higher. Then it accelerated as price turned lower, pointing to active distribution by larger holders.
Both signals suggest coins moved to exchanges first to sell into strength. Fresh coins kept arriving as price broke down. The bearish read would flip only if exchange supply starts declining and daily inflows cool off.
Weekly Chart Hints at Reversal Despite Long-Term Double Top
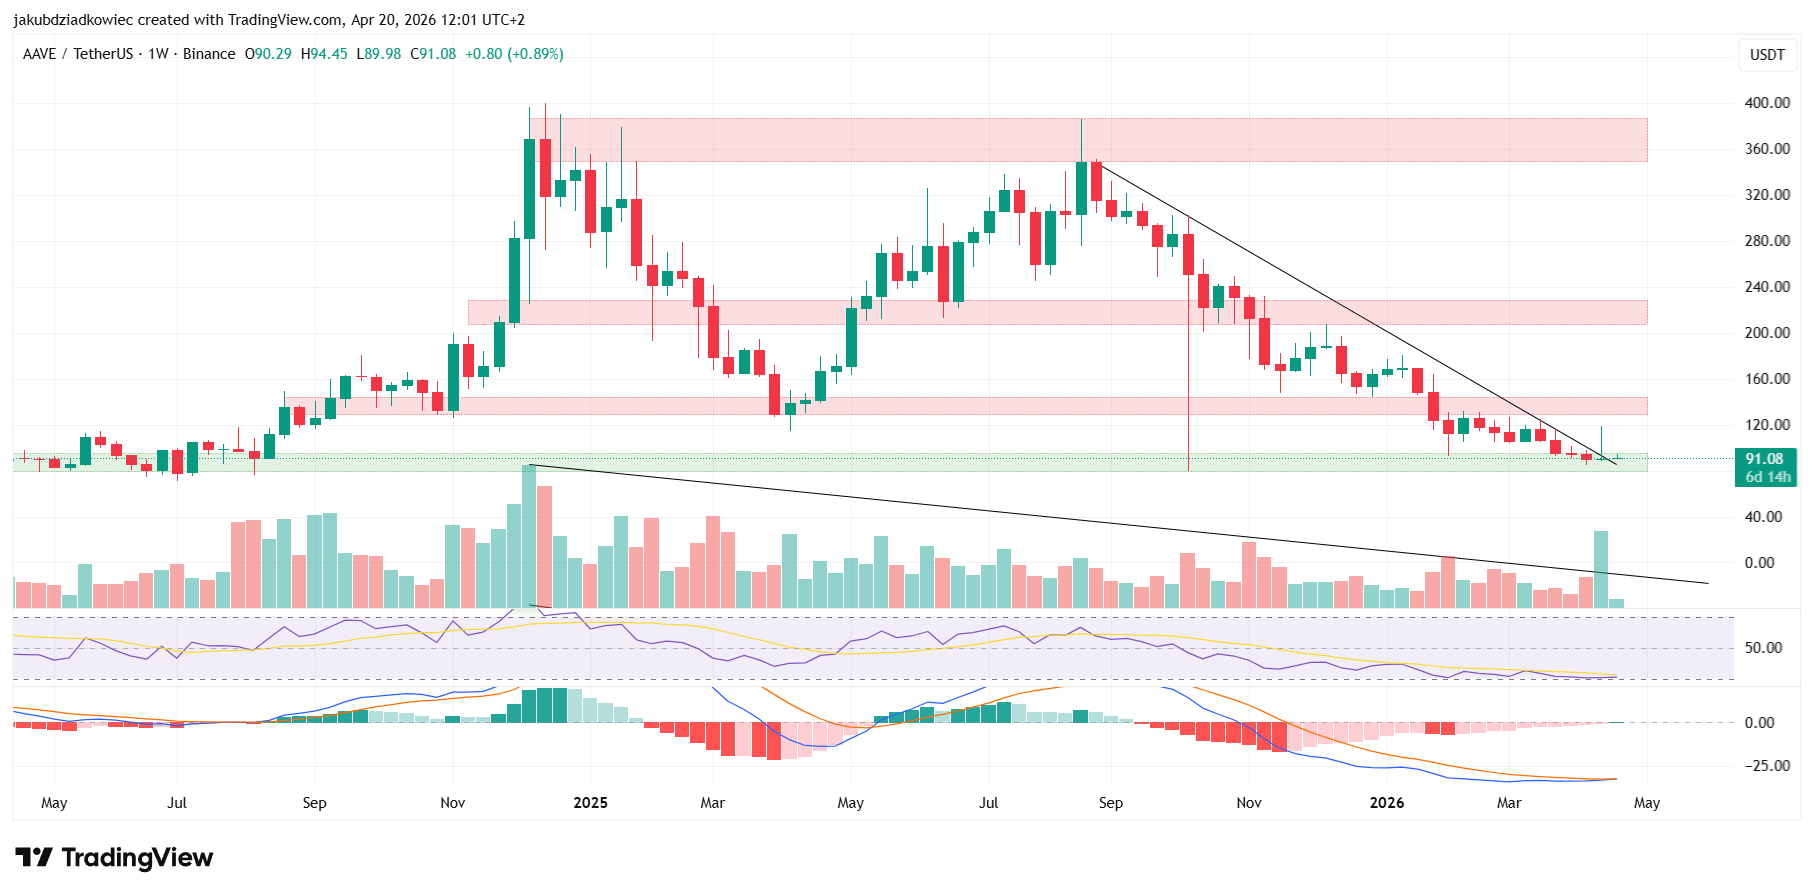
The on-chain picture is heavy, yet the weekly chart carries a contrasting signal. AAVE has printed a long-term double top. The first peak landed near $380 in December 2024. The second topped near $360 in August 2025.
Since that August high, the token has fallen roughly 75%. It now sits inside the May green support zone. Three ascending resistance areas remain above price, at $135, $215, and the $360 to $380 range.
Last week, AAVE pushed for a weekly gain of nearly 33%. The move also broke a descending trendline drawn from the August peak. A parallel descending volume trendline also broke out, hinting at stronger buyer engagement. However, the move faded and price closed back near the weekly open.
The weekly MACD may print its first bullish cross since May. A confirmed cross would signal a fresh momentum shift. RSI still leans bearish near oversold territory, so the momentum story is not yet decisive. Recent protocol changes tied to AAVE governance have so far failed to lift price.
AAVE Price Prediction 49% Upside If Trendline Support Holds
On the daily chart, AAVE trades inside a descending parallel channel dating back to January 2026. The descending trendline carried over from the weekly was tapped twice before the breakout, on March 16 and March 25.
On April 13, price broke above the trendline and stretched to $112. The move gave back almost all gains within days. On April 19, the trendline was retested from above, flipping into short-term support.
If support holds and bulls reclaim the channel midline, the first target sits near $135. That represents roughly a 49% gain from current levels. A confirmed weekly MACD cross would strengthen that scenario, as would a second trendline test that holds.
Daily indicators stay neutral for now, with RSI near 42 and MACD slightly positive. The last two sessions also printed a volume spike that matched bearish candles. That matters given recent oracle issues that renewed caution among AAVE traders.
Invalidation is straightforward. A daily close back below the green support zone near $80 would void the retest thesis. Deeper lows would then become likely for the broader AAVE market.
 Don't Miss Today's Market Moves Start trading Forex, Gold & Crypto today Regulated platform | Fast withdrawals
* The content presented above, whether from a third party or not, is considered as general advice only. This article should not be construed as containing investment advice, investment recommendations, an offer of or solicitation for any transactions in financial instruments.


