

Will the Stock Market Crash in 2026? History Shows This Is the Smartest Way to Prepare.
Key Points
The S&P 500 CAPE ratio is a useful tool to help measure frothiness in the stock market.
A high CAPE reading usually signals the market may be topping and a correction could be on the horizon.
Smart investors can prepare for stock market crashes using a number of different strategies.
- 10 stocks we like better than S&P 500 Index ›
Despite some pressures from lingering inflation and shifting expectations around interest rates, the S&P 500 (SNPINDEX: ^GSPC) has nudged 9.6% higher so far this year, propelled by robust spending on artificial intelligence (AI) infrastructure and resilient earnings growth.
Amid this advance, the index's cyclically adjusted price-to-earnings (CAPE) ratio has reached its highest reading since the dot-com era. The CAPE ratio measures the S&P 500's valuation by dividing current prices by the average inflation-adjusted earnings over the past decade. It is important because elevated levels have historically forecast weaker future returns.
Where to invest $1,000 right now? Our analyst team just revealed what they believe are the 10 best stocks to buy right now, when you join Stock Advisor. See the stocks »
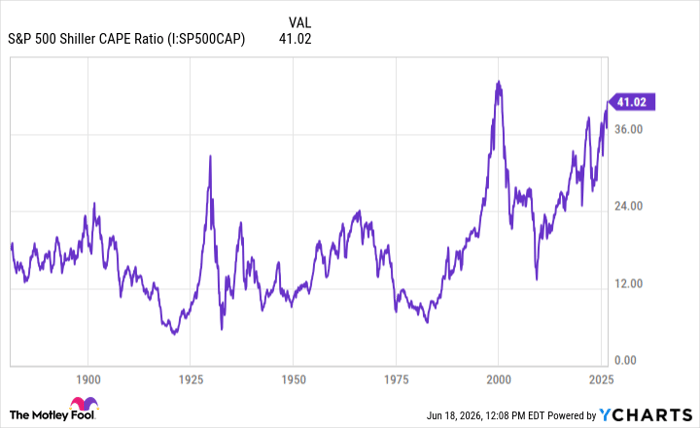
S&P 500 Shiller CAPE Ratio data by YCharts
With the ratio now at its highest level in over two decades, a rising CAPE ratio could indicate that prices are outpacing sustainable earnings growth. As such, this could foreshadow a correction or crash as the market adjusts to more reasonable valuations.
What is the best way to prepare for a stock market crash?
To prepare for a stock market crash, investors should reassess their portfolio's asset allocation and tilt it toward more resilient holdings. This means increasing exposure to bonds for income stability, along with defensive stocks in utilities, healthcare, and consumer staples, as these sectors tend to fare better during downturns.
Another thing investors can do is establish a dedicated cash reserve to navigate market turbulence. Building liquidity protects you from selling stocks during corrections and also gives you the ability to buy the dip in attractive investments when prices fall.

Image source: Getty Images.
Remember to keep a long-term mindset
Implementing safeguards like predetermined stop-loss orders is a smart way to limit your downside. By automatically triggering sales in certain positions, investors can easily transition their funds into higher-quality businesses.
Above all else, investors should maintain a long-term mindset. One of the best ways to do this is to use dollar-cost averaging across high-conviction blue-chip stocks. While a crash is not necessarily guaranteed this year, seasoned investors understand that corrections are a normal part of the investment cycle and often lead to better entry points overall.
Should you buy stock in S&P 500 Index right now?
Before you buy stock in S&P 500 Index, consider this:
The Motley Fool Stock Advisor analyst team just identified what they believe are the 10 best stocks for investors to buy now… and S&P 500 Index wasn’t one of them. The 10 stocks that made the cut could produce monster returns in the coming years.
Consider when Netflix made this list on December 17, 2004... if you invested $1,000 at the time of our recommendation, you’d have $417,305!* Or when Nvidia made this list on April 15, 2005... if you invested $1,000 at the time of our recommendation, you’d have $1,293,148!*
Now, it’s worth noting Stock Advisor’s total average return is 936% — a market-crushing outperformance compared to 209% for the S&P 500. Don't miss the latest top 10 list, available with Stock Advisor, and join an investing community built by individual investors for individual investors.
See the 10 stocks »
*Stock Advisor returns as of June 22, 2026.
Adam Spatacco has no position in any of the stocks mentioned. The Motley Fool has no position in any of the stocks mentioned. The Motley Fool has a disclosure policy.
Recommended Articles


