

NVIDIA (NVDA) at $205: Why Jensen Huang’s $1 Trillion Blackwell-Rubin Vision Matters More Than the Pullback
TradingKey - NVIDIA (NASDAQ: NVDA) is currently trading at $204.65, currently executing a measured correction within its overarching uptrend, having just tested the 0.618 Fibonacci support level at $211.20, with the next key downside barrier sitting at the 1.0 retracement level near $194.83. Shares are holding steady above the long-term EMA200 trend at $187.86, while simultaneously pressing against the EMA50 at $206.76. At the same time, the RSI is positioned at 45.34 in the neutral zone and, crucially, there is no divergence evident to suggest further weakness on the downside. Consequently, this move appears far more likely to be profit-taking from a phenomenal quarter than the early stages of a sustained corrective phase.
Following the stock's fiscal first-quarter earnings release in late May, NVIDIA posted fiscal Q1 2027 revenue of $81.6 billion, which represents a 85% rise year-over-year with its Data Center segment alone generating $75.2 billion in revenue, up 92%. For anyone reviewing their positions this weekend, the price at which shares traded last Friday may be secondary to the $1 trillion in revenue from just two NVIDIA products, Blackwell and Rubin, expected to generate revenue in 2026 and 2027 alone, a forecast which Jensen Huang delivered at NVIDIA’s recent GTC conference.
Why the Q1 Beat Still Matters Weeks Later
While NVIDIA reported its fiscal Q1 2027 results a few weeks ago, the implications remain fresh. NVIDIA’s Q1 results, which covered the quarter ending April 26, showed Data Center revenue of $75.2 billion, a 92% year-over-year increase and 21% quarter-over-quarter gain. The rise was driven by adoption of the Blackwell 300 products as well as InfiniBand and the NVIDIA Spectrum-X Ethernet with NVLink, with the company noting it experienced 3x higher demand for these products.
Its non-GAAP gross margin was 75.0%, which alleviates worries that the margin would suffer as it ramped the new Blackwell 300 chips. Its non-GAAP EPS was $1.87, which is better than the estimate by more than 5% and extends NVIDIA’s streak of beating Wall Street estimates to four consecutive quarters. For the quarter, its free cash flow was $48.6 billion, meaning it generated $48.6 billion of cash during the quarter, which by itself makes it one of the best quarter of cash generation from any company ever.
On a weekend such as this, the most significant aspect of the quarter is the fact that the company announced the Vera CPU which it says would create an additional $200 billion of opportunity for NVIDIA. NVIDIA is currently selling its AI products in close to 40 countries, which have a combined GDP of $50 trillion. As Jensen Huang described it during the earnings call, the buildout of the AI factories will be the largest infrastructure buildout in human history.
It’s the sort of statement that could easily sound hyperbolic until you look at the numbers, with a 85% revenue increase in the first three months of the year for a company with roughly $216 billion in trailing revenue. Or a 92% data center increase, or the potential to generate $1 trillion in just two years from the Blackwell and Rubin chip families.
Q2 Guidance and the Rubin Transition — What to Watch When Markets Reopen
NVIDIA provided a Q2 fiscal 2027 revenue outlook of $91.0 billion, +/-2%, a number that notably does not factor in Data Center compute income from China due to the ongoing geopolitical and export control uncertainty there. If hit, that guidance will represent yet another double-digit sequential lift on the heels of a record-breaking quarter, which is exactly what long-term holders should be keeping an eye on when the market opens again on Monday, as opposed to focusing on how the stock is acting one day at a time. Gross margins are guided between 74.9% and 75.0%, indicating management expects the Rubin transition, which is still in the early phases, will not create the type of cost headwinds that sometimes keep investors awake at night during major transitions in chip architecture.
Rubin is the more compelling forward-moving variable. The general analyst consensus currently calls for Rubin to get meaningful contribution to revenue next quarter, with full year calls of $38 billion; Jensen Huang has stated that he thinks Vera Rubin will do a better job of stealing more share in the inference space specifically, an area that makes up more and more of the overall AI compute footprint as more AI applications make the jump from training to inference in production. As a position being evaluated over the weekend rather than traded during the day, it is the Rubin ramp from the second half of the fiscal year that is going to matter as to if the $1 trillion two-year goal was conservative or ambitious, not this week’s price action.
NVDA Technical Setup — Fib 0.618 Support Near $211, Targets $227.74 and $237.91
The daily time frame on NVDA is taking a measured correction within the ascending blue channel, testing down at the 0.618 retracement area and the 1.0 level at $194.83, while the EMA200 at $187.86 is way down here to act as a backstop and the EMA50 at $206.76 is being tested as support from the underside. RSI sits at a neutral 45.34 with no bearish divergence in evidence, and on the downside, volume is thinning, the characteristics of sound profit taking during a markup move and not signs of trend reversal.
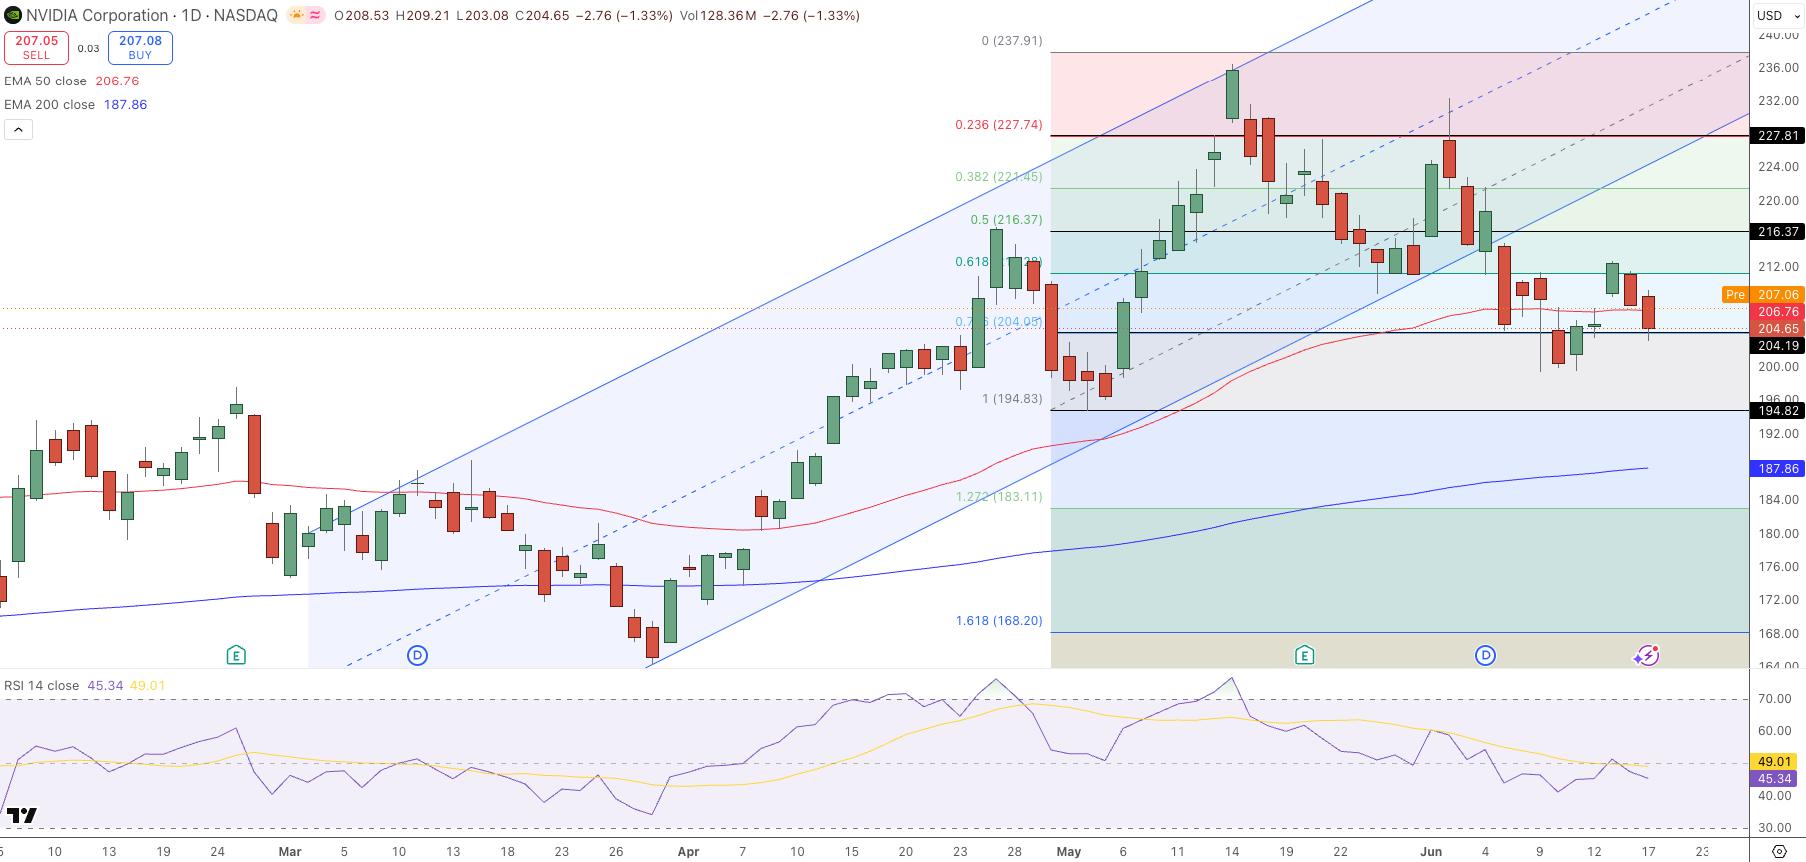
NVIDIA Price Chart - Source: Tradingview
The Fibonacci levels off the most recent swing low have resistance at 0.382 ($224.45), 0.236 ($227.74), 0.0 ($237.91), and the channel is projecting toward $240-plus on continuation. A strong close over $216.40 would target the Fib bounce level at $227.70.
- Entry: Long above $216.40, EMA50 zone and Fibonacci confluence cleared
- Target 1: $227.70, 0.236 Fibonacci level
- Target 2: $237.91, 0.0 Fibonacci level
- Stop Loss: Close below $194.80, 1.0 Fibonacci and deeper support levels invalidated
- Next catalyst: Q2 FY2027 earnings report and results, Revenue guidance of $91.0 billion +/-2%, which does not include data center compute revenues from China
Bottom Line
While there's still a chance the earnings call could have a negative outcome that could have an impact on the price, I have yet to see a reason for a bearish view on the NVDA stock at this point. It has pulled back to $205 following the release of its Q1 fiscal 2027 earnings report, and it is worth noting the earnings call included revenue growth of 85%, Data Center revenue growth of 92%, as well as its gross margin holding at 75% for the quarter as it rams the Blackwell products into production. The previous concerns for margin compression were resolved in today's report.
Naturally, the price will also have to react to any market-moving news or sentiment shifts during this earnings season. While there's always the possibility a bad news day could have an impact on NVDA shares, Jensen Huang's claim that the Blackwell and Rubin processors will generate $1 trillion in combined revenue in the next two years is the figure to keep in mind as we head into the new week. The $1 trillion estimate is something I think we should anchor to more so than a single day's market performance. While the $194.80 stop is where we should get worried about the NVDA stock price's short-term trend, the RSI is holding at 45.34 and volume appears to be ebbing on the daily pullback. This looks more like digestion of the price within an intact uptrend rather than the start of a downtrend.
The long $227.70 and $237.91 price targets, as well as stop-loss at $194.80, come down to the same points. The Q2 guidance of $91 billion, excluding China, will be the next major data point to watch in case we start to see some shift in trajectory after earnings
Recommended Articles


