

The Stock Market Is Doing Something Not Witnessed Since the Dot-Com Bubble. Here's What History Says Comes Next.
Key Points
Stock prices have been soaring over the past year, with no signs of slowing.
However, it's becoming increasingly likely that the market is overvalued.
Choosing the right stocks is more important than ever right now.
- 10 stocks we like better than S&P 500 Index ›
The S&P 500 (SNPINDEX: ^GSPC) has soared by over 26% over the last 12 months, as of this writing, and it seems as if there's little that can slow the market down. Even after a brief hiccup earlier this month, major indexes rebounded almost immediately and are now closing in on new record highs.
All this growth makes for an incredibly pricey market, however, and many investors are growing concerned that we're in a bubble on the verge of popping.
Where to invest $1,000 right now? Our analyst team just revealed what they believe are the 10 best stocks to buy right now, when you join Stock Advisor. See the stocks »
There's one stock market indicator that sounded the alarm before both the Great Depression and the dot-com bubble burst, and it's reaching historic levels yet again. Here's what that might mean for your investments.

Image source: Getty Images.
Is history repeating itself? Here's what the data says.
The S&P 500 Shiller CAPE Ratio measures the S&P 500's price against its inflation-adjusted earnings over the last 10 years, providing a snapshot of the index's valuation over time. A higher metric suggests that the S&P 500 is becoming increasingly expensive and, in some cases, overvalued.
Throughout history, the CAPE ratio has averaged around 17. In the late 1920s, as the stock market crash and the Great Depression approached, it reached the mid-30s. It spiked again in 1999, reaching an all-time high of around 44 as dot-com stocks ballooned in value. As of this writing, the metric is just over 41.
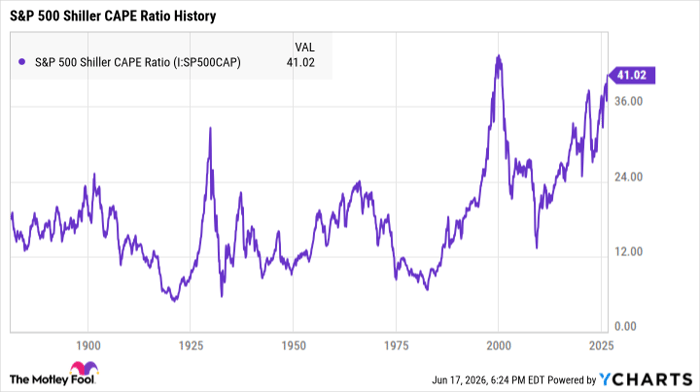
S&P 500 Shiller CAPE Ratio data by YCharts
While the ratio is currently at its second-highest level in history, that doesn't necessarily mean a downturn is imminent. The tech stock boom has led to the normalization of higher valuations, and there's a distinction between a high valuation and being overvalued.
High valuations themselves aren't necessarily dangerous. Overvalued stocks, on the other hand, are those whose prices no longer match the company's underlying fundamentals, and those companies risk crashing hard during the next market pullback.
Warren Buffett's advice for moments like this
Warren Buffett recently commented on this historically pricey market during an interview with CNBC ahead of Berkshire Hathaway's annual meeting.
Buffett has long compared the stock market to a church with a casino attached, with one representing slow-but-steady long-term investing and the other short-term risk-taking. He noted during the interview that lately, "the casino has gotten very attractive to people."
"But that doesn't mean that investing is terrible," Buffett added. "It does mean that prices for an awful lot of things will look very silly."
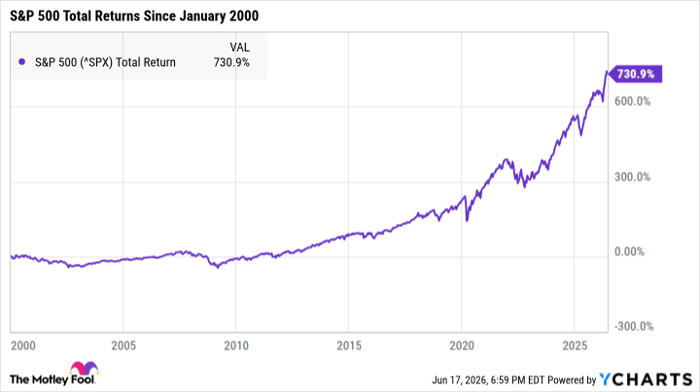
^SPX data by YCharts
Some stocks are incredibly overvalued right now, and they will have the furthest to fall whenever the market inevitably turns. Long-term investors who are buying and holding stocks with healthy valuations, however, won't have to worry as much.
Healthy stocks may tumble in the near term, but history has proven that strong foundations make for lucrative investments over the long term. The S&P 500 has surged by more than 730% since 2000, and there's plenty of growth potential still ahead.
Perhaps the best thing investors can do right now, then, is load up on quality stocks and hold them for the long haul. If history shows us anything, it's that these investments have the best shot at thriving despite potential volatility.
Should you buy stock in S&P 500 Index right now?
Before you buy stock in S&P 500 Index, consider this:
The Motley Fool Stock Advisor analyst team just identified what they believe are the 10 best stocks for investors to buy now… and S&P 500 Index wasn’t one of them. The 10 stocks that made the cut could produce monster returns in the coming years.
Consider when Netflix made this list on December 17, 2004... if you invested $1,000 at the time of our recommendation, you’d have $417,305!* Or when Nvidia made this list on April 15, 2005... if you invested $1,000 at the time of our recommendation, you’d have $1,293,148!*
Now, it’s worth noting Stock Advisor’s total average return is 936% — a market-crushing outperformance compared to 207% for the S&P 500. Don't miss the latest top 10 list, available with Stock Advisor, and join an investing community built by individual investors for individual investors.
See the 10 stocks »
*Stock Advisor returns as of June 19, 2026.
Katie Brockman has no position in any of the stocks mentioned. The Motley Fool has positions in and recommends Berkshire Hathaway. The Motley Fool has a disclosure policy.
Recommended Articles


