

Warren Buffett's Favorite Stock Market Indicator Just Hit a Dangerous Record. Here's What History Says Happens Next.
Key Points
The market has been on a seemingly unstoppable run, but a pullback is inevitable eventually.
With the Buffett indicator reaching new heights, it may be wise to exercise caution.
Choosing the right investments is more important than ever right now.
- 10 stocks we like better than S&P 500 Index ›
After a brief tumble last week, major market indexes are soaring yet again. The S&P 500 (SNPINDEX: ^GSPC) and the Nasdaq Composite (NASDAQINDEX: ^IXIC) are inching closer to new all-time highs, up by 26% and 34%, respectively, over the past 12 months, as of this writing.
Whether or not all this growth is sustainable, however, is the question on many investors' minds. Although no stock market indicator can predict the future with 100% accuracy, there's one metric Warren Buffett favors that is sounding the alarm right now.
Where to invest $1,000 right now? Our analyst team just revealed what they believe are the 10 best stocks to buy right now, when you join Stock Advisor. See the stocks »

Image source: The Motley Fool.
The Buffett indicator is reaching new heights
During the lead-up to the bursting of the dot-com bubble in the early 2000s, Buffett predicted that stocks were overvalued and would soon plunge into a bear market.
Now nicknamed the Buffett indicator, the metric behind his prediction measures the ratio between the total value of U.S. stocks and U.S. gross domestic product (GDP). The higher it climbs, the more likely it is the market is overvalued.
"If the percentage relationship falls to the 70% or 80% area, buying stocks is likely to work very well for you," Buffett explained in a 2001 interview with Fortune magazine. "If the ratio approaches 200% -- as it did in 1999 and a part of 2000 -- you are playing with fire."
As of this writing, it sits at around 233%. This metric also peaked at around 193% in November 2021, just before the market descended into a slump that would last most of the following year.
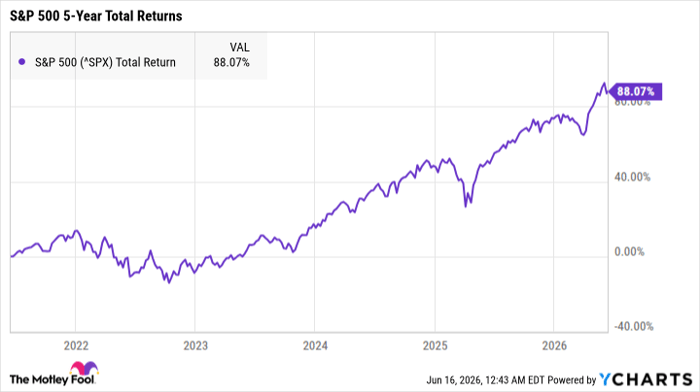
^SPX data by YCharts
To be clear, this doesn't mean a stock market crash or correction is imminent. The Buffett indicator has been steadily increasing for years, and it hasn't been below 100% since 2013. With company valuations surging with the rise of the tech sector, it's somewhat normal for this metric to trend upward.
The single best move investors can make right now
No stock market indicator can predict the future, but it doesn't hurt to be cautious right now in case history is on the path to repeating itself. If a market downturn is on the horizon, the stocks you choose will make or break your portfolio.
Some stocks are incredibly overvalued right now, and they may not hold up during the next bear market. If you're buying at record-high prices and those stocks crash hard, you risk locking in steep losses.
Healthy stocks from fundamentally sound companies are far safer investments. They will also experience pullbacks, especially if the overall market turns for the worse. But given enough time, they're more likely to recover and go on to earn positive total returns.
The more of these stocks in your portfolio, the better off you'll be -- no matter what the market throws at you.
Should you buy stock in S&P 500 Index right now?
Before you buy stock in S&P 500 Index, consider this:
The Motley Fool Stock Advisor analyst team just identified what they believe are the 10 best stocks for investors to buy now… and S&P 500 Index wasn’t one of them. The 10 stocks that made the cut could produce monster returns in the coming years.
Consider when Netflix made this list on December 17, 2004... if you invested $1,000 at the time of our recommendation, you’d have $424,531!* Or when Nvidia made this list on April 15, 2005... if you invested $1,000 at the time of our recommendation, you’d have $1,273,016!*
Now, it’s worth noting Stock Advisor’s total average return is 940% — a market-crushing outperformance compared to 209% for the S&P 500. Don't miss the latest top 10 list, available with Stock Advisor, and join an investing community built by individual investors for individual investors.
See the 10 stocks »
*Stock Advisor returns as of June 18, 2026.
Katie Brockman has no position in any of the stocks mentioned. The Motley Fool has no position in any of the stocks mentioned. The Motley Fool has a disclosure policy.
Recommended Articles


