Gold Price Forecast: XAU/USD holds gains above $4,300 amid cautious markets

Source Fxstreet
  • Gold struggles to rally beyond $4,300 after rallying about 6.5% in the last three trading days.
  • Enthusiasm about the US-Iran peace has turned to caution, with markets awaiting details of the deal.
  • XAU/USD bulls are likely to face significant resistance around $4,400.

Gold (XAU/USD) maintains a mildly positive tone on Tuesday, holding gains after rallying about 6.5% over the last few days. The precious metal's recovery, however, has lost steam after crossing the $4,300 line and remains practically flat as the initial enthusiasm about the US-Iran peace deal faded, with investors awaiting details of the agreement and monetary policy decisions by major central banks.

US President Donald Trump said that the deal has already been signed and that the details might be released before Friday. Investors, meanwhile, await more clarity on factors such as traffic through the Strait of Hormuz, which has sent global inflation soaring over the last three months, and Iran’s nuclear program, as the possibility of a re-escalation of the conflict has not been completely ruled out.

Apart from that, traders are also awaiting monetary policy decisions by some of the world’s major central banks, including the US Federal Reserve (Fed). The market will be eager to assess whether the peace deal has prompted policymakers to set aside plans for monetary tightening.

Technical Analysis: Gold's broader trend remains bearish

XAU/USD Chart Analysis


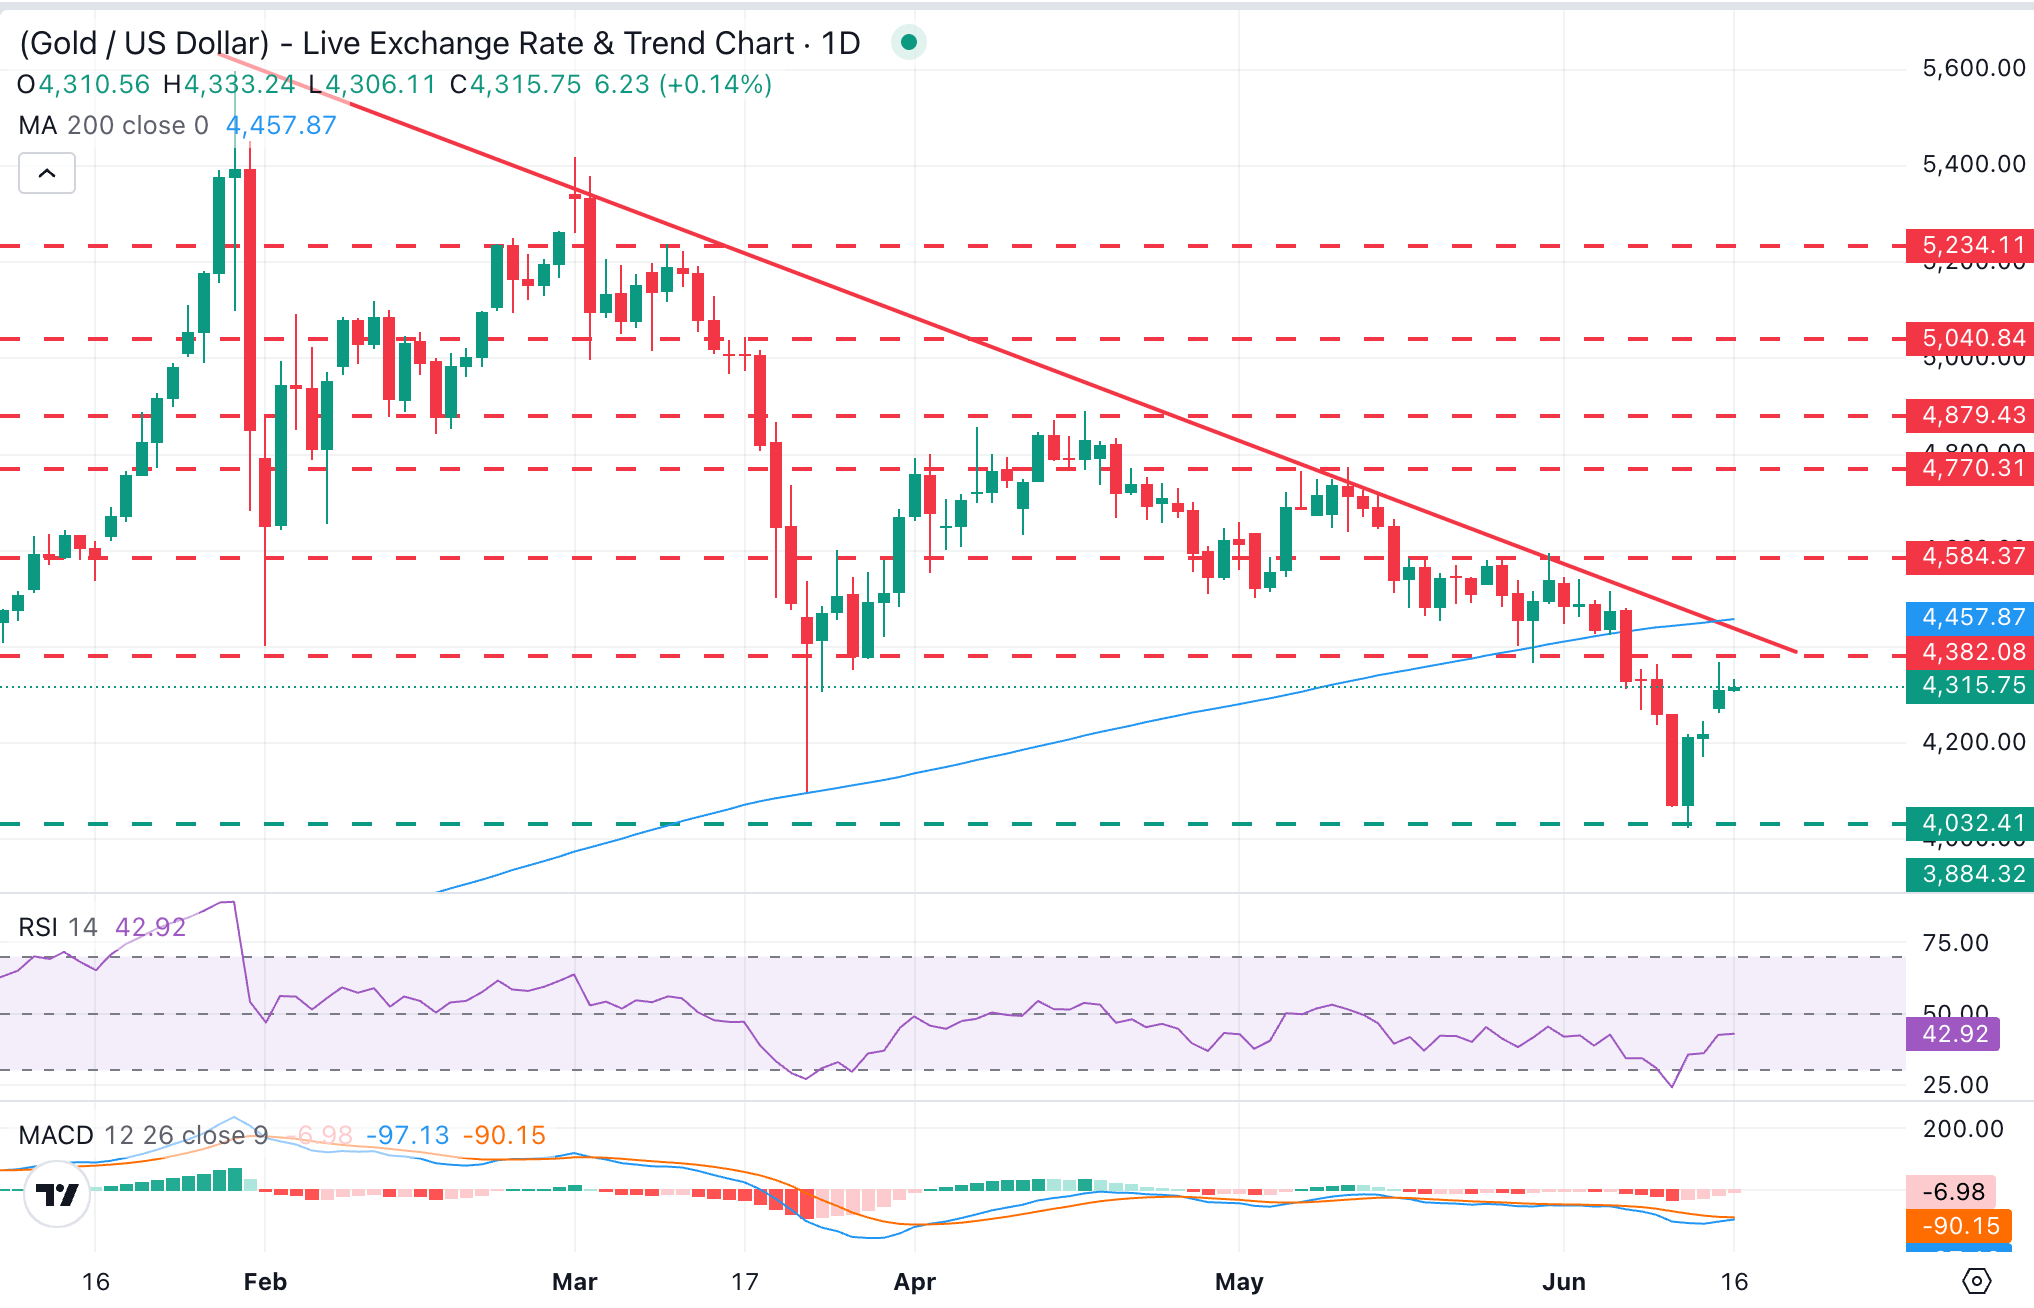
XAU/USD trades at $4,315, extending a corrective phase below a dense band of nearby resistances. Momentum indicators in the daily chart are picking up but not yet at bullish levels. The Relative Strength Index (RSI) is hovering around 43, and the Moving Average Convergence Divergence (MACD) holds in negative territory, suggesting downside pressure is still dominant despite the recent stabilization.

Gold bulls are likely to be tested around $4,400. A previous support area near $4,380 (May 27,28 lows) is likely to act now as resistance ahead of the descending trendline from January's peak, now around $4,430, and the key 200-day SMA, around $4,465. Further up, the target is the late-May highs, at the $4.590 area.

On the downside, Monday's low at the $4,260 area might provide support ahead of last week's low of $4,023. A bearish reaction below that level brings the late October 2025 level, at $3,888, into play.

(The technical analysis of this story was written with the help of an AI tool.)


Disclaimer: For information purposes only. Past performance is not indicative of future results.
placeholder
Will the Tech Rally Continue? The Technical Verdict on the NASDAQ 100 Riding a massive 32% post-earnings wave, the Nasdaq-100 is showing its first signs of exhaustion. We break down crucial exit and entry rules for long positions this week.
Author  Mitrade Team
6 Month 05 Day Fri
Riding a massive 32% post-earnings wave, the Nasdaq-100 is showing its first signs of exhaustion. We break down crucial exit and entry rules for long positions this week.
placeholder
US Attacks Iran Amid the “Ceasefire”: Bitcoin, Gold, and Oil ReactThe United States launched strikes against Iran on Tuesday after a US Apache helicopter was downed over the Strait of Hormuz, breaking the fragile ceasefire previously announced by President Donald Tr
Author  Mitrade Team
6 Month 10 Day Wed
The United States launched strikes against Iran on Tuesday after a US Apache helicopter was downed over the Strait of Hormuz, breaking the fragile ceasefire previously announced by President Donald Tr
placeholder
Lincoln National vs. MetLife: Which Financial Stock Is a Better Buy in 2026?Key PointsLincoln National offers a specialized focus on U.S. retirement and life insurance markets.MetLife provides massive global diversification across forty international marke
Author  Mitrade Team
6 Month 10 Day Wed
Key PointsLincoln National offers a specialized focus on U.S. retirement and life insurance markets.MetLife provides massive global diversification across forty international marke
placeholder
15 Days After SpaceX Listing, Index Funds Will Take 30% of Floating Shares, What It Means for Retail Investors?TradingKey - SpaceX (SPCX.US) is set to debut on Nasdaq on June 12, targeting a valuation of $1.75 trillion. At that time, only about 3% to 4% of total shares will be freely tradable; with founder sha
Author  Mitrade Team
6 Month 10 Day Wed
TradingKey - SpaceX (SPCX.US) is set to debut on Nasdaq on June 12, targeting a valuation of $1.75 trillion. At that time, only about 3% to 4% of total shares will be freely tradable; with founder sha
placeholder
Gold Price Analysis (XAU/USD): Gold Falls to 6-Month Low as Inflation Fuels Rate Hike Bets, A Buying Opportunity or a Falling Knife? Gold hit a 6-month low on Fed rate hike bets. However, strong central bank buying and technical indicators suggest potential tactical bounces and long-term accumulation windows.
Author  Mitrade Team
6 Month 12 Day Fri
Gold hit a 6-month low on Fed rate hike bets. However, strong central bank buying and technical indicators suggest potential tactical bounces and long-term accumulation windows.
Related Instrument
goTop
quote