

WTI Crude Oil Price Trend Forecast: Oil Prices May Face a Sharp Decline
TradingKey - As of today's (June 16) European session, the crude oil market has continued to weaken on expectations of an impending preliminary US-Iran agreement. The market may begin trading on the supply recovery logic, increasing downward pressure on oil prices. As of press time, WTI crude ( USOIL) fell 1.63% to $79.85.
Market focuses on whether the US-Iran agreement can be successfully signed, while the demand side continues to exert downward pressure on oil prices.
Recently, as a preliminary peace framework between the U.S. and Iran nears completion, the market's trading logic has begun to shift. Trump has signaled a push to sign the agreement, reopen the Strait of Hormuz, and lift some blockades, while Iran has also confirmed progress on the text of the agreement, prompting the crude market to potentially price in a supply recovery ahead of schedule. Looking at the chart, WTI fell to near $80, indicating that the market is rapidly squeezing out the risk premium previously generated by geopolitical tensions.
However, a recovery in supply does not mean oil prices will experience a one-way decline. Even if the Strait of Hormuz is reopened, actual tanker transit, shipping insurance, port scheduling, and the resumption of buyer purchases will all take time. Market analysts believe that restoring tanker traffic could take several weeks, and the resumption of production and exports may also proceed in phases. As long as the agreement has not been officially signed, or if the implementation details remain unclear after signing, oil prices still have room for volatile fluctuations.
Meanwhile, inventories are also providing some support for oil prices. The EIA’s latest Short-Term Energy Outlook shows that restricted transit through the Strait of Hormuz has already significantly tightened the global oil market, with global petroleum inventories projected to decline by an average of 8.5 million barrels per day in the second quarter of 2026. This indicates that the prior conflict in the Middle East was not just sentiment-driven but has caused actual inventory depletion. Even if the U.S.-Iran agreement progresses, replenishing global inventories will take time. If summer travel demand rebounds, low inventory levels could limit the room for further deep declines in WTI.
On the demand side, this remains the key factor capping any rebound in oil prices. Currently, global crude demand is sluggish, with Asian demand performing particularly weakly. China's crude imports in May fell 29% year-on-year to an eight-year low, indicating that high oil prices, supply instability, and pressure on refining margins have significantly dampened buying interest. Weakness on the demand side means that once Middle Eastern supply recovers, it will be difficult for the market to continue justifying high oil prices with supply tightness. Meanwhile, U.S. crude and refined product exports remain high, mitigating the Middle East supply gap to some extent and leaving the spot market less tight than previously expected.
WTI Crude Oil Trend Analysis: Short-term bearish, focus on the $79 support level.
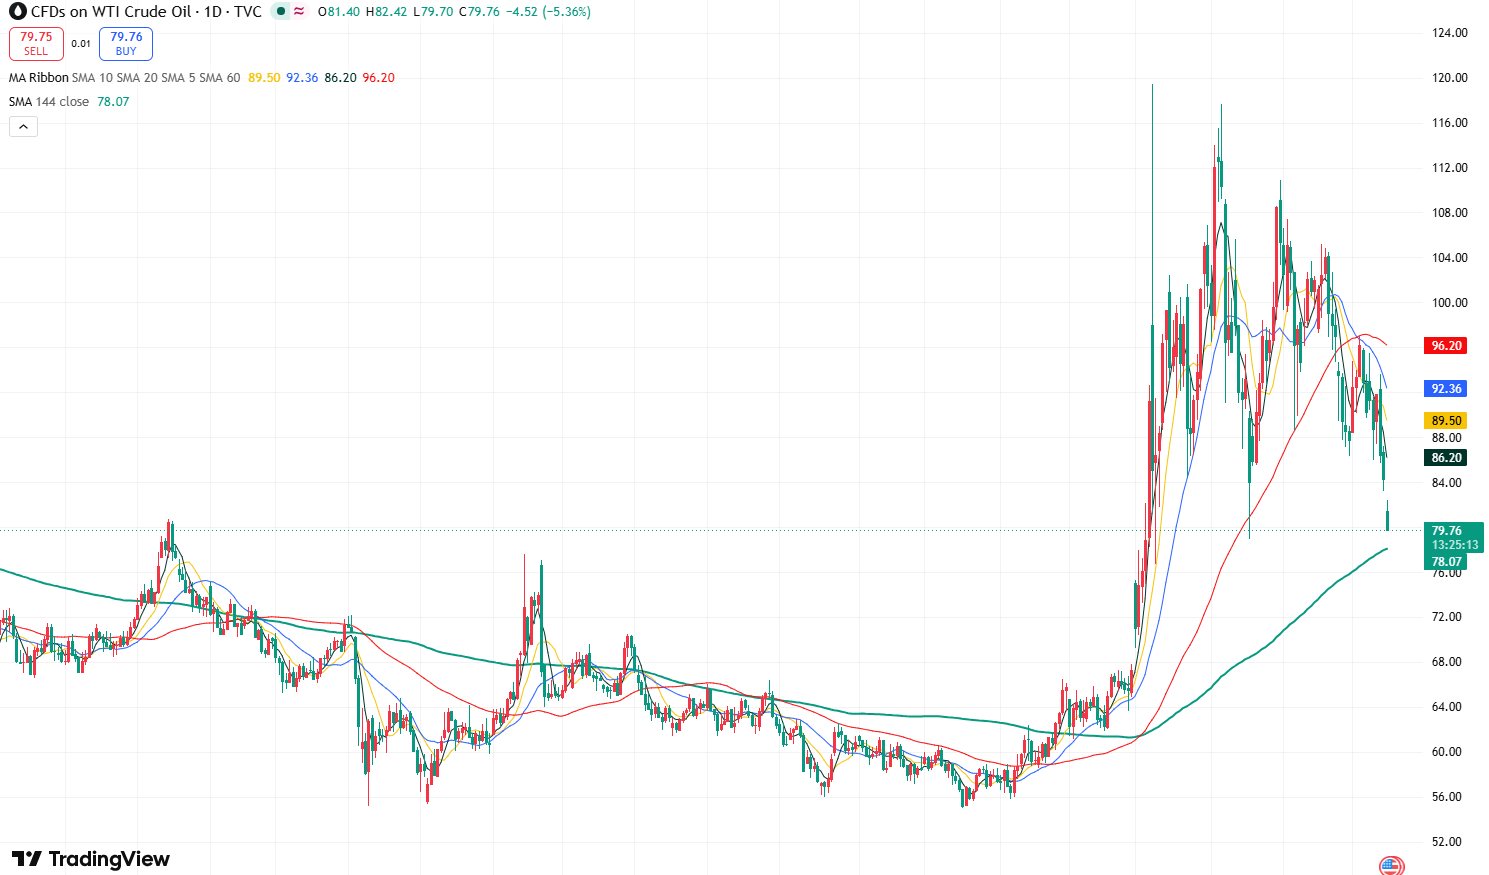
WTI Crude Oil Price Weekly Chart, Source: TradingView
From WTI's weekly chart, following a sharp 6.6% drop last week, oil prices opened lower with a gap and continued to decline this week, significantly boosting bearish momentum in the market. The downward trend could persist for the remainder of the trading week.
Currently, WTI's primary downside target is to test the support at the April low of $78.97. If this level fails to hold, oil prices could open up room for further decline toward the $76.60 support level, and potentially even move lower to fill the gap between $67.28 and $75.00.
On the upside, if WTI fails to break below the $78.97 support, oil prices may see a short-term technical rebound, with the primary target of filling the $84.28-$81.40 gap.
Recommended Articles


