

Top 3 Price Prediction Bitcoin, Ethereum, Ripple: Bulls target $100,000 BTC, $2,000 ETH, and $3 XRP
- Bitcoin price stabilizes around $95,000 on Wednesday; a breakout suggests gains toward $100,000.
- Ethereum nears key resistance at $1,861; a decisive close above could pave the way for a bullish run.
- XRP closes above $2.23 resistance, indicating an uptrend ahead.
Bitcoin (BTC) is stabilizing around $95,000 at the time of writing on Wednesday, and a breakout suggests gains toward $100,000. Ethereum (ETH) and Ripple (XRP) followed BTC’s footsteps and hovered around their key levels. The technical outlook suggests a breakout of these coins above the key resistance level could pave the way for a bullish run, targeting $100,000 BTC, $2,000 ETH, and $3 XRP.
Bitcoin bulls could aim higher above $95,000
Bitcoin price broke above its 200-day Exponential Moving Average (EMA) at $85,000 early last week, rallying 11.14% until Friday. However, BTC failed to close above its March high of $95,000 and hovered around this level in the last four days. At the time of writing on Wednesday, it continues to stabilize around the $95,000 level.
If BTC breaks and closes above $95,000 on a daily basis, it could extend the rally to retest its next daily resistance at $97,000. A successful close above this level could extend additional gains to retest its psychological resistance at $100,000.
The Relative Strength Index (RSI) on the daily chart holds at 66, suggesting bullish momentum, and still has room for further gains before hitting overbought conditions.
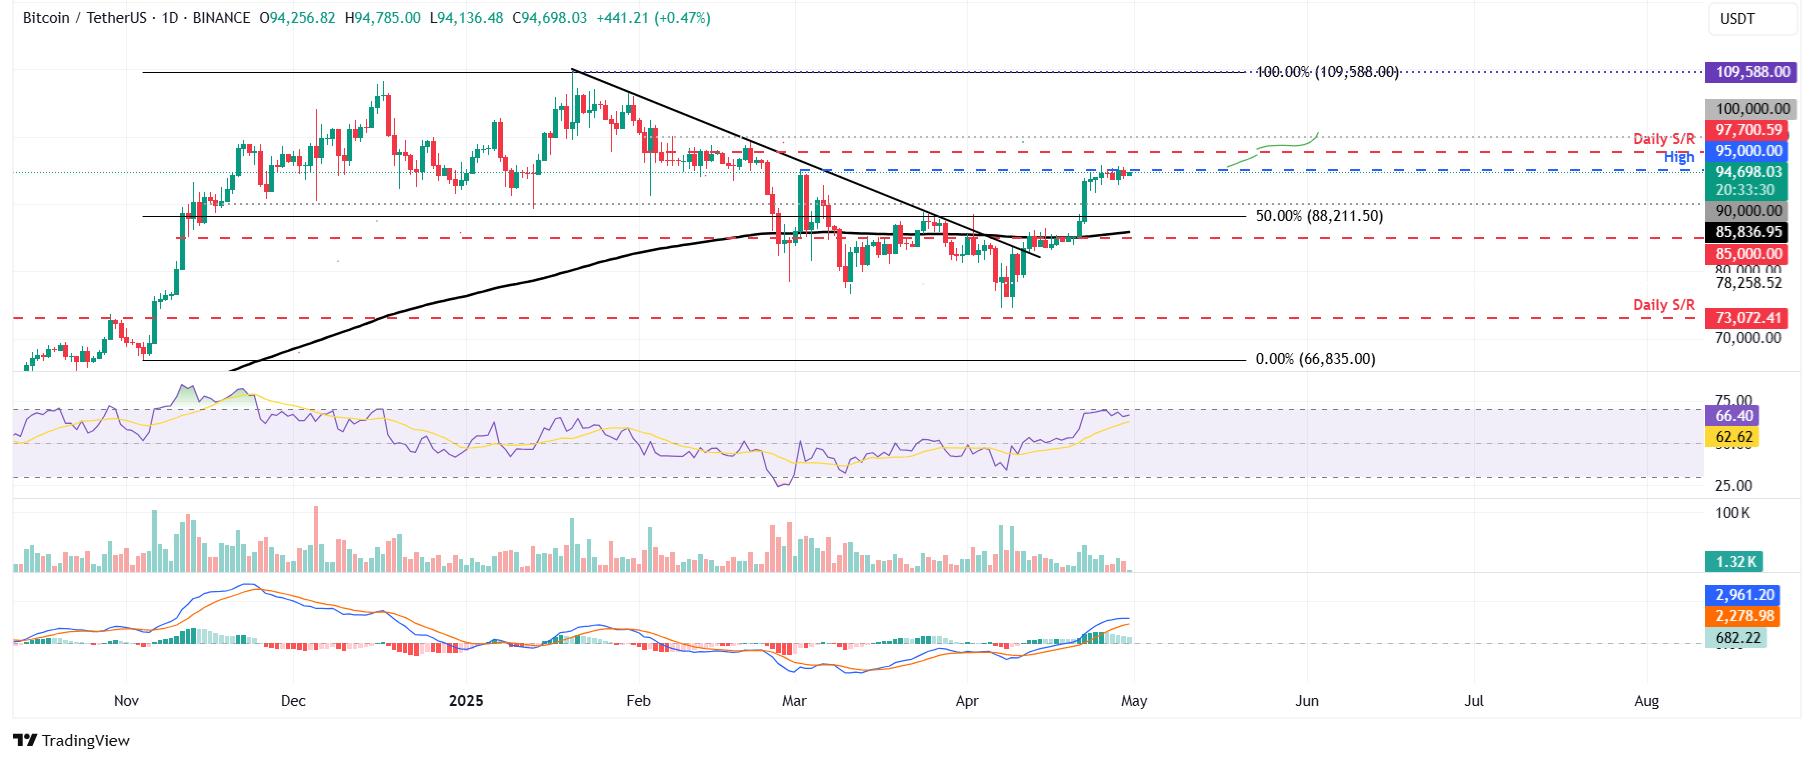
BTC/USDT daily chart
However, if BTC fails to close above the $95,000 resistance level and faces a pullback, it could extend the decline to find support around the $90,000 psychological importance level.
Ethereum could rally toward $2,000 if it closes above key resistance
Ethereum price broke above the $1,700 resistance level on April 22 and rallied by 14.86% until Saturday. However, ETH retested the daily resistance level at $1,861 the next day and declined slightly. ETH has been consolidating around $1,740 for the past two days. At the time of writing on Wednesday, it continues to hover around $1,800.
If ETH breaks and closes above the daily resistance at $1,861, it could extend the rally to retest its psychological importance level at $2,000.
The RSI on the daily chart reads 55 above its neutral level of 50, indicating bullish momentum.
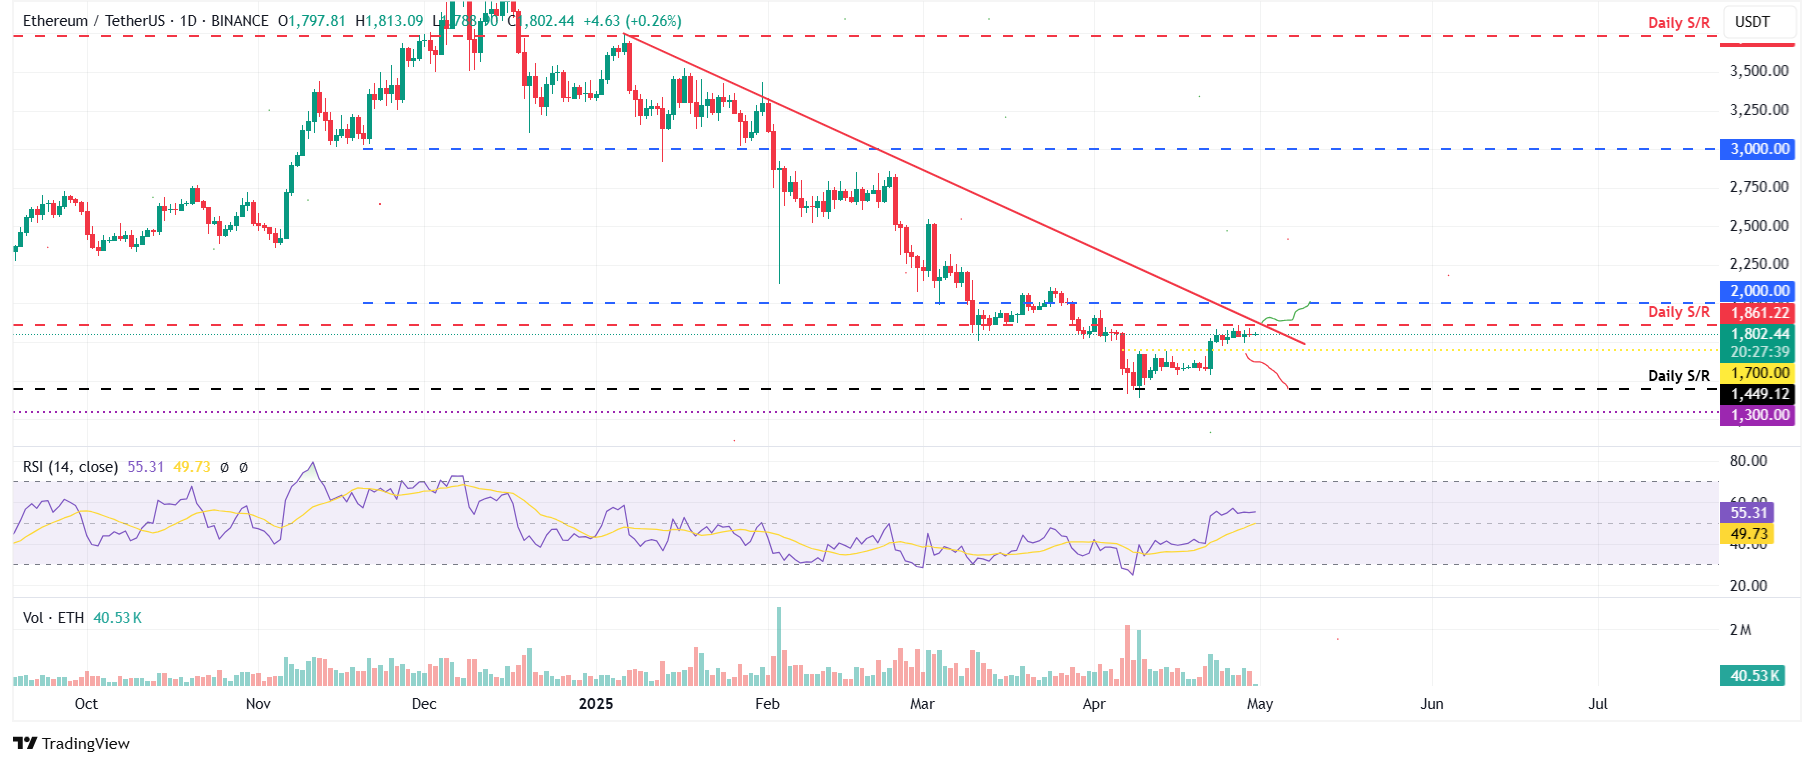
ETH/USDT daily chart
Conversely, if ETH declines and closes below $1,700, it could extend the losses to retest its next daily support at $1,449.
XRP finds support around its 50-day EMA
XRP price broke above the 50-day EMA level at $2.20 on Sunday and rallied by 4.77%, surpassing the daily resistance level at $2.23. However, it declined slightly on Tuesday. At the time of writing on Wednesday, it is retesting its support level at $2.20.
If the support level at $2.20 holds, XRP will extend the rally to retest its March 24 high of $2.50 before potentially reaching $3.00.
The RSI on the daily chart reads 55 above its neutral level of 50, indicating bullish momentum.
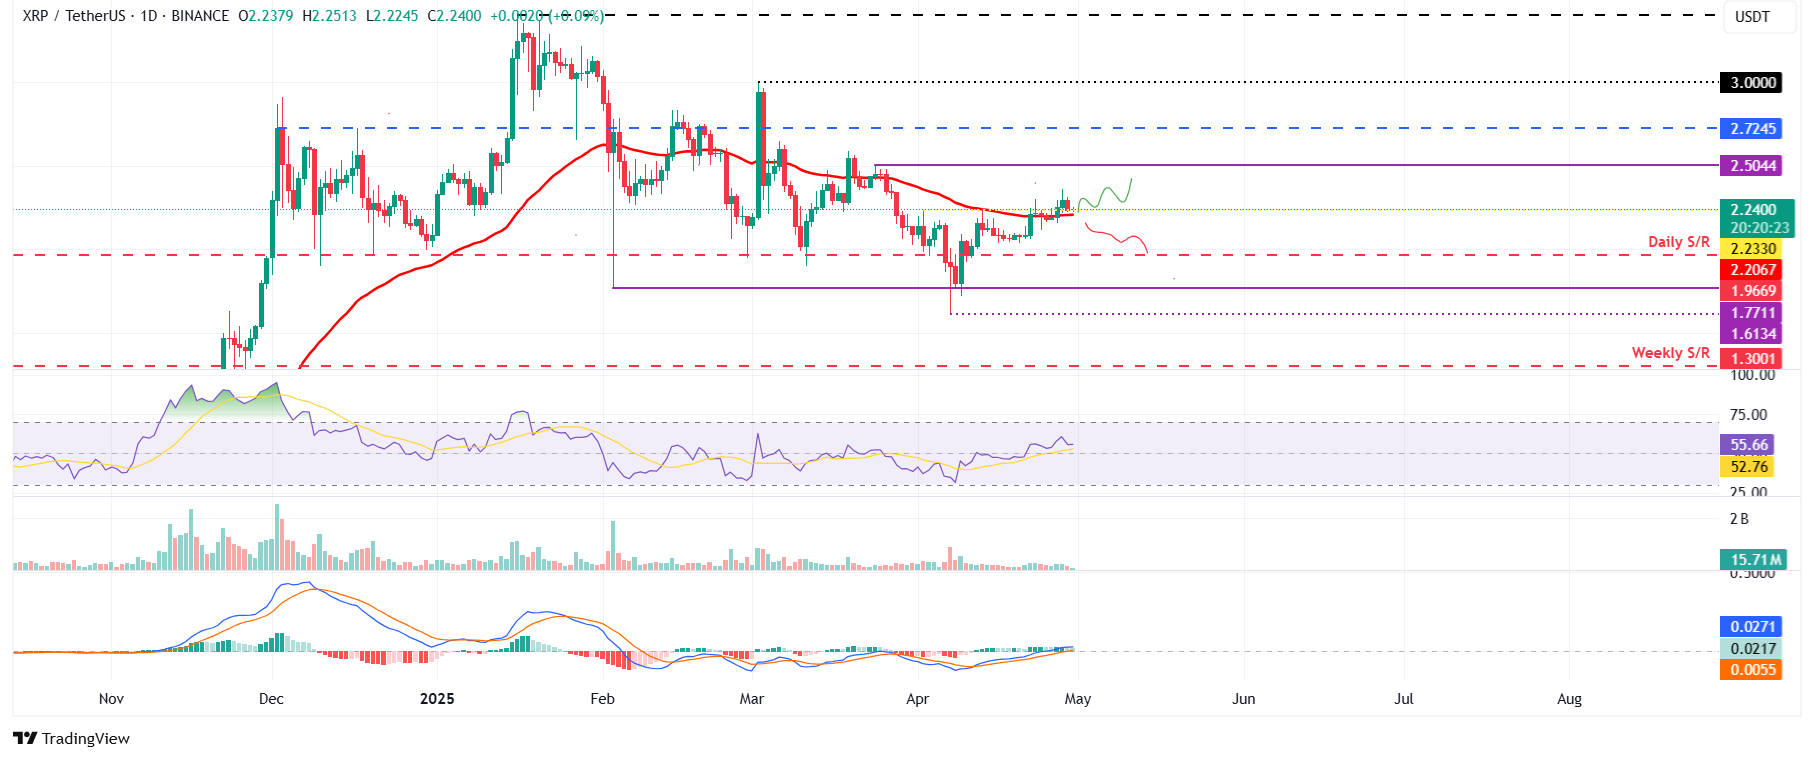
XRP/USDT daily chart
On the other hand, if XRP fails to find support around the $2.20 level, it could extend the decline to retest its next support level at $1.96.
Bitcoin, altcoins, stablecoins FAQs
Bitcoin is the largest cryptocurrency by market capitalization, a virtual currency designed to serve as money. This form of payment cannot be controlled by any one person, group, or entity, which eliminates the need for third-party participation during financial transactions.
Altcoins are any cryptocurrency apart from Bitcoin, but some also regard Ethereum as a non-altcoin because it is from these two cryptocurrencies that forking happens. If this is true, then Litecoin is the first altcoin, forked from the Bitcoin protocol and, therefore, an “improved” version of it.
Stablecoins are cryptocurrencies designed to have a stable price, with their value backed by a reserve of the asset it represents. To achieve this, the value of any one stablecoin is pegged to a commodity or financial instrument, such as the US Dollar (USD), with its supply regulated by an algorithm or demand. The main goal of stablecoins is to provide an on/off-ramp for investors willing to trade and invest in cryptocurrencies. Stablecoins also allow investors to store value since cryptocurrencies, in general, are subject to volatility.
Bitcoin dominance is the ratio of Bitcoin's market capitalization to the total market capitalization of all cryptocurrencies combined. It provides a clear picture of Bitcoin’s interest among investors. A high BTC dominance typically happens before and during a bull run, in which investors resort to investing in relatively stable and high market capitalization cryptocurrency like Bitcoin. A drop in BTC dominance usually means that investors are moving their capital and/or profits to altcoins in a quest for higher returns, which usually triggers an explosion of altcoin rallies.
บทความแนะนำ


